王新刚 , 孔云峰
, 孔云峰
河南大学环境与规划学院,河南 开封 475001
WANG Xin-gang, KONG Yun-feng
中图分类号: P208
文献标识码: A
文章编号: 1000-0690(2015)05-0615-07
收稿日期: 2014-01-18
修回日期: 2014-03-20
网络出版日期: 2015-05-20
版权声明: 2015 《地理科学》编辑部 本文是开放获取期刊文献,在以下情况下可以自由使用:学术研究、学术交流、科研教学等,但不允许用于商业目的.
基金资助:
作者简介:
作者简介:王新刚(1972-),男,河南郑州人,博士研究生,主要从事城市问题、城市住房研究。E-mail:wuhanwxg@163.com
展开
摘要
针对地理加权回归(GWR)模型不能有效处理样本数据空间自相关性这一问题,构造局部时空窗口统计量,尝试改进时空加权回归(GTWR)模型。定义多时空窗口的概念,给出其选取、计算和验证方法;计算时空窗口包含的各样本点的被解释变量平均值,与样本拟合点的被解释变量值的比值,作为新的解释变量,构建改进的时空加权回归(IGTWR)模型。以土地稀缺、多中心、资源型城市——湖北省黄石市为例,收集2007~2012年商品住宅成交价格1.93万个数据和398个楼栋样本点,选取小区等级、绿化率、楼栋总层数、容积率、距区域中心距离和销售年份6个解释变量,分别利用常规线性回归(OLS)、GWR、GTWR和IGTWR方法进行回归分析。模型结果表明:计算Moran’s I指数和分析时间序列的自相关性,能确定时空窗口的大小和数量的选取;IGTWR模型和各变量的回归统计均通过0.05的显著性水平检验,有关解释变量的系数估计值在空间分布上能合理解释;GWR拟合结果优于OLS,GTWR优于GWR,而IGTWR拟合精度最好。与GTWR模型分析相比, IGTWR模型R2从0.877提升到0.919,而AICc、残差方(RSS)和均方差(MSE)分别从6 226、49 996 201和354.427下降到6 206、32 327 472和284.969。案例研究表明:IGTWR能够表达一定时空范围的时空自相关特征,减小了估计误差,提高了回归拟合精度。
关键词:
Abstract
Geographically weighted regression (GWR) is a useful technique for exploring spatial nonstationarity by calibrating a regression model which allows different relationships to exist at different points in space. However, spatial autocorrelation can invalidate the model assumption and sometimes may result in residual dependency. This article aims to improve the spatiotemporal weighted regression (GTWR) by introducing additional variables based on spatiotemporal windows. The size parameters for defining spatiotemporal windows are estimated by spatial and temporal statistics of all the sample data. The new window variables are calculated by averaging the explained variables which are located in its spatio-temporal window. The new variables are added in GTWR as an improved regression (IGTWR) model. Huangshi City, a resource-dependent, land-scarce and multi-center city in Hubei Province, is selected as the study area. 19 300 commercial housing units and 398 buildings in 2007-2012 are collected as sample data. Based on general and spatial statistics, the number of building floors, the plot ratio, the greening ratio, the level of property management, the distance to region center, and the year of sale are selected as explanatory variables. The sample data are analyzed by four regression models respectively: ordinary linear regression (OLS), GWR, GTWR and IGTWR. The optimum size and number of spatiotemporal window are estimated by the Moran's I index and the correlation coefficients between temporal sequences. Modeling results indicate that both the IGTWR model and its variables pass the statistical test at the significant level 0.05. The spatial distribution of the variable coefficients can be explained reasonably. The comparison of all modeling results shows that GWR is better than OLS, GTWR is better than GWR, and IGTWR is better than GTWR, in terms of the measure of goodness of fit (R2), the Akaike information criterion (AICc) , the residual sum of squares (RSS) and the mean squared error(MSE). In the case study, compared with GTWR, the R2, AICc, RSS and MSE from IGTWR are improved from 0.877 to 0.919, 6 226 to 6 206, 49 996 201 to 32 327 472 and 354.427 to 284.969 respectively. The case study indicates that the IGTWR model is effective for temporal and spatial analysis of urban housing price. By introducing window based indicators in GTWR model as new variables, the IGTWR model may estimate the impact of spatial and temporal autocorrelation between geographic data, and thus is able to reduce the model error and increase the model accuracy.
Keywords:
城市住房价格一直是社会关注度最高的热点问题之一。分析和预测住房价格的空间分布和变化趋势是居民、投资者、开发商以及政府管理部门关注的重要问题,也是学者研究的热点问题。城市住房价格与空间区位密切相关,且具有空间自相关特征,因此常采用空间自回归(SAR)或地理加权回归(GWR)模型分析住房价格各影响要素的空间分布规律[1~4] 。受房地产市场趋势和国家宏观政策影响,时间也是影响城市住房价格的重要因素之一[5~7]。考虑时间因素影响,有学者建立时空自回归模型或时空加权回归(GTWR)模型[8~12]。然而,在时空回归模型中,时间因素未作为解释变量。同时,为了研究局部时空的影响,本文引入时空窗口,根据时空的自相关性分析,建立改进的时空加权回归(IGTWR)模型,从局部时空的角度,分析、估计和解释住房价格的变化规律。
在XYT时空坐标系中,通常定义点I(xi,yi,ti)的时空窗口(STW)为距离(xi,yi)小于r、距离ti小于t的圆柱区域[13]。给定空间距离r和时间间隔t,本文定义点I的多个时空窗口 SmTnW(m=1,2…;n=1,2…),即为距离(xi,yi)大于(m-1)r且小于mr、距离ti大于(n-1)t且小于nt的时空区域;m与n的取值的大小表示窗口SmTnW与点I的邻近程度。
对于时空样本点I,为研究不同局部时空邻域内的样本点对其时空相关性影响,可选择其多个时空窗口SmTnW作为局部时空邻域,进行局部时空相关性分析。
地理时空回归分析中,距离r和间隔t的选择要能够反映地理时空变异的尺度特征。可通过计算Moran’s I指数估计r值[13]。同样,时间间隔t,其设定先验值[14]或可根据时间序列相关性进行估计。
为了兼顾考虑空间和时间的相关性,有学者提出时空权重矩阵 [10]。针对某样本点的STW而言,为简便计算,可将其包含的各样本点的变量值取平均值,分析本样本点与其STW的局部时空相关性。
GWR作为局部回归拟合方法,将地理位置坐标引入模型,处理空间异质性,探测相关变量空间变化规律 [3]。GWR利用空间变化的回归系数进行拟合估测,并未直接考虑空间依赖性[15],模型残差ε具有不确定性,可能包含部分能够建模的时空相关性。GTWR是在GWR模型的基础上,将空间位置坐标和时间序列坐标构成三维坐标,同时考虑空间和时间对各解释变量的回归系数的影响[10]。时空坐标系中,时空位置i的坐标为(ui,vi,ti),GTWR模型为:
式中,Yi为样本点i的被解释变量值 (i = 1,2,…,n),n为样本点的数目,m为解释变量的数目;ti为第i个样本点的时间坐标;α0(ui,vi,ti)表示样本点i的时空截距项;Xij表示样本点i的第j个解释变量值;αj(ui,vi,ti)表示样本点i处第j个变量的回归系数,是时空坐标的函数;εi表示残差。时空权重函数wi(ui,vi,ti)=wi(ui,vi)wi(ti),其中wi(ui,vi)是空间权重,wi(ti)为时间权重。计算时空距离时,可乘以参数λ作为时空权重的平衡因子。
因将时空三维坐标引入模型,GTWR能提高模型拟合精度,且从时空三维角度提供各解释变量对因变量的影响分析,具有比较好的解释力。但模型处理中时间因子是通过坐标影响其他解释变量的回归系数发挥作用,其自身未列入解释变量,给定某时空范围的自相关性在模型中未能体现;模型仅考虑某个核(固定核或自适应核)的局部时空邻域影响,而其他局部时空影响并未兼顾。
为有效处理时空自相关性,减少残差的不确定性,基于某样本点的时空窗口STW,计算STW包含的各样本点的被解释变量平均值(STW内无样本点时值为0),与样本拟合点的被解释变量值求比值,产生新的解释变量[11],构造局部时空统计量,对模型进行扩展,可获取某些动态的时间影响[8]。改进模型IGTWR公式如下:
式中,Yi、m、Xij、α0(ui,vi,ti)、αj(ui,vi,ti)、εi表示的含义同式(1);αk(ui,vi,ti)表示样本点i处第k个时空窗口变量的回归系数;Xik表示样本点i的第k个时空窗口变量值,p表示时空窗口的数目。
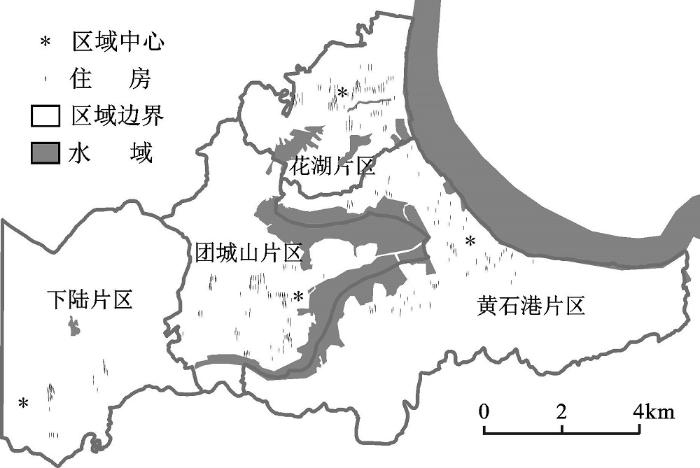
本文选取湖北省黄石市作为研究区。黄石市位于湖北省东南部,长江中游南岸,是武汉城市圈副中心城市,中国中部地区重要的原材料工业基地。黄石市是典型的资源型组团城市,地形较为复杂、土地稀缺;城区发展采用中心组团式布局结构,受地形条件、传统产业布局和2001~2020年城市规划影响,分为4个组团片区:铁山区、下陆区为工矿区;黄石港区南部为商业中心区,北部为花湖物流中心区;团城山区北部沿湖为行政中心区(图1)。
选择2007~2012年商品住宅成交价格数据1.93万个。为便于作整体分析,按楼栋计算平均住房单价,共获得398个楼栋样本点。研究区域样本住房呈非均匀分布(图1),针对样本数据进行相关分析,发现价格与销售年份、楼栋总层数、小区容积率、小区等级、绿化率呈现或强或弱的线性相关关系。运用探索性空间数据分析,住房价格的Moran’s I为0.196,具有较强的空间正自相关性;聚类和异常值分析,表明住房价格具有局部空间异质性;住房所在区域和区位对价格影响显著。
选择价格解释变量:反映土地稀缺和建筑成本的楼栋总层数(FL)和容积率(PR),反映社区环境的小区等级(CL)和绿化率(GR),反映城市区位属性的住房距区域中心的距离(ND),以及反映宏观经济和政策变化的销售年份(YI)。其中,小区等级划分为4个等级(四级为最高级,赋值为4);销售年份以2005年为基准,转化为年度索引值。计算各解释变量的方差膨胀因子进行检验[15],发现其值均小于2,远小于10,表明解释变量间的多重共线性现象较弱,适合于回归分析。
运用常规线性回归(OLS)进行全局估计,结果见表1。模型拟合度R2=0.495,能合理解释49.5%的住房价格变化原因。由于空间的异质性,变量之间的关系是随空间位置的变化而变化的,OLS模型并未考虑这种变化特征,尚有50.5%的住房价格的变化未能解释。进一步利用GWR模型进行局部统计分析,结果见表1。GWR模型的拟合度R2为0.824,与OLS模型的拟合度相比,有大幅度的提高;统计检验F值为2.925,相应概率P值为0.000,通过显著性水平为0.05的F检验,住房均价与影响因素之间的整体关系确实存在显著的空间非平稳性。
表1 OLS和GWR回归系数的估计结果
Table 1 The estimation results of OLS and GWR regression parameters
| 变量 | OLS 模型 | GWR 模型 | ||||||
|---|---|---|---|---|---|---|---|---|
| 系数 | 标准差 | t检验 | P值 | 系数 | 标准差 | t检验 | P值 | |
| CL | 264.142 | 43.123 | 6.122 | 0.000 | 210.802 | 131.452 | 1.334 | 0.000 |
| GR | 23.015 | 4.256 | 5.403 | 0.000 | 14.613 | 8.155 | 1.245 | 0.000 |
| FL | 32.133 | 6.088 | 5.275 | 0.000 | 23.204 | 22.323 | 1.306 | 0.020 |
| PR | 64.312 | 35.265 | 1.823 | 0.030 | 294.105 | 313.566 | 1.594 | 0.000 |
| ND | -14.324 | 48.892 | -0.298 | 0.760 | -172.682 | -167.162 | -1.016 | 0.060 |
| YI | 283.693 | 24.623 | 11.512 | 0.000 | 137.728 | 137.678 | 4.735 | 0.000 |
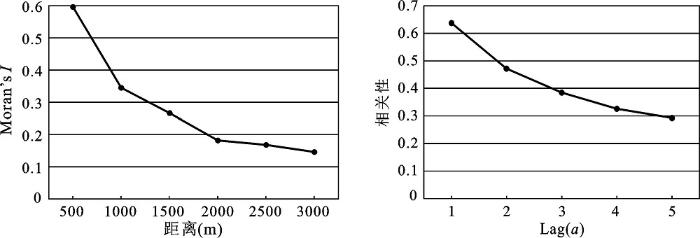
进行住房价格的Moran’s I空间自相关分析(图2a),当距离为500 m时,Moran’s I指数值为最大,所以可取500 m作为时空窗口的单位空间距离r。对住房价格以年份进行时间序列的自相关分析(图2b),当时间间隔为1 a时,时间自相关的系数值为最大,因此可取1 a作为时空窗口的单位时间间隔t。
根据时空窗口STW的r(500 m)和t(1a),在空间距离小于500 m时,取5个时空窗口S1T1W、S1T2W、S1T3W、S1T4W、S1T5W,其时间距离分别为小于1 a、1~2 a、2~3 a、3~4 a和4~5 a;考虑到计算量,在空间距离为500~1 000 m时,仅取2个时空窗口S2T1W、S2T2W,其时间距离分别为小于1 a、1~2 a。计算各样本点的时空窗口,产生相应的7个窗口新变量。
在SAS9.1软件环境中,编程进行GTWR和IGTWR模型计算。考虑到本研究区域的样本点非均匀性分布和时空权重的计算,模型权函数选用Gauss自适应核函数,避免了某些样本点的邻近样本数据稀疏而造成的估计偏差[3]。
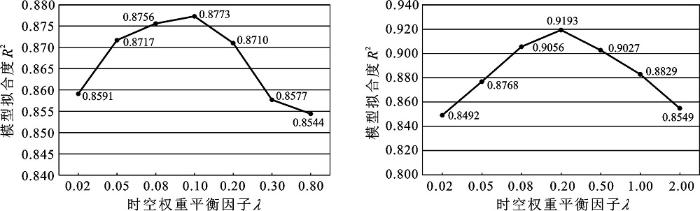
GTWR和IGTWR模型计算时,可以根据回归拟合度R2确认获取最佳的时空权重平衡参数λ[7]。GTWR模型参数λ选择的细节如图3a所示,当λ=0.1时,回归拟合度R2有最大值0.877 3,所以选取0.1为最佳的λ。IGTWR模型参数λ选择的细节如图3b,当λ=0.2时,回归拟合度R2有最大值0.919 3,所以选取0.2为最佳的λ。
GTWR和IGTWR模型分析结果,见表2。两个模型检验:统计检验F值分别为3.046、4.104,相应概率P值均为0.000,均通过显著性水平为0.05的F检验;各变量回归统计t检验的显著性概率P均小于0.05,均通过显著性水平为0.05的t检验,表明各回归系数随时空的变化均具有显著性。
IGTWR模型计算中,选用7个时空窗口变量。为验证STW选取是否合理,取10个时空窗口,分别计算出其住房价格平均值,直接作为模型的新解释变量,模型结果表明:S1T1W、S1T2W、S1T3W、S1T4W、S1T5W、S2T1W、S2T2W、S2T3W、S2T4W、S2T5W的回归系数分别为-0.109、0.033、0.093、0.080、-0.150、-0.100、
-0.068、-0.019、-0.012、-0.009,反映了各个时空窗口对样本点住房价格的影响程度不同;从S2T2W之后,回归系数绝对值低于2%,因此仅取前7个STW具有合理性。
相比GTWR,IGTWR模型拟合度R2从87.7%提高到91.9%,AICc从6 226降低到6 206,F统计从3.046提升到4.104,残差平方和RSS从49 996 201降低到32 327 472,均方误差MSE从354.427降低到284.969。分析表明,IGTWR比GTWR能较好改进回归拟合的精度,减少了估计的误差。
图2 时空窗口单位距离和单位时间的最优值
Fig.2 The appropriate units of distance and time lag in the spatiotemporal windows
图3 GTWR及IGTWR模型参数λ选择
a.GTWR模型 b.IGTWR模型
Fig.3 The parameters λ selection for the GTWR model and the IGTWR model
表2 GTWR和IGTWR回归系数的估计结果
Table 2 The estimation results of GTWR and IGTWR regression parameters
| 变量 | GTWR 模型 | IGTWR 模型(r=0.5 km,t=1 a) | ||||||||||
|---|---|---|---|---|---|---|---|---|---|---|---|---|
| 最小值 | 中值 | 最大值 | 均值 | t检验 | P值 | 最小值 | 中值 | 最大值 | 均值 | t检验 | P值 | |
| CL | -2867.193 | 165.244 | 2231.183 | 276.852 | 4.232 | 0.000 | -417.322 | 99.966 | 823.353 | 145.245 | 5.346 | 0.000 |
| GR | -181.562 | 5.302 | 477.492 | 11.833 | 3.223 | 0.000 | -36.433 | 10.975 | 129.874 | 10.316 | 3.053 | 0.000 |
| FL | -96.943 | 33.891 | 95.763 | 32.091 | 2.456 | 0.000 | -59.315 | 26.434 | 68.336 | 21.036 | 3.086 | 0.000 |
| PR | -400.376 | 73.003 | 1811.225 | 175.270 | 3.125 | 0.000 | -394.116 | 125.052 | 1822.655 | 168.225 | 4.235 | 0.000 |
| ND | -3121.423 | -135.422 | 1419.204 | -303.752 | 2.174 | 0.030 | -760.367 | -76.726 | 289.257 | -104.683 | -2.922 | 0.020 |
| S1T1W | - | - | - | - | - | - | -859.132 | -18.015 | 738.148 | -26.712 | 3.253 | 0.010 |
| S1T2W | - | - | - | - | - | - | -1298.575 | 49.756 | 1568.713 | 152.156 | 2.634 | 0.020 |
| S1T3W | - | - | - | - | - | - | -1088.636 | 345.266 | 1268.425 | 410.037 | 3.278 | 0.000 |
| S1T4W | - | - | - | - | - | - | -792.299 | 746.387 | 1229.202 | 561.235 | 4.166 | 0.030 |
| S1T5W | - | - | - | - | - | - | -1274.415 | -494.655 | 1523.185 | -201.415 | 2.895 | 0.000 |
| S2T1W | - | - | - | - | - | - | -437.276 | -294.443 | 355.759 | -381.826 | 2.363 | 0.020 |
| S2T2W | - | - | - | - | - | - | -745.934 | -343.354 | 1026.043 | -238.003 | 3.162 | 0.030 |
| 模型检验 R2=0.877,AICc=6 226,F=3.046, P=0.000 | R2=0.919,AICc=6206,F=4.104, P=0.000 | |||||||||||
| RSS=49 996 201, MSE=354.427 | RSS=32 327 472, MSE=284.969 | |||||||||||
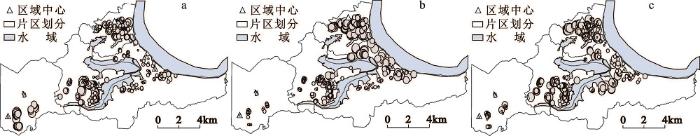
研究区的容积率与住房价格整体上呈现正相关性,原因可能是黄石市土地资源紧缺,多数住宅设计为高层建筑,在提高容积率的同时增加了建筑成本。其回归系数在不同片区差异显著(图4a):花湖新区和团城山开发区及黄石港片区偏远位置,容积率对住房价格的影响较小;而下陆片区、黄石港片区靠近中心位置、团城山开发区靠近湖边位置,容积率能显著的影响住房价格。其原因是局部位置小区,建设高层住宅提高容积率,造成房屋成本较大增加,促使住房价格有明显的升高。小区等级代表小区的档次定位,其对住房价格的影响具有显著的片区空间差异性(图4b):在花湖新区核心区,小区等级对住房价格影响较小;而在团城山片区,对住房价格影响比较大。原因在于团城山区居住的白领人士居多,比较注重住宅小区的品质和档次。距区域中心距离反映了城市区位对住房价格的影响,呈具显著的负相关性(图4c)。当然,同一小区楼栋到区域中心距离相差较小,住房价格受此影响较小,图4c中差异不明显;而不同小区楼栋受距区域中心距离的影响较大。限于篇幅,楼栋总层数、绿化率未列出。
图4 小区容积率(a)、小区等级(b)及距区域中心距离(c)回归系数的分布
Fig.4 The distribution of regression coefficients on cell plot ratio, cell level and distance from the regional centre
IGTWR模型7个时空窗口变量的回归系数和为:-26.712+152.156+410.037+561.235+(-201.415) +(-381.826)+(-238.003)=275.476,反映出每年的时空窗口的回归系数,即给定空间距离小于1 000 m范围内年度住房价格变化为275.476。时空窗口S1T1W的回归系数为负值,在空间上显著的变化(图5a),反映出住房价格的波动呈空间差异性,对偏远位置住房价格影响较大,而靠近区域中心影响较小,原因可能在于国家对房地产市场宏观调控及经济和金融等政策的影响;S1T3W、S1T4W的回归系数为较大的正值,在不同区域呈现显著的空间差异性(图5b),在下陆片区、团城山的偏远位置及黄石港片区的工矿区,其对住房价格影响较小,原因估计在于这些位置住房发展不充分,速度缓慢,表明住房开发周期对住房价格具有较强正相关性影响;S2T1W、S1T2W的回归系数为绝对值较大的负值,在空间上呈明显变化(图5c),偏离区域中心位置,对住房价格影响较大,说明空间距离500 m~1 000 m范围内,随空间距离的增加,住房价格显著降低。
GWR、GTWR、IGTWR三种模型诊断及回归系数估计,见表3。模型的R2和F统计值依次增大,校验AICc和残差平方和RSS的值依次减小;GTWR比GWR拟合精度有较大的提高(提高5.3%),同时估计误差大幅减少(减少40.1%);IGTWR与GTWR相比,也较好提高了拟合精度(提高4.8%),估计误差也部分减少(35.3%)。小区等级、绿化率、楼栋总层数、容积率在3种模型中均呈现出与住房价格的正相关性,IGTWR模型中各回归系数估计值小于其他2个模型。距区域中心距离与住房价格呈现很大的负相关性,按模型顺序相关性先增加后减弱。销售年份的回归系数,GTWR没有体现,IGTWR比GWR有较大增强。
图5 S1T1W(a)、S1T4W(b)、S2T1W(c)回归系数的分布
Fig.5 The distribution of regression coefficients on S1T1W, S1T4W and S2T1W
表3 GWR、GTWR和IGTWR的模型诊断及回归系数估计
Table 3 The statistical diagnosis and regression parameters estimation of GWR, GTWR and IGTWR models
| 模型 | R2 | AICc | F | RSS | CL | GR | FL | PR | ND | YI |
|---|---|---|---|---|---|---|---|---|---|---|
| GWR | 82.4% | 6 262 | 2.925 | 71 638 362 | 210.802 | 14.613 | 23.204 | 294.105 | -172.682 | 137.728 |
| GTWR | 87.7% | 6 226 | 3.046 | 49 996 201 | 276.854 | 11.832 | 32.096 | 175.272 | -303.758 | - |
| IGTWR | 91.9% | 6 206 | 4.104 | 32 327 472 | 145.245 | 10.315 | 21.035 | 168.225 | -104.683 | 275.475 |
分析表明,IGTWR构造局部时空窗口统计量,弥补了GTWR的不足,改进了模型中时空因素作用下其他解释变量回归系数的估计,从局部时空的角度较精确地反映出时空相关性的影响。
针对地理加权回归(GWR)模型不能有效处理样本数据空间自相关性这一问题,计算时空窗口包含的各样本点的被解释变量平均值,与样本拟合点的被解释变量值的比值,构造局部统计量,较好地改进了时空加权回归(GTWR)模型。以湖北省黄石市的住房价格为例,分别采用常规线性回归(OLS)、GWR、GTWR、改进时空加权回归(IGTWR)作拟合分析。结果表明:IGTWR模型和各变量的回归统计均通过0.05的显著性水平检验,有关解释变量的系数估计值在空间分布上能合理解释;GWR回归拟合度优于OLS,GTWR优于GWR,而IGTWR拟合精度最好。与GTWR相比,IGTWR改进了模型中时空因素作用下其他解释变量回归系数的估计,从局部时空的角度较精确地反映出时空相关性的影响。本文案例研究表明:IGTWR能够表达一定时空范围的时空自相关特征,减小了估计误差,提高了回归拟合精度。
The authors have declared that no competing interests exist.
| [1] |
Specification and estimation of hedonic housing price models [J].https://doi.org/10.1016/0166-0462(92)90039-4 URL [本文引用: 1] 摘要
Alternative traditional and spatial autoregressive hedonic urban housing price models are offered corresponding to different conceptualizations of the housing price determination process. Some methodological issues relevant to their estimation are addressed that draw upon recent developments from spatial econometrics. These include the selection of the appropriate estimation strategy; the application of diagnostic tests for the detection of spatial dependence and heterogeneity; and the use of robust methods in the presence of heteroskedasticity.
|
| [2] |
Spatial autoregression techniques for real estate Data [J].https://doi.org/10.1023/A:1008690521599 URL 摘要
This paper describes how spatial techniques can be used to improve the accuracy of market value estimates obtained using multiple regression analysis. Rather than eliminating the problem of spatial residual dependencies through the inclusion of many independent variables, spatial statistical methods typically keep fewer independent variables and augment these with a simple model of the spatial error dependence. We discuss alternative spatial autoregression model specifications, estimation methods, and prediction procedures. An empirical example is provided in the appendix.
|
| [3] |
Geographically weighted regression [M]. |
| [4] |
Incorporating spatial variation in housing attribute prices [J].https://doi.org/10.1007/s10109-006-0028-7 Magsci [本文引用: 1] 摘要
<a name="Abs1"></a>Hedonic house price models typically impose a constant price structure on housing characteristics throughout an entire market area. However, there is increasing evidence that the marginal prices of many important attributes vary over space, especially within large markets. In this paper, we compare two approaches to examine spatial heterogeneity in housing attribute prices within the Tucson, Arizona housing market: the spatial expansion method and geographically weighted regression (GWR). Our results provide strong evidence that the marginal price of key housing characteristics varies over space. GWR outperforms the spatial expansion method in terms of explanatory power and predictive accuracy.
|
| [5] |
Exploring the spatio-temporal dynamics of geographical processes with geographically weighted regression and geovisual analytics [J].https://doi.org/10.1057/palgrave.ivs.9500/87 URL [本文引用: 1] 摘要
The paper examines the potential for combining a spatial statistical methodology - Geographically Weighted Regression (GWR) - with geovisual analytical exploration to help understand complex spatio-temporal processes. This is done by applying the combined statistical - exploratory methodology to a simulated data set in which the behaviour of regression parameters was controlled across space and time. A variety of complex spatio-temporal processes was captured through space-time (i.e. as spatio-temporal) varying parameters whose values were known. The task was to see if the proposed methodology could uncover these complex processes from the data alone. The results of the experiment confirm that the combined methodology can successfully identify spatio-temporal patterns in the local GWR parameter estimates that correspond to the controlled behaviour of the original parameters.
|
| [6] |
Measurement of Provincial Total Factor Production: Application of Geographically Weighted Regression from a Spatial Temporal Perspective [J].
|
| [7] |
Spatiotemporal Autoregressive Models of Neighborhood Effects [J]. |
| [8] |
A method for spatial-temporal forecasting with an application to real estate prices [J].https://doi.org/10.1016/S0169-2070(99)00047-3 URL [本文引用: 2] 摘要
By Kelley Pace, Ronald Barry, Otis W. Gilley and C. F. Sirmans; A method for spatial-temporal forecasting with an application to real estate prices
|
| [9] |
A spatio-temporal autoregressive model for multi-unit residential market analysis [J].https://doi.org/10.1007/s11146-005-1370-0 URL 摘要
ABSTRACT By splitting the spatial effects into building and neighborhood effects, this paper develops a two order spatio-temporal autoregressive model to deal with both the spatio-temporal autocorrelations and the heteroscedasticity problem arising from the nature of multi-unit residential real estate data. The empirical results based on 54,282 condominium transactions in Singapore between 1990 and 1999 show that in the multi-unit residential market, a two order spatio-temporal autoregressive model incorporates more spatial information into the model, thus outperforming the models originally developed in the market for single-family homes. This implies that the specification of a spatio-temporal model should consider the physical market structure as it affects the spatial process. It is found that the Bayesian estimation method can produce more robust coefficients by efficiently detecting and correcting heteroscedasticity, indicating that the Bayesian estimation method is more suitable for estimating a real estate hedonic model than the conventional OLS estimation. It is also found that there is a trade off between the heteroscedastic robustness and the incorporation of spatial information into the model estimation. The model is then used to construct building-specific price indices. The results show that the price indices for different condominiums and the buildings within a condominium do behave differently, especially when compared with the aggregate market indices. Copyright Springer Science + Business Media, Inc. 2005
|
| [10] |
Geographically and temporally weighted regression for modeling spatio-temporal variation in house prices [J].https://doi.org/10.1080/13658810802672469 URL [本文引用: 2] 摘要
By incorporating temporal effects into the geographically weighted regression (GWR) model, an extended GWR model, geographically and temporally weighted regression (GTWR), has been developed to deal with both spatial and temporal nonstationarity simultaneously in real estate market data. Unlike the standard GWR model, GTWR integrates both temporal and spatial information in the weighting matrices to capture spatial and temporal heterogeneity. The GTWR design embodies a local weighting scheme wherein GWR and temporally weighted regression (TWR) become special cases of GTWR. In order to test its improved performance, GTWR was compared with global ordinary least squares, TWR, and GWR in terms of goodness-of-fit and other statistical measures using a case study of residential housing sales in the city of Calgary, Canada, from 2002 to 2004. The results showed that there were substantial benefits in modeling both spatial and temporal nonstationarity simultaneously. In the test sample, the TWR, GWR, and GTWR models, respectively, reduced absolute errors by 3.5%, 31.5%, and 46.4% relative to a global ordinary least squares model. More impressively, the GTWR model demonstrated a better goodness-of-fit (0.9282) than the TWR model (0.7794) and the GWR model (0.8897). McNamara's test supported the hypothesis that the improvements made by GTWR over the TWR and GWR models are statistically significant for the sample data.
|
| [11] |
A spatio-temporal measure of spatial dependence: An example using real estate data [J].https://doi.org/10.1111/j.1435-5957.2011.00402.x URL [本文引用: 1] |
| [12] |
A Spatial and Temporal Autoregressive Local Estimation for the Paris Housing Market [J].https://doi.org/10.1111/j.1467-9787.2011.00713.x URL Magsci [本文引用: 1] 摘要
This original study examines the potential of a spatiotemporal autoregressive Local (LSTAR) approach in modelling transaction prices for the housing market in inner Paris. We use a data set from the Paris Region notary office (“Chambre des notaires d’02le-de-France”) which consists of approximately 250,000 transactions units between the first quarter of 1990 and the end of 2005. We use the exact X -- Y coordinates and transaction date to spatially and temporally sort each transaction. We first choose to use the spatiotemporal autoregressive (STAR) approach proposed by Pace, Barry, Clapp and Rodriguez (1998). This method incorporates a spatiotemporal filtering process into the conventional hedonic function and attempts to correct for spatial and temporal correlative effects. We find significant estimates of spatial dependence effects. Moreover, using an original methodology, we find evidence of a strong presence of both spatial and temporal heterogeneity in the model. It suggests that spatial and temporal drifts in households socio-economic profiles and local housing market structure effects are certainly major determinants of the price level for the Paris Housing Market.
|
| [13] |
Dealing with spatial data pooled over time in statistical models [J].https://doi.org/10.1007/s12076-012-0082-3 URL Magsci [本文引用: 2] 摘要
Recent developments in spatial econometrics have been devoted to spatio-temporal data and how spatial panel data structure should be modeled. Little effort has been devoted to the way one must deal with spatial data pooled over time. This paper presents the characteristics of spatial data pooled over time and proposes a simple way to take into account unidirectional temporal effect as well as multidirectional spatial effect in the estimation process. An empirical example, using data on 25,357 single family homes sold in Lucas County, OH (USA), between 1993 and 1998 (available in the MatLab library), is used to illustrate the potential of the approach proposed.
|
| [14] |
A spatio-temporal model of housing prices based on individual sales transactions overtime [J].https://doi.org/10.1007/s10109-009-0085-9 URL [本文引用: 1] 摘要
A spatio-temporal model of housing price trends is developed that focuses on individual housing sales over time. The model allows for both the spatio-temporal lag effects of previous sales in the vicinity of each housing sale, and for general autocorrelation effects over time. A key feature of this model is the recognition of the unequal spacing between individual housing sales over time. Hence the residuals are modeled as a first-order autoregressive process with unequally spaced events. The maximum-likelihood estimation of this model is developed in detail, and tested in terms of simulations based on selected data. In addition, the model is applied to a small data set in the Philadelphia area.
|
| [15] |
A geographically weighted regression kriging approach for mapping soil organic carbon stock [J].https://doi.org/10.1016/j.geoderma.2012.05.022 URL [本文引用: 2] 摘要
Local variations in the model parameters can play an important explanatory role in the spatial modeling of soil organic carbon (SOC) stock. Linear regression models assume parameters to be spatially invariant and are unable to account for the spatially varying relationships in the variables. A recently developed approach, geographically weighted regression kriging (GWRK), was used in this study to examine the relationships between environmental variables and SOC stock for the state of Pennsylvania, USA. The specific objectives were to (i) estimate the SOC stock (kg02C02m 61022 ) to 1.0-m depth, and (ii) compare the GWRK results with those obtained from regression kriging (RK). Data for 878 georeferenced soil profiles, extracted from National Soil Survey Center database, were divided into calibration ( n 02=02702) and validation ( n 02=02176) datasets. Environmental variables including temperature, precipitation, elevation, slope, geology, land use, and normalized difference vegetation index were explored and included as independent variables to establish the model for estimating the SOC stock. Results using Pennsylvania as a case study conclude that GWRK was the least biased and more accurate compared to RK for estimating the SOC stock based on the lowest root mean square error (2.61 vs. 4.6102kg02m 61022 ), and high R 2 (0.36 vs. 0.23) values. Higher stock was consistent with higher precipitation and cooler temperature of the region. Total SOC stock ranged from 1.12 to 1.1802Pg for the soils of Pennsylvania. Forests store the highest SOC stock (64% of the total), followed by croplands (22%), wetlands (2.3%), and shrubs (2%). Results show that GWRK enhances the precision for estimating the SOC stock compared to the RK since the former takes into account the spatial non-stationarity coupled with spatial autocorrelation of the residuals.
|
| [16] |
Interaction effects:Centering,variance inflation factor,and interpretation issues [J]. |

/
| 〈 |
|
〉 |
