张正偲 , 董治宝
, 董治宝
中国科学院寒区旱区环境与工程研究所 中国科学院沙漠与沙漠化重点实验室, 甘肃 兰州 730000
ZHANG Zheng-cai, DONG Zhi-bao
中图分类号: P931.3
文献标识码: A
文章编号: 1000-0690(2015)05-0652-06
收稿日期: 2014-01-7
修回日期: 2014-03-1
网络出版日期: 2015-05-20
版权声明: 2015 《地理科学》编辑部 本文是开放获取期刊文献,在以下情况下可以自由使用:学术研究、学术交流、科研教学等,但不允许用于商业目的.
基金资助:
作者简介:
作者简介:张正偲(1979-),男,甘肃靖远人,副研究员,博士,主要从事风沙物理和风沙地貌研究。E-mail:zhangzhsi@sina.com
展开
摘要
沙丘形态动力学特征是风沙地貌的重要研究内容之一,受观测技术等的限制,现有的关于沙丘形态动力学特征的研究成果还不能满足沙丘形成与演化过程研究的需要。利用三维超声风速仪对腾格里沙漠的横向沙丘表面气流特征进行野外观测,结果表明,沙丘脊线和迎风坡中部的气流均为未偏向流,而沙丘背风坡不同高度的气流包括反向流,偏向流和未偏向流。湍流强度、雷诺应力和气流丰富度随气流方向变化而变化,其在沙丘脊线和中部的变化趋势比较简单且有大致相似的规律,而其在沙丘背风坡不同高度比较复杂。
关键词:
Abstract
Dune morphology dynamic is one of the main issues in aeolian geomorphology research. Because of the restriction of measurement technology, the research result on the aeolian geomorphology dynamic is unable to meet the need for dune formation and development at present. Sonic anemometer could measure the high frequency three direction wind velocity simultaneously, and could provide detailed flow information over dune surface. The results indicated that the flow structure at dune ridges and middle part is deflected; however, the flow structure at dune toe is reversal, deflected and undeflected. The flow direction at the ridge is asymmetric for the formation of reversal and deflected flow at the toe. Turbulence intensity, Reynolds stress and flow exuberance changed with flow direction, and has the similar rule at the dune ridge and middle part over dune surface, but it’s complicated at dune toe.
Keywords:
沙丘的形成与演化过程是区域内部环境与外部环境相互作用的结果[1]。风况是沙丘形成的动力条件,沙丘的形成与演化过程不仅受大气环流,同时受局地气流的影响。宏观上,区域风况受大气环流的控制,风况不同,所形成的沙丘类型不同。微观上,地形、地表障碍物等改变局地气流的发展,如背风测分离流、地形旋转流、反向流和偏向流等。沙丘形态动力学特征是风沙地貌研究的重要内容之一。风沙地貌经过100多年的发展,在沙丘的形态,动力学过程,形成与演化方面取得了丰硕的成果[2~25]。但目前还存在以下几个方面的不足。
1) 以单个、二维沙丘模型研究为主。自然界的沙丘多以连续分布的三维形态存在,所以利用现有的研究结果来模拟沙丘动态过程和移动,仍然是一 个难以解决的挑战。
2) 以平均气流研究为主。以往受观测手段的限制,对沙丘表面的气流特征的研究主要以平均状态为主。然而,沙丘表面风沙流的运动和沙丘移动过程,是由包括背风坡气流在内的所有复杂的、三维起沙风决定的。
3) 以室内、数值模拟研究相对较多。室内实验虽然能够快速研究单个沙丘的气流场特征,但由于实验的相似性以及难以模拟风向变化,从而限制了其在风沙地貌形成与演化过程的应用。随着计算机技术的发展,数值模拟在风沙地貌中的应用逐渐增多,虽可以较快地模拟沙丘的演化过程,但由于风沙地貌演化的时空复杂性,很难真实反映沙丘的演化过程,同时,由于野外观测资料缺乏,数值模拟结果难以进行对比。
4) 对风向研究不足。Bauer 等研究表明,风向对风沙地貌形成与演化过程的影响与风速具有相同重要的作用[16],近年来,风沙地貌学者注意到斜向气流对沙丘表面风沙流运动及气流属性起着重要作用[13~16]。风向不仅影响沙丘沙丘表面气流结构属性,而且影响气流的湍流特征,Chapman等人研究发现,风向影响雷诺应力、风速和雷诺应力分布特征[21]。
尽管人们认为气流湍流对解释风沙流输送至关重要,不同学者曾尝试用湍流强度、雷诺应力、水平方向雷诺应力、垂直方向雷诺应力、湍流结构、湍流动能、气流丰富度、变异系数等参数来解释气流湍流特征与风沙流和沙丘移动的关系[23]。但由于气流加速/减速,气流流线曲率效应和雷诺应力的关系非常复杂,以至于目前还没有找到一个合适的解释风沙流运动和沙丘移动的湍流参数。本研究利用三维超声风速仪,选择目前学者比较认可的影响近地层风沙流运动和沙丘移动的参数,如湍流强度、雷诺应力和气流丰富度,来探讨沙丘表面不同位置气流方向的变异规律,以及由于地形导致的湍流参数的变异特征,为风沙地貌形成与演化过程提供理论依据。
研究区位于腾格里沙漠东南缘,中卫市西北角(105°01′E,37°33′N)的中国科学院风沙科学观测场。观测场地区沙丘类型有:格状沙丘、反向沙丘及横向沙丘。沙丘表面粒度在0.22~0.26 mm之间;根据风沙观测场的观测数据,该地区年平均风速2.48~2.79 m/s,多年平均输沙势75VU;风向主要以西北风为主,其次为东北风;年平均空气湿度在36.51%~45.40%之间;年平均温度在11.21~12.65℃;年降雨量在71.44~116.60 mm之间。
本次试验选择平坦沙地上发育的横向沙丘为研究对象,沙丘高度2.2 m,迎风坡12°,背风坡坡度30°,沙丘间距20 m。风速观测采用Gill 公司生产的WindMaster(Pro)超声风速仪,观测点分别为背风坡坡脚(0.31、0.59和1.4 m)、迎风坡中部(0.6和1.4 m)和迎风坡脊线附近(0.32和0.58 m),并在观测沙丘的上一个沙丘安装一个对照超声风速仪,高度为2.2 m。超声风速仪采集频率为10 Hz,同时记录u、v、w方向的风速。超声风速仪采集的数据保存在CR1000上。观测期间的风向为西北风。
采集的数据首先进行数据野点处理和坐标转换[22]。水平方向的湍流强度根据以下公式计算[22]:
式中,
雷诺应力 (RS) 广泛应用于风沙研究中,但近年来的研究表明,水平雷诺应力可能对反应风沙运动更有意义[21],所以本文仅讨论水平雷诺应力,其计算公式如下:
式中,Ru为水平雷诺应力(m2/s),
象限分析能够比较直观反映近地层湍流猝发过程的频率分布情况[23],有助于解释风沙流产生机理和沙丘移动特征。第一象限为向外的相互作用(outward interactions,u′>0,w′ (垂直风速)>0),第二象限为溅射作用(ejections,u′<0,w′>0),第三象限为向内相互作用(inward interactions,u′<0,w′<0),第四象限为蠕移作用(sweeps,u′>0,w′<0)。但是,目前在风沙研究中,还没有一个比较理想的关于象限分析过程临界值(Hsd)的确定办法,所以本文依据前人的研究经验,临界值为雷诺应力的一个标准差[19,21,25~27]。气流丰富度(Flow exuberance)表示象限频率分布的形态,根据Chamman 等的定义计算:
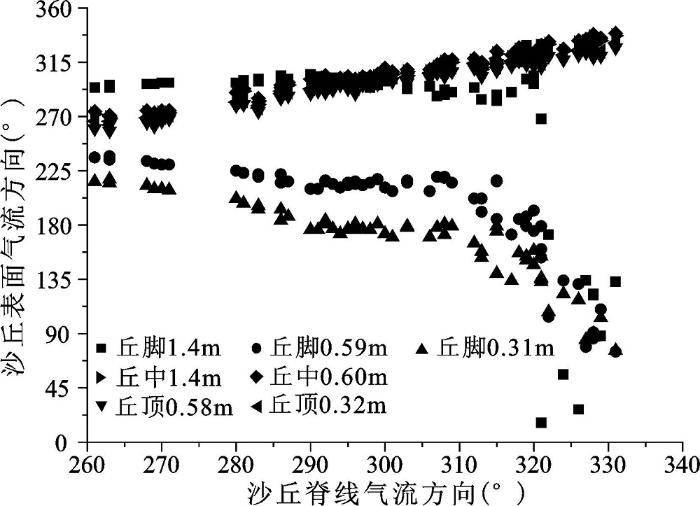
地形改变近地层气流的发育,特别是背风坡气流的发育。沙丘脊线的气流方向与主风向夹角不同,则背风侧气流形式不同,但目前关于此方面的研究较少且存在争议[13,14,16]。背风坡气流的发育特征对风沙地貌的形成与演化过程具有重要意义:如背风坡反向气流范围是控制沙丘间距的重要因子;尽管目前对偏向气流的意义不太明确,但从我们野外观察发现,偏向气流对复杂沙丘,如格状沙丘副梁的形成可能起着重要作用。脊线气流方向不同,沙丘表面不同位置的气流方向亦不同(图1)。当风向为西北风(315°)时,沙丘脊线和中部的气流总体为未偏向,而在沙丘背风坡坡脚,气流比较复杂,包括反向气流和偏向气流。当沙丘脊线气流方向为270°~290°时,背风坡坡脚不同高度气流主要为偏向气流,并且有向反向气流变化的趋势。当沙丘脊线气流方向为290°~315°时,背风坡不同高度气流包括反向流和偏向流:0.31 m高度气流为反向流,0.59和1.40 m高度为偏向气流。当沙丘脊线气流方向为315°~330°时,0.31和0.59 m高度主要为反向气流,但1.40 m高度既有反向流流,又有偏向流。当沙丘脊线气流方向大于330°时,背风坡不同高度主要为偏向流。
沙丘高度、间距、迎风坡角度、背风坡坡度、风速风向和气流入射角度均影响沙丘表面气流的发展。在横向气流条件下,背风侧气流包括6个分区:外流区、溢流区、上层尾流区、下层尾流区、分离泡和内边界层[5,8,15~18]。分离泡是背风侧气流特征的有效描述方法,其形态特征(高度、面积和形状比)反映了气流的变化特征,气流重附距离一般在4.8~10.8 H之间(H为沙丘高度),并随迎风坡坡度增加逐渐增加[5,8]。气流垂直于沙丘脊线时,单个沙丘背风侧气流的重附距离要比连续沙丘的大[18]。本实验表明,在连续分布的横向沙丘,沙丘迎风坡中部0.50 m高度气流方向为未偏向,因此,沙丘中部气流已超出分离泡的范围,属于溢流区[5]或混合区[17]。由沙丘中部气流的方向可以推知,沙丘背风侧气流的重附距离在沙丘中部与沙丘背风坡坡脚之间,重附距离小于4 H,而这个距离与前人的研究结果相比要小[5,8,17,18],这主要是由于前人多是通过风洞实验和数值模拟的方法,而风洞实验和数值模拟的测试条件属于理想状态,这必然造成分析结果偏大。本实验由于测点较少,仅能够得到重附距离的粗略范围,下一步将加密野外观测的测点,进一步完善野外观测。
图1 沙丘脊线和表面气流方向
Fig.1 The relationship of air flow direction between sand ridge and dune surface
分离泡的高度可能高于沙丘,也有可能低于沙丘,这主要取决于迎风坡坡度[8]。在分离泡高度以下,气流为反向流,而分离泡以上,气流为未偏向流。野外观测表明,对同一沙丘,气流分离与脊线气流方向密切相关,气流方向在290°~330°时,近地层0.31 m高度处于分离泡的下层,气流为反向流,这就意味着分离泡的高度在0.31 m以上;但随高度的增加(0.59 m),反向流仅出现在脊线气流方向为315°~330°范围,这就意味着分离泡的高度在0.59 m高度以上。
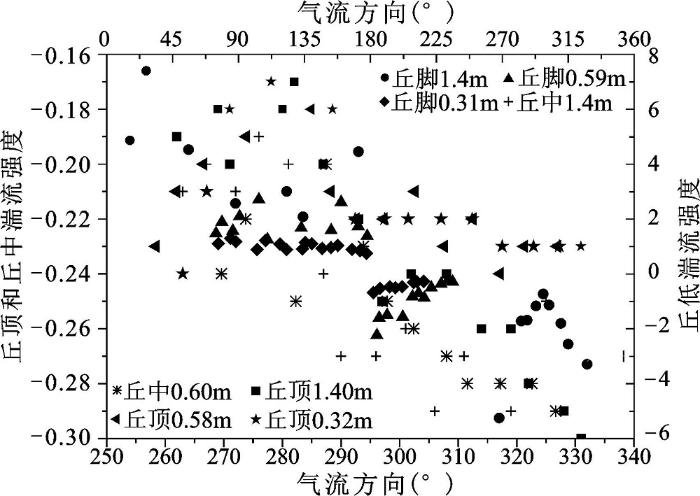
地形不仅影响沙丘背风测气流方向,而且影响气流的湍流特征,气流方向不同,近地层气流到达沙丘脊线的风程长度不同,而风程长度是影响近地层风沙流运动的重要因子。Chapman等研究发现,风向影响沙丘表面气流的雷诺应力、风速和气流丰富度[21]。图2为气流方向与湍流强度的变化趋势图。对于反向气流,湍流强度为正值,而对于偏向气流,当偏向于东北方向时,湍流强度为正值,而当偏向于西南方向时,湍流强度为负值。沙丘脊线的湍流强度随气流方向总体表现为先增加后减小。湍流强度随气流方向的变化而变化:沙丘中部的气流方向在一定范围内(如1.4 m高度<275°,0.6 m高度<285°),湍流强度先减小后增加;而在>290°时,逐渐减小;沙丘坡脚的湍流强度在0.6 m高度大于0.4 m高度。沙丘坡脚1.4 m高度,湍流强度在气流方向<180°时先减小后增加,在>180°时先增加后减小;0.59和0.31 m高度在气流方向<180°时呈波浪变化,而在>180°时逐渐增加。
图2 沙丘表面不同部位湍流强度与气流方向的关系
Fig.2 The relationship between turbulence intensity and air flow direction over dune surface
湍流强度不仅随气流方向的变化而变化,同时不同高度的湍流强度亦不同。脊线的湍流强度随气流方向变化而变化,流方向小于270°时,湍流强度由1.4、0.58、0.32 m,依次减小;270°~360°之间,由1.4、0.58、0.32 m,依次增加。沙丘坡脚,当气流方向为0°~180°之间时,1.40 m高度湍流强度最大,其次为0.59和0.31 m,而在气流方向为180°~360°之间,0.31 m高度最大,其次为0.59和1.4 m高度。坡脚1.4 m高度,当气流属于反向和偏向北时,湍流强度随气流方向体现为波浪状变化,在45°左右达到最小值,在150°左右达到最大值;当气流为偏向气流且偏向西时,湍流强度先增加后降低,在290°左右达到最大值(绝对值最小)。坡脚0.59 m,当气流属于反向和偏向北时,湍流强度随气流方向亦体现为波浪状变化,但最小值对应的气流方向为110°左右,在150°左右达到最大值;当气流为偏向气流且偏向西时,湍流强度体现为连续增加。在背风坡坡脚0.31 m,当气流属于反向和偏向北时,湍流强度随气流方向无明显变化趋势;当气流为偏向气流且偏向西时,湍流强度体现为连续增加。
尽管目前关于近地层雷诺应力与风沙流关系的研究不多,但人们还是认为雷诺应力以及湍流结构对风沙流起着重要作用[27]。近年来,风沙学者认为水平雷诺应力对风沙流运动和沙丘移动亦起着重要作用,对于新月形沙丘,水平雷诺应力在迎风坡坡脚增大,但在沙丘脊线降低[23]。图3为沙丘表面不同位置不同高度水平雷诺应力随气流方向变化图。沙丘背风坡坡脚0.59 m和0.31 m高度的水平雷诺应力总体表现为先减小后增加然后减小,但在局部气流范围内有微小的变化;而1.4 m高度总体表现为先增加后减小。沙丘脊线和中部,水平雷诺应力总体表现为先增加后降低,同样在局部气流范围内有微小的变化有减小的趋势。
图3 沙丘表面不同部位雷诺应力与气流方向的关系
Fig.3 The relationship between Reynolds stress and air flow direction over dune surface
沙丘脊线气流方向<270°时,水平雷诺应力在0.58 m高度大于1.4 m和0.32 m高度;>270°时由1.4 m,0.58 m和0.32 m依次减小。沙丘中部和沙丘坡脚水平雷诺应力随高度变化的趋势不是很明显。
目前关于雷诺应力与风向关系的研究并不多见,Chapman等研究发现,当沙丘脊线为76°/256°,气流方向在30°~47°(与主风向夹角44°~61°)范围变化时,雷诺应力与气流方向线性相关[21],背风坡坡脚下部和迎风坡中部上部位置雷诺应力随风向增加而降低,其余位置相反。本研究结果表明,当沙丘表面气流方向260°~271°(对应于Chapman等人2012的与主风向夹角44°~61°)时,沙丘脊线水平雷诺应力随气流方向增加而降低;沙丘中部水平雷诺应力随气流方向增加而增加;沙丘背风坡上部水平雷诺应力随气流方向先降低后升高,而背风坡中部和下部水平雷诺应力随气流方向降低。
气流湍流在不同象限的分布特征可以揭示沙丘表面风沙流运动的动态差异并有助于解释风沙流产生机理和沙丘移动特征。气流丰富度反应的是雷诺应力产生过程4个象限负和正作用分布的比例。当丰富度接近1时,4个象限均匀分布;丰富度大于1时,以第一和第三象限作用为主,其不利于雷诺应力的产生和沙粒起动,风沙流以沉降为主;丰富度接近0时,主要以第二和第四象限作用为主,此时,有助于雷诺应力的产生、沙粒起动和风沙流运动。气流丰富度与气流方向有一定的关系,且气流丰富度的产生过程是由地形引起的气流压缩和流线曲率效应造成的气流动态过程和湍流产生过程[21]。
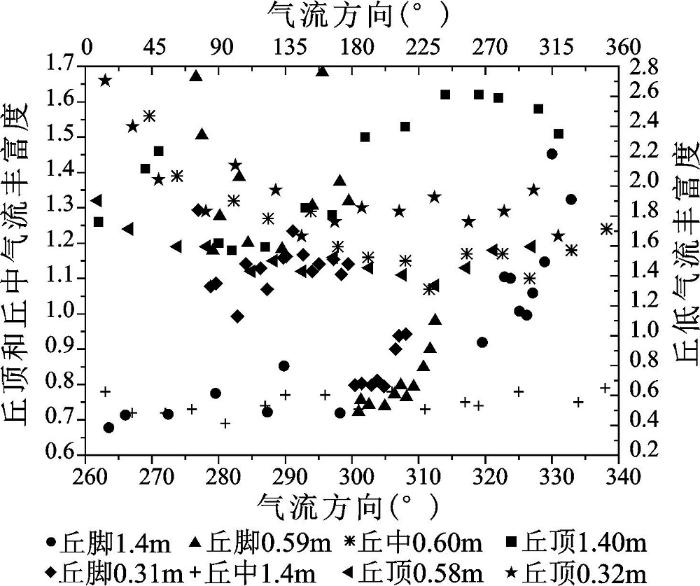
图4为沙丘表面气流丰富度随风向的变化趋势,由图可以看出,沙丘脊线0.58 m和0.32 m,沙丘中部0.60 m高度气流丰富度均大于1。沙丘脊线下层的气流丰富度大于上层的气流丰富度,这就说明随高度增加,雷诺应力降低;而沙丘中部的下层高度气流丰富度大于1,这说明在沙丘中部,气流对沙粒运动的作用完全相反。Chapman等认为迎风坡坡脚以Q2和Q4为主,而脊线以Q1和Q3为主[21],但其没有考虑风向的影响,事实上,由本研究及其他人的研究表明,沙丘脊线气流方向对背风坡坡脚气流方向、雷诺应力、风速和气流丰富度有显著的影响,从而导致气流丰富度的复杂性。沙丘表面不同位置气流丰富度的变化随背风坡气流属性变化而变化,对于偏向气流,坡脚以Q2和Q4为主;对于反向气流,气流丰富度比较复杂,坡脚以Q1和Q3为主(图4)。
图4 沙丘表面不同部位气流丰富度与气流方向的关系
Fig.4 The relationship between flow exuberance and air flow direction over dune surface
气流丰富度不仅随高度变化而变化,气流方向不同,丰富度亦不同。沙丘表面相同的高度,气流丰富度变化规律相似,如沙丘脊线0.58 m和中部0.60 m高度,气流丰富度随气流方向先降低后增加,在气流方向为310°左右达到最小值,这说明气流方向与沙丘脊线垂直时,气流对雷诺应力的产生作用最小,此时,沙粒起动和风沙流运动最明显。沙丘脊线0.32 m高度,气流丰富度随气流方向表现为波浪变化,气流丰富度最大值所对应的气流角度在260°左右,在260°~290°之间,气流丰富度明显降低,但在290°~330°之间,成波浪状。沙丘中部1.38 m高度,气流丰富度小于1且成波浪状。气流丰富度波浪状的特征,体现了气流方向对雷诺应力的贡献差异,从而导致沙丘表面不同位置风沙流运动过程的差异。
在沙丘背风坡,当气流属于反向和偏向北时,气流丰富度大于1,而气流为偏向气流且偏向西时气流丰富度小于1,此时,反向气流抑制了雷诺应力的产生,造成沙丘表面沙粒的运动能力减小,而偏向西的偏向气流极有利于雷诺应力的产生,有利于沙丘表面沙粒的运动。背风坡坡脚1.4 m高度,当气流属于反向和偏向北时,气流丰富度随气流方向体现为波浪状变化,在45°左右达到最小值;当气流为偏向气流且偏向西时,气流丰富度与气流方向亦为波浪状变化,在225°左右达到最小值。在背风坡坡脚0.59 m,当气流属于反向和偏向北时,气流丰富度随气流方向亦表现为波浪状,最大气流丰富度对应的气流方向为70°和160°左右;当气流为偏向气流且偏向西时,气流丰富度体现为连续增加。在背风坡坡脚0.31 m,当气流属于反向和偏向北时,气流丰富度随气流方向表现为波浪状,最大气流丰富度对应的气流方向为70°左右;当气流为偏向气流且偏向西时,湍流强度体现为连续增加。
1) 沙丘形态控制沙丘表面气流特征,沙丘迎风坡中部和脊线的气流为偏向流,而背风坡气流比较复杂,包括未偏向流、偏向流和反向流,同时,背风坡气流分离泡长度、高度亦受气流方向的影响。背风坡气流分离与脊线气流方向密切相关,气流方向在290°~330°(与主风向夹角-25°~15°)时,近地层0.31 m高度处于分离泡的下层,气流为反向流;在0.59 m高度,气流方向315°~330°范围时,近地层0.59 m高度处于分离泡下层,气流为反向流。
2) 沙丘表面气流湍流属性,如湍流强度、水平雷诺应力和气流丰富度与气流方向密切相关。沙丘表面不同位置湍流属性与气流方向的关系不同,沙丘中部和顶部相对简单,但由于背风坡气流包括了反向流、偏向流和未偏向流,所以气流的湍流强度、雷诺应力和气流丰富度要比沙丘中部和顶部复杂。
3) 沙丘表面气流湍流属性与气流方向之间的关系反映了沙丘形态-动力学特征演化过程中,近地层气流-风沙流-沙丘移动之间的复杂性及气流方向在沙丘形成与演化过程中的作用。沙丘脊线的湍流强度、水平雷诺应力和气流丰富度总体大于沙丘中部,这导致沙丘脊线的风沙活动强度比中部强烈。
The authors have declared that no competing interests exist.
| [1] |
Aeolian dune-field pattern boundary conditions [J].https://doi.org/10.1016/j.geomorph.2009.06.015 URL [本文引用: 1] 摘要
Aeolian dune-field patterns reflect the complex external environment within which the pattern evolves. These external environmental controls are the boundary conditions on aeolian dune-field pattern formation. The influences of boundary conditions such as wind regime and sediment supply are well-known, however, boundary conditions represent a relatively unexplored area of dune-field pattern formation. Source-area geometry and areal limits are two newly recognized boundary conditions. Measurements of crest spacing and crest length from satellite images of dune-field patterns with point and line source-area geometries show an increase in spacing and crest length over distance, whereas spacing and crest length in plane-sourced patterns emerge equally across the dune field. The impact of the size and shape of a dune field on crest spacing is tested using a previously established analytical model. Model results indicate that the area of a dune field limits the maximum spacing that can occur within a given area, and that dune fields that are five times longer in the direction of dune migration than in the crest-parallel direction can achieve the greatest spacing within a given area. Empirical measurements of spacing, defect density and dune-field area from ten different dune fields, ranging over four-orders of magnitude in size, show that spacing increases and defect density decreases as dune-field area increases. Because the formation of all dune fields involves a wind regime and sediment supply, there must be interplay of boundary conditions within the same dune field. At different stages of pattern development one boundary condition may dominate over others, and with changing climatic, eustatic or tectonic parameters, boundary conditions may change to modify an existing pattern. Recognizing boundary condition controls on aeolian dune-field pattern formation provides a framework for recognizing the signature of the external environment in which a pattern developed and can be used for reconstructing past dune constructional events and climatic change.
|
| [2] |
新月形沙丘表面100 cm高度内风沙流输沙量垂直分布函数分段拟合 [J].
为研究新月形沙丘表面不同层位风沙流输沙量的垂直分布函数,实测了塔克拉玛干沙漠腹地典型新月形沙丘表面100cm高度内(以1cm分隔)的输沙量。分段拟合分析表明:新月形沙丘迎风坡脚输沙量垂直分布规律不完全服从指数函数,出现与戈壁风沙流结构特征相似的“象鼻效应”,在0~3cm区间内输沙量逐渐增大,3cm以上输沙量随高度呈指数函数衰减;沙丘顶部0~10cm区间输沙量随高度呈指数函数衰减,10cm以上呈二次函数衰减;沙丘左翼端输沙量随高度呈幂函数分布,沙丘右翼端0~20cm内以指数函数衰减,20cm以上呈三次函数衰减;沙丘背风坡脚风沙流输沙量在0~60cm和60cm以上分别呈不同形式的三次函数分布。
|
| [3] |
简单横向沙丘表面物质组成、气流分布及其在动力学过程中的意义 [J].https://doi.org/10.3969/j.issn.1003-7578.2004.04.006 URL 摘要
对简单横向沙丘的形态特征、气流、表面以及被输移的沙物质组成的观测和分析表明,沙丘形态特征和表面物质组成的分异是导致沙物质在迎风坡坡脚不能沉积并向下风向输送的主要原因。对沙丘背风坡气流观测表明,在沙丘背风坡贴近地面的一定高度气流仍能保持一定的强度,其输沙方向与沙丘走向近似于垂直,并有相当强的输沙能力,但其作用被限制在背风坡范围内,这对保持沙丘形态有重要的作用。在野外风沙观测中气流的湍流和波动被忽略,平均风速并不能完全反映野外气流的性质。在低一中强度风沙活动过程中,被输送的沙物质的粒度组成与下垫面物质有明显的差异,被输送沙物质的平均粒径小于下垫面沙平均粒径,输沙过程是一典型的随机过程。特定区域内,一定粒径范围内的沙物质不断被堆积而形成沙丘,经过一系列的动力学过程,最终形成处于动态平衡的区域沙丘地貌分布格局。
|
| [4] |
雅鲁藏布江米林宽谷段新月形沙丘粒度分异研究 [J].URL 摘要
雅鲁藏布江中游米林宽谷段阶地面上广泛发育带状延伸,由上段风蚀槽、中段过渡区和下段堆积区组成的风沙活动带。风沙活动带各段新月形沙丘表面沉积物粒度分析表明,沙丘表面沉积物总体为细沙、中等分选、极细偏、多峰,表面粒度分布模式多属丘顶最粗型。受沙源和分选距离的影响,沙丘沙粒度特征在风沙活动带内表现出一定的空间差异性,上段风蚀槽内发育的沙丘规模小,粒径细,分选差,极细偏,多峰;中段和下段沙丘表面沉积物粒径变粗,分选变好,正偏转向近对称,多峰转为单峰。
|
| [5] |
|
| [6] |
腾格里沙漠东南缘格状沙丘的形态-动力学研究 [J].https://doi.org/10.3321/j.issn:1006-9267.1999.05.011 URL 摘要
在世界沙漠中格状沙丘比较常见,但研究程度很低,腾格里沙漠东南缘格状沙丘由NE-SW向主梁和与其近乎垂直的副梁构成。对沙丘区域气流,表面气流,沉积物粒度特征和内部沉积构造等方面的研究表明, 状沙丘的主梁形成于主风-西北风的作用,而副梁则是在主梁基础上并由主风和次风-东北风的交替作用下形成的,其形态-动力学类型应属纵向沙丘置于横向沙丘之上的一种复杂型沙丘。
|
| [7] |
沙丘背风侧气流及其沉积类型与意义 [J].https://doi.org/10.3969/j.issn.1000-0550.2001.01.016 URL 摘要
在腾格里沙漠东南缘对现代沙丘表面气流、沉积过程的野外观测结果 表明,由于区域气流、沙丘形态及其相互作用等的不同使沙丘背风坡气流发生变化,在此发现三种背风坡次生气流:分离流、附体未偏向流和附体偏向流。前者以弱 的反向流为特征多发生在横向气流条件下坡度较陡的背风坡;后二者具有相对高的风速,其中附体流多发生在坡度缓和的背风坡,其方向在横向气流条件下保持原来 的方向,而在斜向气流作用下发生偏转且其强度为原始风入射角的余弦函数。根据背风坡气流方向及强度,作者阐述了不同区域气流环境中沙丘背风坡沉积过程、层 理类型及特征,探讨了交错层产状与区域气流方向之间的关系。
|
| [8] |
横向沙丘背风侧气流重附风洞模拟 [J].
二次流在沙丘形成和形态维持过程中扮演着重要角色.沙丘迎风坡气 流加速和背风侧气流分离是最常见的二次流形式.沙丘背风侧的二次流,尤其是气流分离形成的分离涡和气流重附对沙丘背风坡的塑造、沙丘间距和排列模式都具有 重要的控制作用.因此,设计了一系列具有不同迎风坡坡度的横向沙丘模型,采用粒子图像测速技术,通过风洞实验模拟了沙丘背风侧的气流分离和重新附着.实验 结果表明,当来流风速垂直于沙丘脊线时,沙丘背风侧的气流重附距离介于4.8 H~10.8 H之间(H为沙丘高度),最大重附距离出现在迎风坡坡度为15°的沙丘背风侧;沙丘迎风坡坡度是控制背风侧气流重附距离的主要因素,而自由风速对气流重附 距离的控制作用较小.根据实验结果,还讨论了气流分离与重附对沙粒运移和沙丘形态维持的沉积学意义.
|
| [9] |
库姆塔格沙漠风沙活动特征 [J].URL 摘要
库姆塔格沙漠面积虽然较小,但其风沙地貌类型复杂,包含格状沙丘、复合型沙垄、金字塔沙丘以及“羽毛状”沙丘,其中“羽毛状沙丘”是该沙漠独特的沙丘类型,“羽毛状”沙漠也成了库姆塔格沙漠的代名词。以往对该沙漠风沙地貌的研究局限于遥感影像的判读或者理论分析,很少有实测数据的支持。近期对该沙漠的综合考察对该沙漠的风沙地貌有了新的认识。以建立在库姆塔格沙漠4个方位的5个气象站(测风站)的实测资料为基础,对库姆塔格沙漠近地层风况、风沙活动特征进行了研究。结果表明:(1)库姆塔格沙漠近地层风向复杂,总体可分为两种基本类型风向的区域:沙漠西北和北面为两组风向,而东南和南边为三组风向。(2)库姆塔格沙漠风沙活动强烈,沙漠绝大部分区域属于中风能环境外,南部部分地区都属于低风能环境。(3)该区域的风沙地貌类型和近地层风向特征与合成输沙势方向吻合,年合成输沙势方向在沙漠的西北和北面为西南方向,在多坝沟地区,输沙方向为西北方向,在沙漠南面为东北方向。风向变率在0.3—0.8之间,属于中比率,风况特征属于钝双峰风况或锐双峰风况。年输沙量在0.53-1.14t/m2之间。
|
| [10] |
腾格里沙漠西部和西南部风能环境与风沙地貌 [J].
腾格里沙漠西部和西南部的沙漠边缘地区位于石羊河流域的下游地 区,该地区生态环境脆弱,成为近年来备受关注的区域之一。利用自动气象站2009年年度风况资料和Google Earth影像,对该地区的风能环境与风沙地貌进行讨论,为评价区域风沙活动强度,风沙地貌形态特征提供依据。研究表明,腾格里沙漠西部和西南部的风况、 风能环境呈自北向南逐渐变化的趋势,年平均风速西部最大,中部次之,南部最小;起沙风风向在北部以西北风和东北风为主,中部以西北风和东南风为主,而南部 以西北风为主,东南风很少。研究区的北部为高风能环境,中部和南部为低风能环境。研究区的沙丘类型主要为格状沙丘,在沙漠边缘的部分地区为新月形沙丘链, 南部为植被线形沙垄,其主要是由地形作用形成的,沙垄之间为新月形沙丘链。风能环境、沙源和植被共同影响沙丘的形态参数,研究区中部的风能比南部大,沙源 比南部多,植被比南部少,因此,格状沙丘主梁之间的间距要比南部新月形沙垄的间距大。格状沙丘的走向近似相同,均在205°~225°之间。研究区南部有 范围较大的植被线形沙垄,其间距在0.8~2.0km之间,平均间距为1.37km;走向为近似南北(164°~176°之间)。
|
| [11] |
包兰铁路沙坡头段防护体系生物土壤结皮沉积特征及其风沙环境意义 [J].
分析了沙坡头段防护体系生物土壤结皮类型、地表紧实度和沉积物机械组成的空间分布及其对风沙环境的指示意义。结果显示,沿主风向生物土壤结皮从无发育、斑块状分布,到连续分布;类型由地衣-藻结皮为主逐渐演变为苔藓结皮与其交错分布,地表紧实度逐渐增大。表层沉积物粒径随防护距离增大逐渐变细,悬移组分含量增加,结皮层粘粒和粉砂含量较高。表明防护体系内风沙活动由强烈蚀积逐渐转变为沉积主导,风沙环境趋于稳定。结皮沉积特征随沙丘地形起伏表现出波动变化,显示沙丘地形对局地风沙环境的影响。
|
| [12] |
Observations of Gobi aeolian transport and wind fetch effect [J].https://doi.org/10.1007/s11430-011-4326-7 URL 摘要
The wind fetch effect is important to wind erosion and aeolian transport and controls aeolian flux.It is useful to study the wind fetch effect in determining the aeolian transport mechanism and improving our knowledge of aeolian physics and wind erosion.In this paper,multichannel samplers measure aeolian transport at different heights above an artificial Gobi surface in the southeastern region of the Tengger Desert.The results show that aeolian transport flux can be expressed as an exponential function of height.Wind fetch obviously affects aeolian flux and aeolian transport.The coefficients and relative decay rate of aeolian flux decrease and then increase with increasing wind fetch distance.Aeolian transport depends on the height and fetch distance;aeolian transport increases and then decreases with increasing fetch distance,reaching a maximum at a fetch distance of about 34 m at the very near surface.The fetch distance of maximum aeolian transport tends to increase with height.
|
| [13] |
Davidson-Arnott R G D,Walker I J,et al.Wind direction and complex sediment transport response across a beach-dune system [J].https://doi.org/10.1002/esp.3306 URL [本文引用: 2] 摘要
Not Available
|
| [14] |
Jackson D W T,Cooper J A G.Coastal foredune topography as a control on secondary airflow regimes under offshore winds [J].https://doi.org/10.1002/esp.1925 URL [本文引用: 1] 摘要
Not Available
|
| [15] |
An empirical model of Aeolian dune lee-face airflow [J].https://doi.org/10.1111/j.1365-3091.1990.tb01843.x URL [本文引用: 1] 摘要
ABSTRACT Airflow data, gathered over dunes ranging from 60-m tall complex-crescentic dunes to 2-m tall simplecrescentic dunes, were used to develop an empirical model of dune lee-face airflow for straight-crested dunes. The nature of lee-face flow varies and was found to be controlled by the interaction of at least three factors (dune shape, the incidence angle between the primary wind direction and the dune brinkline and atmospheric thermal stability). Three types of lee-face flow (separated, attached and deflected along slope, or attached and undeflected) were found to occur. Separated flows, characterized by a zone of low-speed (0–3O% of crestal speed) back-eddy flow, typically occur leeward of steep-sided dunes in transverse flow conditions. Unstable atmospheric thermal stability also favours flow separation. Attached flows, characterized by higher flow speeds (up to 84% of crestal speed) that are a cosine function of the incidence angle, typically occur leeward of dunes that have a lower average lee slope and are subject to oblique flow conditions. Depending on the slope of the lee face, attached flow may be either deflected along slope (lee slopes greater than about 20掳), or have the same direction as the primary flow (lee slopes less than about 20掳). Neutral atmospheric thermal stability also favours flow attachment. As each of the three types of lee-face flow is defined by a range of wind speeds and directions, the nature of lee-face flow is intimately tied to the type of aeolian depositional process (i.e. wind ripple or superimposed dune migration, grainflow, or grainfall) that occurs on the lee slope and the resulting pattern of dune deposits. Therefore, the model presented in this paper can be used to enhance the interpretation of palaeowind regime and dune type from aeolian cross-strata.
|
| [16] |
Airflow reversal and alternating corkscrew vortices in foredune wake zones during perpendicular and oblique offshore winds [J].https://doi.org/10.1016/j.geomorph.2012.12.037 URL [本文引用: 3] 摘要
On all sandy coastlines fringed by dunes, understanding localised air flow allows us to examine the potential sand transfer between the beach and dunes by wind-blown (Aeolian) action. Traditional thinking into this phenomenon had previously included only onshore winds as effective drivers of this transfer. Recent research by the authors, however, has shown that offshore air-flow too can contribute significantly, through lee-side back eddies, to the overall windblown sediment budget to coastal dunes. Under rising sea levels and increased erosion scenarios, this is an important process in any post-storm recovery of sandy beaches. Until now though, full visualisation in 3D of this newly recognised mechanism in offshore flows has not been achieved. Here, we show for the first time, this return flow eddy system using 3D computational fluid dynamics modelling, and reveal the presence of complex corkscrew vortices and other phenomena. The work highlights the importance of relatively small surface undulations in the dune crest which act to induce the spatial patterns of airflow (and transport) found on the adjacent beach.
|
| [17] |
Dynamics of secondary airflow and sediment transport over and in the lee of transverse dunes [J].https://doi.org/10.1191/0309133302pp325ra URL [本文引用: 2] 摘要
CiteSeerX - Scientific documents that cite the following paper: Dynamics of secondary airflow and sediment transport over and in the lee of transverse dunes
|
| [18] |
Simulation and measurement of surface shear stress over isolated and closely spaced transverse dunes in a wind tunne [J].https://doi.org/10.1002/esp.520 URL [本文引用: 3] 摘要
Not Available
|
| [19] |
Turbulent flow structures and aeolian sediment transport over a barchan sand dune [J].https://doi.org/10.1029/2012GL050847 URL [本文引用: 1] 摘要
The turbulent structure of airflow over a barchan sand dune is determined using quadrant analysis of wind velocity data derived from sonic anemometers. Results indicate an increased frequency of ejection and sweep events in the toe region of the dune, characteristic of the turbulent bursting process. In contrast, at the crest there was a significant increase in the occurrence of outward interactions. Combined with high frequency saltation data our analyses show that turbulent structures characterised by a positive streamwise fluctuating velocity (+u鈥 sweeps at the toe and outward interactions at the crest) have a dominant influence on sand transport on the dune, together accounting for up to 83% and 95% of transporting events at the toe and crest respectively.
|
| [20] |
Formation of the highest sand dunes on Earth [J].https://doi.org/10.1016/j.geomorph.2011.08.008 URL Magsci 摘要
Characterization of dune morphology has historically been based on relationships between dune forms and wind regimes with dune height shown to be sensitive to atmospheric boundary layer depth, sand availability and sediment properties. While these parameters have been used in numerical simulations to model the occurrences of some types of dunes, they cannot alone explain the great diversity in form and size seen on Earth and on other solar system bodies. Here we present results from our studies of dune formation in the Badain Jaran Desert in western China, where Earth's tallest dunes occur. We measured the variability of the dune morphology in this desert on the basis of LANDSAT ETM+ data, and we detected the bedrock landforms beneath the aeolian sands by applying gravity methods. Wind records from stations at the periphery of the desert and SRTM topographical data were examined also to augment the interpretation. Our studies demonstrate that in addition to average wind parameters, dune height is highly sensitive to local geology, subsurface characteristics, and topography, and interactions between changing climate conditions and aeolian and fluvial processes. These additional factors need to be considered in the interpretation and simulation of dunes on Earth. We anticipate that analysis of anomalous dune heights like those seen in the Badain Jaran may also provide critical information on subsurface characteristics and environmental conditions on Earth and on other planetary bodies.
|
| [21] |
Turbulent Reynolds stress and quadrant event activity in wind flow over a coastal foredune [J].https://doi.org/10.1016/j.geomorph.2011.11.015 URL [本文引用: 7] 摘要
High-frequency (32Hz) measurements of turbulent wind flow from 3-D ultrasonic anemometers are analyzed for oblique onshore flow over a vegetated coastal foredune in Prince Edward Island, Canada. Reynolds stress and quadrant activity distributions varied with height (0.60m and 1.66m) and location over the dune. In general, quadrant 2 ejection (u′<0, w′>0) and quadrant 4 sweep activity (u′>0, w′<0) dominated momentum transfer and RS generation over quadrant 1 outward interaction (u′>0, w′>0) and quadrant 3 inward interaction (u′<0, w′<0) activity. On the lower stoss slope, significant ejection and sweep event activity was most frequent (85 to 92%, ejections plus sweeps), whereas, at the upper crest, significant ejection and sweep activity became less frequent while significant outward and inward interactions increased in frequency (25 to 36%). An ‘exuberance effect’ (i.e., changing shape of quadrant frequency distribution skewed toward ejection and sweep activity) is observed whereby streamline compression and convexity effects inhibit vertical fluctuations in flow and, thus, reduce the frequency of ejections and sweep activity toward the crest. In separated flow in the lee of the crest, quadrant distributions were more symmetrical as a result of more mixed, multi-directional flow. These trends in turbulent event distributions and Reynolds stress have implications for sediment transport dynamics across the dune and may help to explain sand transport potential and dune maintenance. For example, areas with a high frequency of ejection and sweep activity may have higher rates of sediment entrainment and transport, whereas areas with lower ejection and sweep activity and an increase in outward and inward interactions, which contribute negatively to Reynolds stress generation, may experience a greater potential for deposition. Further research on associations between quadrant event activity and coincident sand transport is required to confirm this hypothesis and the resultant significance of the flow exuberance effect in aeolian dune morphodynamics.
|
| [22] |
Physical and logistical considerations of using ultrasonic anemometers in aeolian sediment transport research [J].https://doi.org/10.1016/j.geomorph.2004.09.031 URL [本文引用: 2] 摘要
Ultrasonic anemometers offer a new sampling resolution to measure turbulent airflow properties in field settings. With proper considerations of their limitations, UAs may allow researchers to close the gap between fluvial research and develop more robust models of aeolian processes and morphodynamics.
|
| [23] |
Wiggs G F S.Field measurements of mean and turbulent airflow over a barchan sand dune [J].https://doi.org/10.1016/j.geomorph.2010.12.020 URL Magsci [本文引用: 3] 摘要
Advances in our knowledge of the aeolian processes governing sand dune dynamics have been restricted by a reliance on measures of time-averaged airflow, such as shear velocity ( u). It has become clear that such measures are incapable of explaining the complete dynamics of sediment transport across dune surfaces. Past evidence from wind tunnel and modelling studies has suggested that in some regions on a dune's surface the sediment transport might be better explained through investigations of the turbulent nature of the airflow. However, to date there have been no field studies providing data on the turbulent characteristics of the airflow around dunes with which to support or refute such hypotheses. The field investigation presented here provides mean and turbulent airflow measurements across the centre-line of a barchan sand dune in Namibia. Data were collected using arrays of sonic anemometers and were compared with sand flux data measured using wedge-shaped traps. Results support previously published data derived from wind tunnels and numerical models. The decline in mean wind velocity at the upwind toe of the dune is shown to coincide with a rise in turbulence, whilst mean velocity acceleration on the upper slope corresponds with a general decline in measured turbulence. Analysis of the components of Reynold shear stress ( -u'炉w'炉) and normal stresses ( u炉 and w2 炉) supports the notion that the development of flow turbulence along the dune centre-line is likely to be associated with the interplay between streamline curvature and mean flow deceleration/acceleration. It is suggested that, due to the nature of its calculation, turbulence intensity is a measure of less practical use than direct assessments of the individual components of Reynolds stress, particularly the instantaneous horizontal streamwise component ( u2 炉) and shear stress ( -uw炉). Whilst, increases in Reynolds shear stress and the horizontal streamwise component of stress in the toe region of the dune may effectively explain the maintenance of sand flux in a region of declining mean velocity, they have much less explanatory power for sand flux on the upper windward slope and in the crestal region of the dune. Here, it is suggested that mean flow acceleration is likely to provide the most significant driving force on sand flux, possibly augmented by a rise in the horizontal streamwise component of Reynolds stress ( u2 炉) in the crest/brink region. Therefore, although wind turbulence is considered to be of fundamental importance in explaining the sediment transport dynamics across the dune's surface it is recognised that the interaction between mean flow deceleration/acceleration, streamline curvature and individual components of Reynolds stress is complex and the identification of a single element of flow that offers a panacea for accounting for sand flux and dune dynamics is difficult to find.
|
| [24] |
The role of streamline curvature in sand dune dynamics:evidence from field and wind tunnel measurements [J].https://doi.org/10.1016/0169-555X(95)00093-K URL 摘要
Using the occurrence of streamline curvature as a starting point, a new 2-D model of dune dynamics is deduced. This model relies on the establishment of an equilibrium between windward slope morphology, surface stresses induced by streamline curvature, and streamwise acceleration. Adopting the criteria that concave streamline curvature and streamwise acceleration both increase surface shear stress, whereas convex streamline curvature and deceleration have the opposite effect, the relationships between form and process are investigated in each of three morphologically distinct zones: the upwind interdune and concave toe region of the dune, the convex portion of the windward slope, and the crest-brink region. The applicability of the model is supported by measurements of the rate of sand transport and the change of the dune surface in the field.
|
| [25] |
Event detection and conditional averaging in unsteady Aeolian systems [J].https://doi.org/10.1006/jare.1998.0380 URL [本文引用: 2] 摘要
The research demonstrates that fluid ‘ejection’ events identified by the Variable-Interval Time Averaging (VITA) method are only crudely associated with those identified using the quadrant-threshold method. Moreover, VITA events show poor correspondence with sediment flux events. The reasons for this are unclear, although it is likely that the character of events in this beach boundary layer differ substantively from the character of structural events typically associated with the sublayer bursting process. Additional unresolved issues include whether the inner/outer layer model applies to the grain-laden/grain-free zones of a saltation system, and whether the structural events evident in velocity time series from wind tunnels and natural beaches are analogous. Event-detection and conditional-averaging techniques hold promise for characterizing the fundamental nature of unsteadiness in aeolian systems.
|
| [26] |
Jacobs A F G,van Boxel J H.The effect of turbulent flow structures on saltation sand transport in the atmospheric boundary layer [J].https://doi.org/10.1002/(SICI)1096-9837(199810)23:103.3.CO;2-I URL 摘要
Not Available
|
| [27] |
Wind forces and related saltation transport [J].https://doi.org/10.1016/j.geomorph.2005.04.008 URL [本文引用: 2] 摘要
The effect of several wind characteristics on sand transport was studied in three experiments in north Burkina Faso, West Africa. The first experiment is used to analyse the relation between wind speed and shear stress fluctuations across height. The second experiment is used to study the relation of these wind characteristics with saltation transport for fourteen convective storms, registered during the rainy seasons of 2002 and 2003. The effect of sampling time is studied for two of these convective storms. The third experiment relates the turbulent structures of four convective storms to saltation transport. Wind speed measurements were undertaken with two sonic anemometers and sediment transport was measured by two saltiphones. The sampling frequency was either 8 or 16 Hz. The sonic frame of reference was rotated according to a triple rotation. Horizontal fluctuations showed a (fairly) good correlation with height because the wind speed at both sensors was affected by the same vortices. The correlation coefficients ranged from 0.42 (when the distance between the sensors was 1.75 m) to 0.92 (when the distance was 0.25 m). The instantaneous Reynolds驴 stress had the weakest correlation (correlation coefficient of 0.05 at 1.75 m between the sensors and 0.56 at 0.25 m between the sensors), because the momentum at 2 m above the soil surface is transported by different eddies than those close to the ground. This also explains the fairly good correlation coefficients between the horizontal components of the wind and saltation compared to the poor correlations between instantaneous Reynolds驴 stress and saltation. An increase in sampling time did not have much impact on these correlation coefficients up to sampling periods of about 30 s. However, this sampling interval would be too coarse to describe the vertical wind component adequately. The classification of the moments of shear stress into the turbulent structures, sweeps, ejections, inward and outward interactions, showed that the mean saltation flux is higher at sweeps and outward interactions than at ejections and inward interactions. Also, saltation occurred more often during sweeps and outward interactions than during ejections and inward interactions.
|

/
| 〈 |
|
〉 |
