韦振锋 , 陈思源, 黄毅
广西财经学院,广西 南宁530003
WEI Zhen-feng, CHEN Si-yuan, HUANG Yi
中图分类号: P467
文献标识码: A
文章编号: 1000-0690(2015)08-1033-09
通讯作者:
收稿日期: 2014-02-15
修回日期: 2014-06-20
网络出版日期: 2015-08-20
版权声明: 2015 《地理科学》编辑部 本文是开放获取期刊文献,在以下情况下可以自由使用:学术研究、学术交流、科研教学等,但不允许用于商业目的.
基金资助:
作者简介:
作者简介:韦振锋(1983-),男,博士研究生,讲师,主要研究GIS与国土资源评价。E-mail:weizhenfeng112@163.com
展开
摘要
基于1981~2010年陕西地区16个气象站观测日值数据,通过联合国粮农组织 (FAO) 推荐的 Penman-Monteith 公式计算参考作物蒸散量,并以Mann-Kendall突变检验、Sen趋势度以及小波分析潜在蒸散量的时空变化特征,同时利用多元回归分析气候因子对其影响强度。结果表明:① 1981~2010年潜在蒸散量呈上升趋势,增速约为3.1 mm/a,没有通过0.05显著水平检验,呈“弱减-强增-减”变化波动。② 研究区潜在蒸散量存在2 a、5 a、8 a、22 a、32 a左右的震荡周期,震荡能量最大是32 a,其次是22 a。在1992年左右出现一次明显的突变,刚好是震荡能量最大32 a周期上发生波动。③ 纬度跨度大和地形复杂使得陕西地区潜在蒸散量空间差异明显。多年平均潜在蒸散量在166.9~1 367.5 mm之间,其中秦巴山一带潜在蒸散量值偏高,其次是陕北地区,关中平原潜在蒸散量值最低。变化趋势呈南北递减,陕南地区潜在蒸散量呈明显的增加趋势,关中地区呈增加趋势,陕北地区呈减少趋势。④ HURST指数分布沿东西向递减,其中在0.4~0.5之间占整个研究区的77.11%,说明大部分地区未来潜在蒸散量变化将与过去变化呈弱的反相持续性变化。⑤ 潜在蒸散量有明显的季节差异,夏季和春季变化最明显,其次是秋季和冬季,其中夏季贡献占主导,其次是春季,贡献最少的是秋季和冬季。⑥ 平均气温、相对湿度和风速对潜在蒸散量的影响较大,其中平均气温的作用最大且呈正影响,其次是相对湿度的影响,但对潜在蒸散量呈负作用。而日照时数和平均气压对潜在蒸散呈弱的正作用。
关键词:
Abstract
The temporal and spatial variations of characteristics of potential evaporation in Shaanxi Province is analyzed by the methods of Mann-Kendall, the trend of Sen, and the wavelet analysis, at the same time, the strength of the impact on climate factors is analyzed by the methods of multiple regression analysis, through the Penman Monteith - the formula to calculate the reference crop evapotranspiration recommended by the United Nations food and agriculture organization(FAO), on the basis of 16 weather stations observation log data in 1981-2010. The results show that, potential evaporation presents a increasing trend in 1981-2010, with the growth rate reaching about 3.1 mm/a, and it does not pass significant level inspection of 0.05. Presenting a volatility trend of"Weak reduction-strong increase-decreases", which appears a turning point in the early 1990s and in the late 1990s.There exists an oscillation cycle showing about 2 a, 5 a, 8 a,22 a,32 a in the study area, the biggest shock energy is 32 a, and the second is 22 a. In the research period, it appears an obvious mutation in 1992, with the match of the biggest shock energy in 32 a of the cycle fluctuation. The interspace of the potential evaporation in Shaanxi province shows an obvious difference owing to the span latitude and complex topography. The average amount of the potential evaporation is between 166.9-1 367.5 mm for many years, among them, the value of the potential evapotranspiration in Qin Bashan area is the highest,the second is in shanbei region, and the lowest area is in the guanzhong plain. The tendency of the variation shows a descending trend from north to south, the areas where the obvious increase trend of the potential evaporation is in southern shaanxi region, so the guanzhong area and the northern shaanxi region showed a trend of decrease. The HURST index distribution presents a decreasing trend from east to west,which accounted for 77.11% of the entire study area with the index between 0.4-0.5. It shows that there is a weak inverse continuous changing of the potential evapotranspiration in the future and in the past. There is an obvious seasonal difference in the potential evaporation,among them, the change in summer and spring is most obvious,followed by autumn and winter. The dominated rate of contribution is in summer, followed by the spring,and autumn and winter is the least. The average temperature, relative humidity and wind speed have a larger influence on the potential evaporation, the average temperature play the biggest role and the effect is positive, followed by the relative humidity, but the effects on the potential evaporation is negative. Average sunshine time and air pressure play a weak positive role on the potential evaporation.
Keywords:
蒸散是地表热量-水量平衡的重要成分,同时也是影响气候条件的重要因子[1]。在全球气候演变和水循环中具有举足轻重的作用。研究表明,每年蒸散进入大气的水分约占年降水量的2/3,蒸散是当前研究陆面与大气水文循环过程的重要内容之一[2]。潜在蒸散(Potential evapotranspiration, ET)既是水分循环的重要组成部分,也是能量平衡的重要部分,它表示在一定气象条件下水分供应不受限制时,某一固定下垫面可能达到的最大蒸发蒸腾量,也称为参考作物蒸散。潜在蒸散与降水共同决定区域干湿状况,在大气圈-水圈-生物圈中发挥着重要的作用,同时也是估算生态需水和农业灌溉的关键因子[3,4]。
在全球气候变化下,潜在蒸散量的变化及其主导因素的研究一直受到国内外学者们的广泛关注。Chattopadhyay[5]和Peterson[6]等人认为前苏联、美国和印度等地区潜在蒸散下降主要受北半球相对湿度增加和辐射减少的影响;Roderick[7]等人将新西兰地区和澳大利亚潜在蒸散的减少归因于南半球云量和气溶胶浓度的增加。Xu[8]、Thomas[9]、Zhang[10]、Gao[11]、Xie[12]、尹云鹤[13]等人对中国潜在蒸散的研究表明,中国北方地区、长江流域、青藏高原等局部区域,太阳辐射和风速的减少都是潜在蒸散下降的主要原因。不同区域的气候特征不同,对潜在蒸散量的影响不同。Zhang等[14]研究发现青藏高原潜在蒸散量减小的主要原因是风速降低引起的,韩松俊等[15]分析得出空气动力学项的减少是塔里木河流域潜在蒸散减小的主导因素。张方敏等[16]研究指出导致中国ET呈现阶段性变化的主要因子是日照时数 (净辐射) 和饱和差的变化。
鉴于此,以20 世纪 90 年代,联合国粮农组织 (FAO) 推荐的 Penman-Monteith 公式(P-M)计算参考作物蒸散量 (ET) [17],并以Mann-Kendall突变检验,Sen趋势度以及小波方法分析潜在蒸散量的时空变化特征,同时通过多元回归分析气候因子对潜在蒸散量的影响强度,旨在为保护和治理陕西地区水资源的合理开发与利用提供科学依据,以促进农业和生态环境的可持续发展。
陕西省地处中国西北地区,北部跨黄土高原中部(105°29′E~111°15′E,31°42′N~39°35′N),总面积为2.1×10⁵km2。行政区包括关中的宝鸡、咸阳、铜川、西安、渭南,陕南的汉中、安康、商洛,陕北的榆林、延安。陕西南北狭长,从北到南有温带草原地带、森林草原地带、暖温带落叶阔叶林地带和北亚热带常绿阔叶林地带。地跨北温带和亚热带,整体属大陆季风性气候,由于南北延伸很长,达到800 km以上,所跨纬度多,从而引起境内南北间气候的明显差异。长城沿线以北为温带干旱半干旱气候、陕北其余地区和关中平原为暖温带半湿润气候、陕南盆地为北亚热带湿润气候、山地大部为暖温带湿润气候。陕西省是中国水土流失、沙化等环境问题最为严峻的地区之一,水土流失面积占全省土地总面积的66.9%,成为制约区域经济发展的重要因素。研究区内主要地貌类型有沙漠、高原、山地、平原和丘陵。20世纪90年代开始,陕西省相继启动并实施了生态环境建设综合治理工程、退耕还林工程、天然林资源保护工程、水土保持工程、重点防护林工程,以及天然草场恢复与建设工程等一批重点生态建设工程,使陕西水土流失、沙化等环境问题得到一定的遏制,尤其是是陕北地区生态环境有明显的好转。
本文所用气象数据来源中国气象数据共享网(http://cdc.cma.gov.cn/home.do)。为了使数据统一,避免数据的缺失,本文以1981~2010年为研究时段,包括平均气温、最高气温、最低气温、平均气压、风速、相对湿度、日照时数等日值数据。其中少量缺失数据用线性补插。
本文利用滑动平均,Mann-Kendall突变检验,Sen趋势度以及小波[18]方法分析潜在蒸散量的变化特征,同时采用ANUSPLIN 模型[19,20]插值分析空间特征。以下主要介绍潜在蒸散量估算和相关气候因子的贡献率计算,以及Mann-Kendall突变检验,其他方法可见相关文献[21,22]。
潜在蒸散量的估算根据FAO推荐的公式,作物参考蒸散量定义假设表明开阔、具有充足水分、生长茂盛且均一高度0.12 m的草地的蒸散量,其中表面阻抗为70 s/m,反照率为a=0.23[17]。计算公式如下:
式中,ET为参考作物蒸散发能力 (mm/d),Δ为饱和水汽压-温度曲线斜率 (kPa/℃),
滑动平均法是一种平滑和滤波的数据处理方法,通过平均方式,消除统计序列中的随机波动,用平均值来显示时间序列的变化趋势[11]。对样本量为n的序列x,其滑动平均序列的数学表达式如下:
式中,k为滑动长度,本文采用7 a趋势滑动平均来显示其变化趋势。
Mann-Kendall突变检验中,在正序列曲线超过临界值置信度线的前提下,若正序列和反序列2个统计量序列在置信度线之间仅有一个明显的交叉点,则表明该交叉点为突变点,且统计上显著;若交叉点不在置信度线之间,或者存在多个明显的交叉点,则不确定是否为突变点[13]。这时要依据滑动T检验的原则,分多次不同长度的序列进行Mann-Kendall 检验,在不同长度下,仍显示某点为突变点,那么就确定该点为真正的突变点[21]。
贡献率计算:由多元回归分析判断各个气候因子对潜在蒸散量的贡献率。气候因子和潜在蒸散量都要进行标准化处理。计算公式如下:
Y为因变量标准值,
自然界中具有长期依赖性的时间序列是普遍存在,Hurst 指数是定量描述时间序列信息长期依赖性的有效方法之一,其计算原理见参考文献[23]。
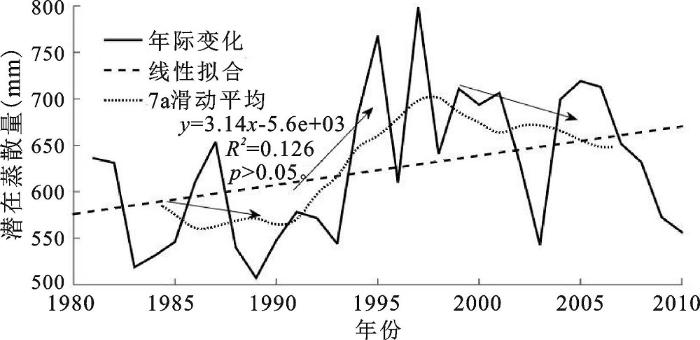
根据P-M公式计算1981~2010年陕西省潜在蒸散量年际变化(图1),存在明显的年代波动。20世纪80年代年际变化相对较平缓,呈弱的减少趋势,且在1983年出现一次低值,到了1989年出现一次最低值。到90年代,潜在蒸散量呈明显的增加趋势,到了1997年达到最大值。90年代后,潜在蒸散量逐渐减小,并且在2003年又出现一次较低值。整个时段来看,潜在蒸散量呈上升趋势,增速约为3.1 mm/a,没有通过0.05显著水平检验,变化波动呈“弱减-强增-减”,其中最大的转折点大约在80年代末至90年代初,其次是90年代末出现一次转折点。
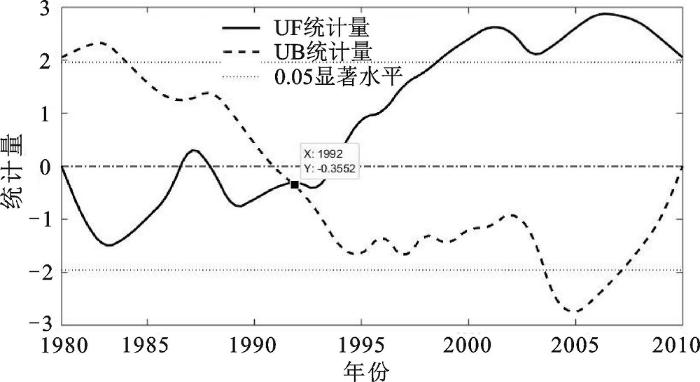
为了进一步佐证潜在蒸散量20世纪80年代末至90年代初出现一次明显的波动,即存在一次突变的转折点,本文利用7 a滑动平均(图1)和M-K突变检验(图2),在图1中可知在80年代末至90年代初和90年代末出现较大的转折,但通过M-K突变检验(图2)得知大约在1992年明显出现一次突变,而且突变点在0.05置信水平显著。这证实在研究时段内,研究区潜在蒸散量在80年代末至90年代初确实存在一次明显的突变转折。
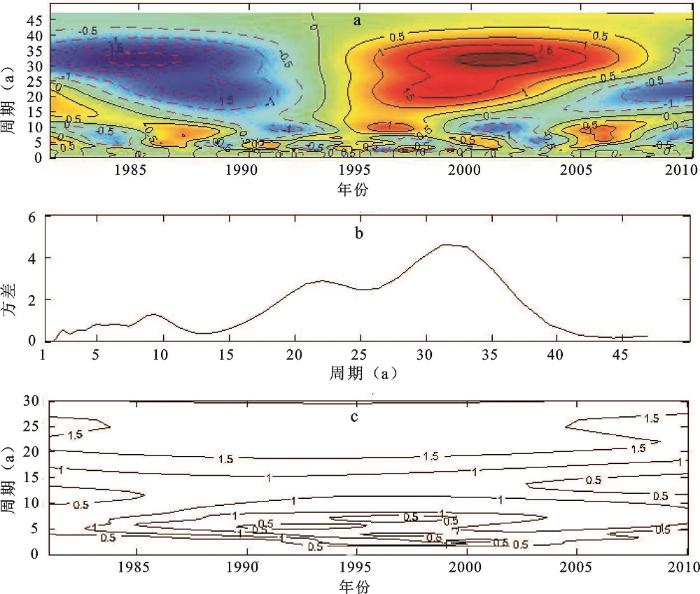
分析近30 a陕西省潜在蒸散量的周期特征,由小波变换系数的实部和方差,以及模平方时频分布图,通过三者的结合来进行周期分析(图3),从图中可以看出,潜在蒸散量存在2 a、5 a、8 a、22 a、32 a左右的震荡周期,震荡能量最大是32 a,其次是22 a。在研究时段内,2 a、5 a周期震荡一直存在,8 a震荡周期在20世纪80年代中期相对明显,到90年代至2010年也存在明显的8 a震荡周期,而在90年代初出现明显的一次32 a和22 a震荡周期。90年代出现一次较大震荡和上文的分析的在1992年左右突变的结论相一致。说明在80年代末至90年代初潜在蒸散量刚好在32 a周期震荡发生转变。
3.2.1 多年平均潜在蒸散量
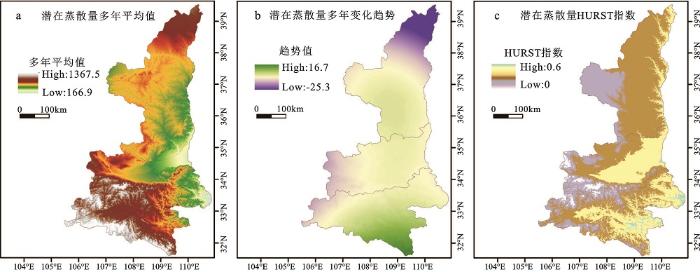
统计多年平均潜在蒸散量并通过ANUSPLIN模型实现空间栅格化[24](图4a),研究区潜在蒸散量在166.9~1 367.5 mm之间,可以看出,高值在秦巴山以汉中为中心,低值主要分布在关中平原的西安、渭南和陕北南部延安等地,到榆林北部又出现高值。整体来看,陕西纬度跨度大和地形变化明显,以致潜在蒸散量分布存在明显的差异。秦巴山-关中平原,存在明显的高山潜在蒸散量大于平原地区。在陕北从延安-榆林,潜在蒸散量逐步增加。
3.2.2 变化趋势
根据Sen趋势度和M-K检验分析1981~2010年陕西省潜在蒸散量年际变化趋势(图4b),研究区16个站点,只有横山和佛坪呈减少趋势,其中佛坪减少趋势显著(p<0.05);其他站点都呈上升趋势,其中榆林、绥德、洛川、华山、镇安、安康呈显著上升趋势(p<0.05)。通过ANUSPLIN 模型插值,如图5。从而可以看出空间变化明显的南北递减规律,其中陕南秦巴山呈明显增加趋势,关中变化趋势不明显,陕北呈明显减小趋势。
图4 潜在蒸散量空间特征
注: a,多年平均潜在蒸散量; b,潜在蒸散量趋势变化空间特征;c,HURST指数空间特征。
Fig.4 Spatial characteristics of potential evaporation
3.2.3 未来走向分析
根据HURST指数分析得出(图4c),HURST指数在0~0.6之间,空间分布主要呈东西走向逐渐减少,其中大于0.5的只有1.05%,零星分布在安康和商州等地区,绝大部分HURST指数小于0.5,说明整个研究区未来潜在蒸散量变化和近30 a变化呈反持续性。而其中0.4~0.5之间呈较弱的反持续性,占整个研究区的77.11%,主要分布在陕南东南部地区和关中平原;0.3~0.4之间只有19.74%,主要分布在陕北东部和中部地区;较强的反持续性在0~0.2之间有2.1%,主要集中分布在秦岭西北一些地区。综合说明在整个研究区,未来潜在蒸散量变化大部分地区呈较弱的反持续性,反持续强弱呈东西变强规律。
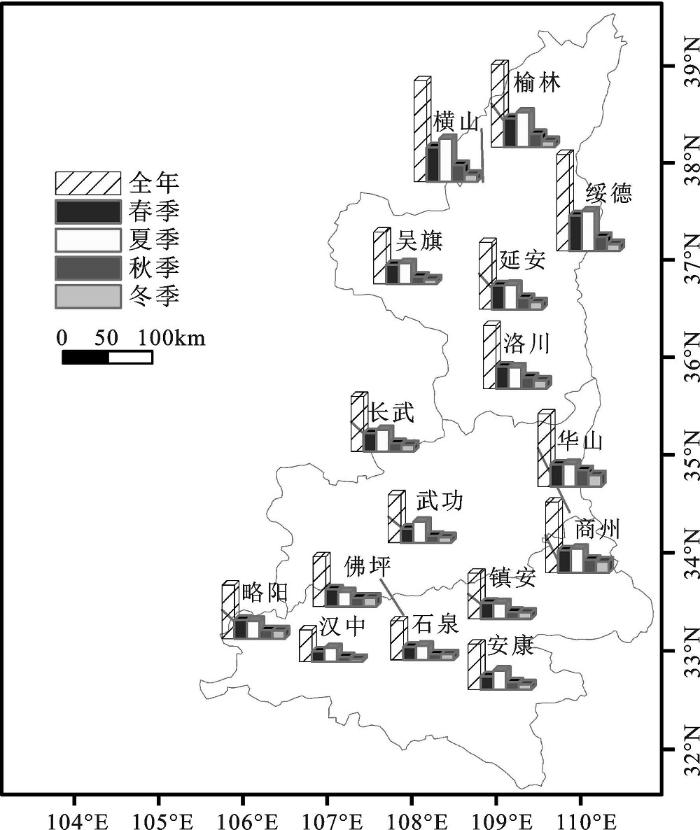
统计1981~2010年各个站点季节多年平均潜在蒸散量(图5),可以看出,各个季节空间变化大致呈西南-东北递增,与全年空间分布相似,其中在陕南汉中和安康各个季节多年平均潜在蒸散量值相对较低,陕北地区潜在蒸散量值相对较高。各个季节对比来看,总体是夏季多年平均值比其他季节要高,其次是春季值较高,最后依次是秋季和冬季。说明潜在蒸散量存在一定的季节性变化,其中夏季的贡献最大,其次是春季,秋季和冬季相对较小。
图5 季节多年平均潜在蒸散量空间特征
Fig.5 The spatial characteristics of averaged potential evaporation for many years in four seasons
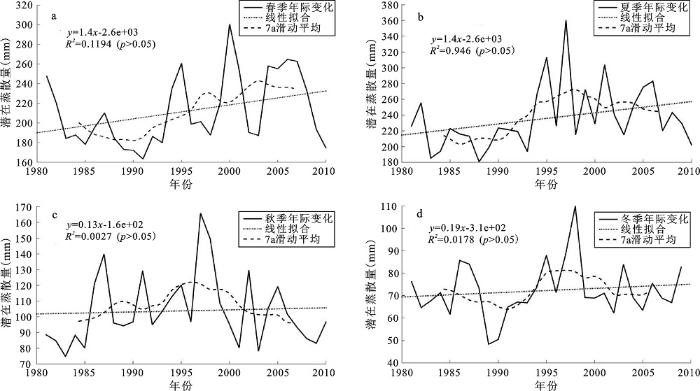
在20世纪80年代末到90年代初潜在蒸散量偏低如图6a,呈较弱的减小趋势,其中1991年出现一次最低值;而在90年代中期后开始逐步上升,其中2000年出现一次最高值。整体看在90年代之前变化波动较小,呈弱的减小趋势,90年代之后潜在蒸散量变化波动性较大,呈明显的上升趋势。整个研究时段春季年际变化与全年变化趋势一致呈上升趋势,增幅大约为0.047 mm/10a,但无显著变化。
20世纪90年代初之前,潜在蒸散量夏季年际变化波动性较小(图6b),呈较弱的减少趋势,到1988年达到一次最低值;之后,变化波动性较大,90年代潜在蒸散量逐步增加,到1997年出现一次最高值,90年代后潜在蒸散量逐渐下降。整体呈“平-升-降”走向,整个研究时段与春季年际变化相一致呈上升趋势,约为0.047 mm/10a。
20世纪90年代陕西潜在蒸散量秋季年际变化出现一次较大波动(图6c),其中1997年出现一次最高值,1997年后潜在蒸散量逐渐减少。80年代末也出现一次次波动,在1986年出现一次高值。整体来看,近30 a陕西省潜在蒸散量波动性相对春季和夏季较弱,趋势不明显,增幅约0.13 mm/a。
近30 a来研究区潜在蒸散量冬季年际变化波动性大(图6d),在20世纪90年代初出现一次明显的转折,90年代之前出现一次波动,在1986年出现一次高值,到1989年出现一次最低值;之后至90年代末,变化趋势呈明显上升趋势,其中1998年出现一次最大值;90年代末后,潜在蒸散量出现逐渐减少趋势,其中2005~2010年间出现小幅度的波动。整体变化呈较弱的上升趋势,增速约为0.19 mm/a,无显著变化。
整个研究时段,各个季节年际变化不尽相同,每个季节都存在波动性转折,都呈增加趋势,但都不显著,其中春季和夏季增速相对秋季和冬季而言明显要偏高。
由Sen趋势度和M-K趋势检验分析各个季节16个站点的变化特征(表1),春季中佛坪(-2.85 mm/a)和石泉(-0.04 mm/a)呈减少趋势,且佛坪站点变化趋势呈显著减少,这和全年变化相似呈显著减少;其他站点都呈增加趋势,其中有长武、洛川、华山、汉中和镇安5个站点通过0.05置信水平检验,而洛川、华山、镇安3个站点变化和全年变化相似都呈显著增加。夏季变化趋势有3个站点呈减少趋势,分别是横山(-0.36 mm/a)、长武(-0.71 mm/a)、佛坪(-1.63 mm/a),且都不显著,其中横山变化和全年相似都呈显著减少,而佛坪变化与全年和春季一样都呈减少,但变化不显著;榆林、吴旗、延安3个站点夏季变化呈显著增加趋势,其他呈无显著增加。秋季有横山、长武、武功、略阳、佛坪、商州5个站点呈减少趋势,其中佛坪变化与全年、春季、夏季变化相似都呈显著性减少,相对全年、春季和夏季而言,秋季减少趋势变高,而呈增加趋势的站点中只有榆林(2.44 mm/a)通过0.05置信水平检验。冬季和秋季一样都用5个站点呈减少趋势,其中长武、武功、商州和佛坪和秋季变化相似,只有佛坪变化呈显著减少;而增加趋势中有榆林(0.94 mm/a)、绥德(0.83 mm/a)和汉中(0.59 mm/a)呈显著性增加。综合来看,各个季节各个站点变化相对复杂,整体而言,春季和夏季主要变现为增加趋势,而秋季和冬季呈减少趋势明显。
从季节变化特征可以得出,潜在蒸散量变化中,夏季贡献占主导,其次是春季,贡献最少的是秋季和冬季。说明气温高低会影响到潜在蒸散量的变化,这将在气候因子分析中进一步佐证。
图6 潜在蒸散量季节年际变化
Fig.6 The interannual variability of potential evaporation in four seasons
表1 各个站点季节年际变化趋势检验
Table 1 The annual variation trend test of each site in four seasons
| 站 点 | 全年 | 春季 | 夏季 | 秋季 | 冬季 | |||||
|---|---|---|---|---|---|---|---|---|---|---|
| 趋势值 | Z值 | 趋势值 | Z值 | 趋势值 | Z值 | 趋势值 | Z值 | 趋势值 | Z值 | |
| 榆 林 | 11.45* | 2.85 | 2.81 | 1.86 | 4.36* | 2.28 | 2.44* | 2.53 | 0.94* | 2.49 |
| 吴 旗 | 0.89 | 0.61 | 0.18 | 0.32 | 1.49* | 1.96 | 0.37 | 0.79 | -0.16 | -0.84 |
| 横 山 | -0.18 | -0.04 | 0.58 | 0.36 | -0.36 | -0.14 | -0.87 | -1.03 | 0.08 | 0.39 |
| 绥 德 | 5.29* | 2.36 | 2.44 | 1.75 | 2.48 | 1.82 | 0.12 | 0.14 | 0.83* | 2.72 |
| 延 安 | 4.93 | 1.93 | 1.34 | 0.93 | 2.50* | 2.46 | 0.68 | 1.18 | -0.03 | -0.21 |
| 长 武 | 1.76 | 0.82 | 2.81* | 2.68 | -0.71 | -0.61 | -0.28 | -0.61 | -0.02 | -0.06 |
| 洛 川 | 5.24* | 2.14 | 2.63* | 2.50 | 1.57 | 1.50 | 0.38 | 0.32 | 0.16 | 0.54 |
| 武 功 | 2.75 | 0.64 | 1.06 | 1.11 | 0.87 | 0.50 | -0.62 | -1.18 | -0.24 | -0.47 |
| 华 山 | 3.64* | 1.96 | 1.75* | 2.11 | 0.44 | 0.61 | 0.30 | 0.32 | 0.40 | 1.26 |
| 略 阳 | 2.46 | 1.00 | 0.80 | 1.18 | 1.42 | 1.39 | -0.23 | -0.71 | 0.24 | 0.88 |
| 汉 中 | 4.89 | 1.71 | 1.98* | 2.57 | 1.94 | 1.71 | 0.68 | 1.75 | 0.59* | 2.64 |
| 佛 坪 | -8.13* | -2.85 | -2.88* | -3.35 | -1.63 | -1.86 | -2.13* | -3.43 | -1.82* | -3.25 |
| 商 州 | 1.68 | 0.89 | 1.15 | 1.11 | 0.31 | 0.25 | -0.29 | -0.54 | -0.10 | -0.28 |
| 镇 安 | 2.75* | 2.14 | 1.26* | 1.75 | 1.21 | 1.57 | 0.22 | 1.00 | 0.35 | 0.73 |
| 石 泉 | 0.99 | 0.36 | -0.04 | -0.07 | 0.44 | 0.32 | 0.23 | 0.36 | 0.04 | 0.13 |
气候因子分析 1981~2010年日照时数标准化年际变化特征,20世纪90年代前,日照时数呈较弱的减少趋势,其中在1987年出现一次高值;90年代出现明显增加趋势,90年代之后,日照时数出现明显的下降趋势。近30 a日照时数变化与潜在蒸散年际变化走向相似。说明日照时数和潜在呈正相关。平均气压年际变化,在2000年出现一次明显的转折,2000年之前,气压年际变化呈较弱的下降趋势,2000年后出现明显的波动。整体是呈上升趋势,但变化不显著,对潜在蒸散量增加趋势呈正相关。气温年际变化呈明显的增加趋势,增速约为0.082 /a,通过0.01显著水平,波动性相对其他气候因子变化幅度较小。相对湿度变化特征,2000年之前相对湿度年际变化呈减少趋势,之后逐步回升,整体呈较弱的减少趋势,与潜在蒸散量增加呈负相关。风速变化存在明显的一次波动,90年代前,风速年际变化呈较弱的下降趋势,到90年代中期,回升到最高值,之后风速逐渐减少,整体无明显变化。
综合上述,各个气候要素变化特征,气温呈积极明显上升趋势,其次是日照时数呈明显上升,平均气压呈上升趋势,风度无明显变化,相对湿度呈负相关变化。这说明在这几个要素中,除了相对湿度外,其他与潜在蒸散量年际变化一致呈增加趋势,其中气温增速是最明显,这说明潜在蒸散量与日站时数、平均气压、气温和风速呈正相关,与相对湿度呈负相关,其中气温对潜在蒸散量的作用最大。
为了进一步佐证各个气候要素对潜在蒸散量的影响,以下通过多元回归分析各个要素的影响强度,由于各个要素单位和和数量级差异,因此要对各个要素进行数据标准化处理,使得数据都在0~1之间。
经过多元回归分析(表2),其中只有相对湿度回归系数为负值,其他因子系数都为正值,说明它与潜在蒸散量呈负相关,其他气候要素都呈正相关,和上文分析相一致。由系数的数值大小可以看出,各个要素的相对贡献依次是相对湿度>气温>风速>日照时数>气压,其中最主要的影响因子有相对湿度、气温和风速,气压因子对潜在蒸散量的作用较小。
由前文分析得出潜在蒸散量在1992年发生一次明显突变,将研究时段分为前期和后期。根据前期和后期的变化量进一步分析各个因子的实际贡献率。变化量增加的有平均气温、日照时数、风速和气压,其中气温增量最大,其次是日照时数和风速,最小是平均气压;变化量减少的只有相对湿度。说明相对湿度减少时会促进潜在蒸散量的增加,其他要素增加时潜在蒸散量也相应的增加。根据实际贡献率计算公式计算得气温增加给潜在蒸散量增加42.09%,风速增加会给潜在蒸散量增加14.98%,日照时数的增加会给潜在蒸散量增加10.82%,平均气压的增加给潜在蒸散量的增加最少,只有0.01%,而相对湿度的减少给潜在蒸散量增量24.65%。
综合上述气候因子对潜在蒸散量的影响得出,对潜在蒸散量的影响较大的有平均气温、相对湿度和风速,其中平均气温的作用最大且呈正影响,其次是相对湿度的影响,但其对潜在蒸散量的作用呈负作用。虽然风速、日照时数和平均气压对潜在蒸散的作用呈正作用,但其影响强度较弱。
表2 气候要素对潜在蒸散量的贡献率
Table 2 The contribution of climate factors on potential evaporation
| 回归系数 | 均值 | 变化量 | 贡献率 | ||
|---|---|---|---|---|---|
| 1981~1992年 | 1993~2010年 | ||||
| 日照时数 | 0.12 | 0.36 | 0.62 | 0.25 | 10.82% |
| 平均气压 | 0.00 | 0.35 | 0.43 | 0.08 | 0.01% |
| 平均气温 | 0.33 | 0.32 | 0.68 | 0.36 | 42.09% |
| 相对湿度 | -0.60 | 0.56 | 0.45 | -0.12 | 24.65% |
| 风速 | 0.22 | 0.27 | 0.47 | 0.19 | 14.98% |
| 潜在蒸散量 | 0.22 | 0.51 | 0.28 | ||
本研究基于 FAO 推荐的 Penman-Monteith 公式和16个台站 1981~2010 年逐日气象观测资料估算了陕西省的潜在蒸散量 ET,在空间分布特征和时间演变规律进行分析的基础上,定量探讨了陕西地区影响 ET变化的主导因素。主要结论如下:
1) 1981~2010年潜在蒸散量呈上升趋势,增速约为3.1 mm/a,没有通过0.05显著水平检验,变化波动呈“弱减-强增-减”,分别在20世纪90年代初和90年代末出现转折点。
2) 潜在蒸散量存在2 a、5 a、8 a、22 a、32 a左右的震荡周期,震荡能量最大是32 a,其次是22 a。其中1992年左右出现一次明显的突变,刚好在震荡能量最大32 a周期上发生波动。
3) 潜在蒸散量变化空间差异明显。秦巴山一带潜在蒸散量值最高,关中地区潜在蒸散量值最低。变化趋势呈南北递减,陕南地区潜在蒸散量呈明显的增加趋势,关中地区呈较弱增加趋势,陕北地区呈减少趋势。HURST指数分布呈东西向递减,其中在0.4~0.5之间占整个研究区的77.11%。
4) 潜在蒸散量有明显的季节差异,夏季和春季变化最明显。平均气温、相对湿度和风速对潜在蒸散量的影响较大,其中平均气温的作用最大且呈正影响,其次是相对湿度的影响,但对潜在蒸散量呈负作用。
The authors have declared that no competing interests exist.
| [1] |
Changes of pan evaporation in the recent 40 yearsover the Yellow River Basin [J].https://doi.org/10.11849/zrzyxb.2003.04.007 Magsci [本文引用: 1] 摘要
Evaporation(evapotranspiration),on the one hand,is an important component in the heat and water balance of the Earth's surface,and is the component of the hydrologic cycle most directly influenced by land-use and climate change.On the other hand,evaporation(evapotran-spiration)consumes much of the water and energy that are available on the surface of the earth and therefore influence all hydrological and most meteorological processes.Basic knowledge for evaporation change over global or regional scale redounds to understand the law and causations of climate change.Up to now,studies on global climate change are,more and often,concerned with temperature and precipitation.Researches on the influence of climate change on evapora-tion(evapotranspirtation)are in small numbers.Based on observational data from1960~2000of123meteorological stations,near and in the Yellow River Basin,the spatial and temporal distri-butions of trends for pan evaporation are studied.The results show that,although the annual mean air temperature over the Yellow River Basin has,on average,increased0.6℃over the past40years,the rate of pan evaporation over the Yellow River Basin has,on average,steadily de-creased,especially in summer and spring.Compared with the1960s~1970s,the rate of annual pan evaporation of the1980s~1990s has decreased136mm or7.5%.Spatial distribution of the change rate shows that this trend is general but not universal,pan evaporation has significantly decreased over the upper and lower reaches of the Yellow River Basin,and increased in a small degree over the middle reaches of it.
|
| [2] |
基于GAME-Tibet IOP的青藏高原蒸散研究 [J].
由于缺少足够的观测资料,人们对青藏高原上蒸散问题的认识还不充足。以1998年5~9月" 全球能量与水循环亚洲季风之青藏高原试验"加强观测试验期(GAME-Tibet IOP)资料为基础,结合1967~2006年40a的气象站数据,计算了6个样点的参照蒸散量和潜在蒸散量,并在此基础上估算了实际蒸散量的大小。结果 显示,高原参照蒸散有下降趋势,但在试验期内却比40a平均值明显偏高,且和潜在蒸散之间表现出很强的相关性;试验期内气温、太阳辐射强度、风速以及饱和 水气压差等环境因子的值均高于40a的平均状况;太阳辐射强度、风速、饱和水气压差的增强是导致参照蒸散量升高的主要原因,其中以后两者对参照蒸散量的影 响尤为显著;试验期内旬实际蒸散量在9~23mm之间波动,6~8月份实际蒸散的总量可达123.3~136.9mm,占同期降水量的 38.2%~73.4%;蒸散在高原地气相互作用过程中有重要作用。
|
| [3] |
滹沱河上游山区近50年蒸散变化及主要影响因子分析 [J].
准确估计流域蒸散,掌握其变化趋势和主要影响因子,对科学认识流域水文循环规律以及管理流域水资源具有重要意义。利用傅抱璞年蒸散量公式计算滹沱河上游山区及其子流域1958~2007年逐年蒸散量,并利用Mann-Kendall-Sneyers等方法分析了流域蒸散趋势和突变特征,及其主要影响因子。结果表明在滹沱河流域傅抱璞公式能够较好的拟合蒸散。50a来全流域及各子流域年均蒸散呈下降趋势。降水对蒸散起控制作用,相对湿度在流域部分地区显著影响蒸散(α=0.05)。
|
| [4] |
2000~2010年陕北地区植被NDVI时空变化及其与区域气候的关系 [J].
<p>采用相关关系分析、空间统计分析和叠置分析,研究陕北地区2000~2010 年植被NDVI的时空变化特征,并从温度和降水2 个方面分析植被NDVI变化与区域气候的关系。研究表明,该地区植被NDVI经历了从相对快速增长到小幅波动,再到平稳增长3 个阶段。其中,陕北中东部区域植被覆盖增加显著,北部变化不大,南部略微下降。同期该区域气候干热化趋势有所改善,植被覆盖变化与区域气候相关性不高,气候对植被覆盖的影响主要表现为对植被生长期年内韵律的控制方面。</p>
|
| [5] |
Evaporation and potential evapotranspiration in India under conditions of recent and future climate change [J].https://doi.org/10.1051/lhb/2011047 URL [本文引用: 1] 摘要
We study generalized inverses on semigroups by means of Green’s relations. We first define the notion of inverse along an element and study its properties. Then we show that the classical generalized inverses (group inverse, Drazin inverse and Moore–Penrose inverse) belong to this class.
|
| [6] |
Evaporation Losing its strength [J].https://doi.org/10.1038/377687b0 URL [本文引用: 1] 摘要
CiteSeerX - Scientific documents that cite the following paper: Evaporation losing its strength
|
| [7] |
Changes in Australian pan evaporation from 1970 to 2002 [J].https://doi.org/10.1002/joc.1061 URL [本文引用: 1] 摘要
Contrary to expectations, measurements of pan evaporation show decreases in many parts of the Northern Hemisphere over the last 50 years. When combined with rainfall measurements, these data show that much of the Northern Hemisphere's terrestrial surface has become less arid over the last 50 years. However, whether the decrease in pan evaporation is a phenomenon limited to the Northern Hemisphere has until now been unknown because there have been no reports from the Southern Hemisphere. Here, we report a decrease in pan evaporation rate over the last 30 years across Australia of the same magnitude as the Northern Hemisphere trends (approximately -4 mm a-2). The results show that the terrestrial surface in Australia has, on average, become less arid over the recent past, just like much of the Northern Hemisphere.
|
| [8] |
Analysis of spatial distribution and temporal trend of reference evapotranspiration and pan evaporation in Changjiang ( Yangtze River) catchment [J]. |
| [9] |
Spatial and temporal characteristics of potential evapotranspiration trends over China [J].https://doi.org/10.1002/(SICI)1097-0088(20000330)20:4<381::AID-JOC477>3.0.CO;2-K URL [本文引用: 1] 摘要
This paper analyses the time series (1954-1993) of Penman-Monteith evapotranspiration estimates for 65 stations in mainland China and Tibet, for the country as a whole and for individual stations. The analysis shows that for China as a whole, the potential evapotranspiration (PET) has decreased in all seasons. On a regional basis, northeast and southwest China have experienced moderate evapotranspiration increases, while in northwest and southeast China evapotranspiration has decreased to a much higher extent. South of 35掳N, sunshine appears to be most strongly associated with evapotranspiration changes while wind, relative humidity and maximum temperature are the primary factors in northwest, central and northeast China, respectively. In the mountains of southwest China, a positive relation between evapotranspiration change and station altitude has been observed. If observed precipitation and PET trends remain unchanged future agricultural production, particularly in south and southwest China, will have to cope with decreasing water availability in the growing season.
|
| [10] |
Trends in pan evaporation and reference and actual evapotranspiration across the Tibetan Plateau [J].https://doi.org/10.1029/2006JD008161 URL [本文引用: 1] 摘要
中国科学院机构知识库(中国科学院机构知识库网格(CAS IR GRID))以发展机构知识能力和知识管理能力为目标,快速实现对本机构知识资产的收集、长期保存、合理传播利用,积极建设对知识内容进行捕获、转化、传播、利用和审计的能力,逐步建设包括知识内容分析、关系分析和能力审计在内的知识服务能力,开展综合知识管理。
|
| [11] |
Spatial and temporal variations and controlling factors of potential evapotranspiration in China: 1956-2000 [J].https://doi.org/10.1007/s11442-006-0101-7 URL PMID: 9770508 Magsci [本文引用: 2] 摘要
1 Introduction Evaporation is one of the important components in the water and heat balances. The transpiration of vegetation and evaporation from soil are collectively called evapotranspiration. Potential evapotranspiration is not only the theoretical l
|
| [12] |
Changes of potential evaporation in Northern China over the past 50 years [J].https://doi.org/10.1007/s11442-007-0020-2 URL [本文引用: 1] 摘要
The authors estimated the changes of potential evaporation in northern China over the past 50 years (1950-2000) by using the Penman-Monteith model and also analyzed the observation pan evaporation data in the same regions in this paper.The results showed that the potential evaporation and pan evaporation amount had a same decreasing tendency in recent 50 years.The main reasons for the decrease of potential evaporation and pan evaporation amount were due to the decrease of sunshine percentage and wind speed and increase of air humidity during this period of time.From the viewpoint of the energy,the solar radiation reduction was also one of the main reasons for evaporation decrease.The present research indicated that the air humidity increase and the increase in energy resources consumption owing to anthropogenic activities were the two important factors affecting total solar radiation reduction.According to the estimation by Penman-Monteith model the decreased amount of potential evaporation induced by reduction of solar radiation reaching the earths surface accounted for 78% of the total amount of evaporation decreased.
|
| [13] |
Determining factors in potential evapotranspiration changes over China in the period 1971—2008 [J]. |
| [14] |
Spatial and temporal variation patterns of reference evapotranspiration across the Qinghai-Tibetan Plateau during 1971-2004 [J].
Reference evapotranspiration (RET), an indicator of atmospheric evaporating capability over a hypothetical reference surface, was calculated using the Penman-Monteith method for 75 stations across the Qinghai-Tibetan Plateau between 1971 and 2004. Generally, both annual and seasonal RET decreased for most part of the plateau during the study period. Multivariate linear models were used to determine the contributions of climate factors to RET change, including air temperature, air humidity, solar radiation, and wind speed. Spatial differences in the causes of RET change were detected by K-means clustering analysis. It indicates that wind speed predominated the changes of RET almost throughout the year, especially in the north of the study region, whereas radiation was the leading factor in the southeast, especially during the summertime. Although the recent warming trend over the plateau would have increased RET, the combined effect of the reduced wind speed and shortened sunshine duration negated the effect of rising temperature and caused RET to decrease in general. The significant decrease in surface wind speed corresponded to the decreasing trends of upper-air zonal wind and the decline of pressure gradient, possibly as a result of the recent warming.
|
| [15] |
塔里木河流域山区和绿洲潜在蒸散发的不同变化及影响因素 [J].
通过塔里木河流域天山山区中部 和西南部山区11个气象站以及开都-孔雀河、阿克苏河、喀什和叶尔羌绿洲共18个气象站的气象数据,对比分析了塔里木河流域山区和绿洲在 1960~2006年间潜在蒸散发变化的不同趋势及气象因子的不同影响,并根据潜在蒸散发与山区降水、绿洲耗水之间的相互关系,分析了山区和绿洲潜在蒸散 发变化趋势不同的原因.塔里木河流域山区和绿洲都具有潜在蒸散发下降的趋势,且潜在蒸散发的下降主要表现在其空气动力学项的减小,但绿洲潜在蒸散发的下降 趋势明显强于山区.山区辐射和风速下降对潜在蒸散发的影响最为显著,而绿洲风速下降的影响最为显著.基于蒸散发互补相关理论分析发现,塔里木河流域山区和 绿洲潜在蒸散发的下降分别与降水和绿洲耗水的增加紧密联系,反映了自然因素变化和人类活动对潜在蒸散发的不同影响.
|
| [16] |
我国参考作物蒸散的空间分布和时间趋势 .https://doi.org/10.3969/j.issn.1674-7097.2007.05.017 URL [本文引用: 1] 摘要
根据我国616个地面气象台站 1975—2004年的观测资料,利用联合国粮农组织推荐的Penman-Monteith公式计算各年逐日、逐月参考作物蒸散值(ET0)和年总量。结 果表明,我国参考作物蒸散多年平均值大多界于800~1 100 mm之间,西北地区高,东北地区低。1978年出现最大值,1993年出现最低值,青藏高原以东地区波动小,西北地区波动大。参考作物蒸散变化率在 -30~30 mm.(10 a)-1之间,西部和长江流域地区显著下降,东部沿海、黄河中上游和东北显著上升。造成我国参考作物蒸散出现先降后增趋势的主要因素是日照时数(净辐射) 和饱和差。
|
| [17] |
Rome. |
| [18] |
Application of the cross wavelet transform and wavelet coherence to geophysical time series [J].https://doi.org/10.5194/npg-11-561-2004 URL [本文引用: 1] 摘要
Many scientists have made use of the wavelet method in analyzing time series, often using popular free software. However, at present there are no similar easy to use wavelet packages for analyzing two time series together. We discuss the cross wavelet transform and wavelet coherence for examining relationships in time frequency space between two time series. We demonstrate how phase angle statistics can be used to gain confidence in causal relationships and test mechanistic models of physical relationships between the time series. As an example of typical data where such analyses have proven useful, we apply the methods to the Arctic Oscillation index and the Baltic maximum sea ice extent record. Monte Carlo methods are used to assess the statistical significance against red noise backgrounds. A software package has been developed that allows users to perform the cross wavelet transform and wavelet coherence ().
|
| [19] |
Van Niel T G,等.专用气候数据空间插值软件ANUSPLIN及其应用 [J].https://doi.org/10.7519/j.issn.1000-0526.2008.2.013 URL [本文引用: 1] 摘要
空间化的气候数据作为环境因子参数是区域气候模型和地学模型的基础,而插值软件是实现气候观测点数据空间化的工具。ANUSPLIN基于薄盘样条函数理论,引入多个影响因子作为协变量进行气象要素空间插值,大大提高插值精度,且能同时进行多个表面的空间插值,对时间序列的气象要素更加适合。
|
| [20] |
近50 年来祁连山及河西走廊降水的时空变化 [J].
利用1960-2009 年的日降水量资料,采用线性趋势、5 年趋势滑动、IDW 空间插值、Morlet 小波分析、Mann-Kendall 突变检验等方法,对祁连山及河西走廊地区不同等级降水日数和降水强度的时空变化特征进行了研究。结果表明:不同等级降水日数和降水强度的多年平均在空间上既表现出东西分异,也表现出南北分异;不同等级降水日数的年际变化在绝大部分区域呈增多趋势,且自东向西增幅减小,大雨强度的年际变化在绝大部分区域呈增大趋势,其它等级降水强度为部分区域呈增大趋势,部分区域呈减小趋势;小雨、中雨日数的年际变化呈显著增多趋势,大雨日数呈明显增多趋势,暴雨日数呈不明显增多趋势,小雨、大雨强度的年际变化呈不明显减小趋势,中雨、暴雨强度呈不明显增大趋势;不同等级降水日数变化的周期集中在2a、5a、8a、11a、19a,不同等级降水强度变化的周期集中在2a、5a、11a、15a、25a;除小雨强度突变减小外,其它等级降水日数均突变增多,降水强度均突变增大,降水量的增加主要是降水日数的增多造成的,其中小雨、中雨日数的增多贡献最大。
|
| [21] |
三江源区径流演变及其对气候变化的响应 [J].https://doi.org/10.11821/xb201201008 URL [本文引用: 2] 摘要
利用水循环模型、统计检测、对比分析等手段对三江源区水循环过程进行了分析,模拟和检测了1958-2005年黄河源区出口唐乃亥站、长江源区直门达站、澜沧江源区昌都站汛期、非汛期和年径流过程的变化趋势。在此基础上,检测CSIRO和NCAR两种气候模式A1B和B1排放情景下未来2010-2039年源区出口断面的径流演变趋势,对比分析了气候变化的影响。研究表明过去48年三江源区出口唐乃亥站年径流和非汛期径流过程呈显著减少趋势,而直门达和昌都站径流过程变化趋势并不显著。这将导致对黄河中下游地区的水资源补给显著减少,加剧黄河流域水资源短缺。气候变化背景下,未来30年黄河源区径流量与现状相比有所减少,尤其是在非汛期,将持续加剧黄河中下游流域水资源短缺的现象。长江源区径流量将呈增加趋势,而且远远高于现状流量,尤其是在汛期,长江中下游地区防洪形势严峻。而澜沧江源区未来30年径流量均高于现状流量,但汛期和年径流变化并不显著,而非汛期径流变化存在不确定性,CSIRO模式B1情景显著减小,而NCAR模式B1情景显著增加。气候变化对长江源区径流影响最显著,黄河源区其次,而澜沧江源区最小。
|
| [22] |
|

/
| 〈 |
|
〉 |