王莉雯 , 卫亚星
, 卫亚星
辽宁师范大学海洋经济与可持续发展研究中心 辽宁师范大学自然地理与空间信息科学辽宁省重点实验室 辽宁师范大学城市与环境学院, 辽宁 大连 116029
Wang Liwen, Wei Yaxing
中图分类号: X144
文献标识码: A
文章编号: 1000-0690(2016)01-0135-07
收稿日期: 2014-12-11
修回日期: 2015-03-10
网络出版日期: 2016-01-20
版权声明: 2016 《地理科学》编辑部 本文是开放获取期刊文献,在以下情况下可以自由使用:学术研究、学术交流、科研教学等,但不允许用于商业目的.
基金资助:
作者简介:
作者简介:王莉雯(1971-),女,山东蓬莱人,副教授,博士,研究领域为遥感和地理信息系统应用。E-mail: wlw9585@163.com
展开
摘要
以盘锦双台河口湿地国家级自然保护区作为研究区,采用基于bootstrap的偏最小二乘回归模型(PLSR),分别构建不同光谱变换技术(包括光谱水分影响减小技术WR、包络线去除CR、光谱一阶微分FD、光谱倒数的对数LR)和原光谱数据(R)的芦苇叶片氮浓度预测模型。使用变量投影重要性指标VIP,计算了各光谱波段在估算芦苇叶片氮浓度时的重要性。研究结果表明,WR光谱变换技术的芦苇叶片氮浓度估算精度最高(R2=0.87,均方根误差=0.57),该方法可以有效减小叶片水分的影响,增强鲜叶片光谱中细微的氮吸收特征。
关键词:
Abstract
The high-accuracy quantitative inversions of foliar nitrogen concentrations in wetland plants from hyperspectral data contribute to make the advanced comprehensions of wetland ecosystem functioning, biochemical processes and nitrogen circles. The study area in this paper was located in the Panjin Shuangtaihekou Wetland National Nature Reserve Administration. The wetland was mainly dominated by phragmites australis (Cav.) Trin. ex Steud with an area of 900 km2. Foliar spectral reflectance data were measured using an ASD spectroradiometer (FieldSpec Pro FR) with a 25° field-of-view (FOV) and a spectral range of 350 to 2 500 nm. Subsequently, sampling reeds at each plot were cut at ground level and sent immediately to the laboratory. The nitrogen concentration of the vegetation was measured using a standard method of the Kjeldahl technique. Based on the different spectral transformation techniques and original spectral data (R), partial least-squares regressions (PLSR) integrating with the bootstrapping approaches were used to develop the prediction models of nitrogen concentrations in reedleaves. The set of spectral transformation techniques used in this study included the water removal (WR), continuum removal (CR), first derivative (FD), and reciprocal-logarithm transformation (LR). The variable importance of projection (VIP) was used as a metric to quantify the important degree of a spectral band for estimating foliar nitrogen concentrations with the various spectral transformation techniques. The results indicated that WR spectral transformation in combination with PLSR estimated foliar nitrogen concentration with the highest accuracy (R2=0.87,RMSE=0.57). The WR approachcan effectively reduce the water absorption effects on the subtle nitrogen absorption features across the fresh leaf spectrum. This study demonstrated the performance of the WR technique in increasing the accuracy of foliar nitrogen estimation for wetland plants. The estimation accuracies achieved from the applications of all spectral transformation techniques were higher compared to the original spectral data. The selected feature bands for estimating foliar nitrogen concentrations from the WR technique were all centered at the shortwave infrared (SWIR) spectral region, and forty percent (40%) of the selected bands from WR were associated with known nitrogen estimation bands. While, the selected feature bands from other spectral transformation techniques were located in both the SWIR and visible near-infrared (VNIR) spectral region. Phenology plays an important role in foliar nitrogen estimation using spectroscopy data. Therefore, there is a need for the future studies for understanding how phenology influences the performance of the WR technique in estimating foliar nitrogen concentrations in wetland plants.
Keywords:
氮是植物生长发育和光合作用的重要限制营养元素,与湿地生态系统光合效率、净初级生产力、碳氮循环等功能过程存在密切联系[1,2]。湿地氮循环已成为热点研究领域,湿地植物在湿地氮循环过程中发挥着特殊的作用,它能够吸收和积累湿地水体中的氮、磷等物质,这导致湿地植物不同器官的氮含量呈现动态变化[3]。
众多实验研究表明,水分对植被光谱反射率的影响波段范围在近红外波段(NIR)和短波红外波段(SWIR)。由于植被叶片的细胞液、细胞膜及吸收水分,在1 450和1 950 nm附近有吸收波谷,在970和1 190 nm波段附近也有强吸收特征。由于植被叶片水分的光谱吸收,随着叶片含水量的增加,光谱反射率减小,反射光谱曲线的波谷和波峰的相对形态变得更为突出明显[4]。
高光谱分辨率数据能够以较小的波长间隔来反映目标辐射的波谱特性。在可见光至红外波段范围内,被分割成几百个乃至更多个窄波段,从其近乎连续的光谱曲线上,可以分辨出不同物体光谱特征的微小差异[5]。因此,将高光谱分辨率数据应用于湿地植被研究,可以提取湿地植被细微变化的生理生化特性,其精细的光谱分辨率可以反映出湿地植被光谱丰富细微的特征并反映光谱间的细微差别,从而适用于湿地植被生理生化参数的精确估算[6]。
盘锦双台河口湿地国家级自然保护区位于辽宁省辽东湾北部盘锦市境内的双台子河入海河口处,地理坐标为东经121°30′~122°00′E,北纬40°45′~41°10′N之间。双台子河、大凌河、饶阳河、盘锦河、大辽河等河流在此地汇归入海,河海的交互作用,形成了大面积地势低平的沼泽湿地,海拔高度0~6.5 m,主要植被类型为芦苇(Phragmites australis)。年平均降水量为650 mm,年平均气温为8.5℃。盘锦双台河口湿地在环境保护、气候调节、物种保护、科研等方面正在发挥着巨大作用,同时在补充水源、防御海水入侵、生态保护、旅游、养殖及资源开发等方面又具有巨大潜能[7,8]。
本研究于2013年7月21~27日在盘锦双台河口湿地国家级自然保护区进行野外实验。此时,研究区内的芦苇生长趋于稳定,芦苇叶片生物量达到最大值。在研究区随机选取了31个单位面积为0.5 m×0.5 m的芦苇生长样方,在样方内随机选取5株芦苇,每株芦苇选择上中下不同高度的3个叶片进行叶片样本的光谱测量。每个叶片光谱测量10次。计算每个样方所测叶片光谱的平均值作为该样方叶片反射光谱曲线,以消除偶然误差。
使用ASD野外光谱辐射仪(ASD FieldSpec Pro FR),波长范围为350~2 500 nm,1 nm间隔采样。其光谱分辨率在350~1 000 nm之间是3 nm,1 000~2 500 nm之间是10 nm。测量视场角为25°,在芦苇叶片上方1 cm距离处,垂直向下观测。叶片的观测半径为0.22 cm,观测面积为0.15 cm2。选择晴朗无云,风力较小,10:00~14:00间进行测量。使用的参考板为99%的朗伯体白板(Labsphere,Inc.,North Sutton,New Hampshire,USA)。
在芦苇叶片光谱测量完成后,将选择的叶片样本进行采集。将采集的叶片放置在保温箱中送至实验室,采用凯式定氮法进行叶片的氮浓度测量。
为减小水分吸收对高光谱数据提取微弱生物化学光谱特征信息的影响,Gao等[9]提出了非线性最小二乘法光谱匹配技术,即将植被叶片水分光谱和干物质光谱的非线性拟合作为鲜叶片的光谱。Schlerf等[10]将该种技术命名为光谱水分影响减小技术(WR),在此基础上改进,其计算公式为:
式中,Rmod(λ)为λ波段处模拟的反射率;Cw为植被叶片水分浓度;Kw(λ)为水分的吸收系数;Cp为植被叶片干物质浓度;Kp(λ)为干物质的吸收系数;A和B为背景相关的模拟系数;(A+Bλ)项代表了模拟光谱的背景状况,该项被假定在较短波长范围内是线性的。
减小叶片水分影响的光谱WWR(λ)为测量反射率Rmes(λ)和模拟反射率Rmod(λ)残差光谱:
本研究采用Matlab编程的Nelder-Mead算法来确定公式(1)中未知参数A、B和Cw的最优值。进行参数A、B和Cw最优选择的原则是使得在特定光谱波段的测量鲜叶片光谱Rmes(λ)与模拟光谱Rmod(λ)之间的方差和最小。Nelder-Mead算法(或称单纯形算法)是一种用于优化多维无约束问题的局部搜索算法,适用于求解无约束非线性函数的最优值问题。其计算原理是利用多面体来逐步逼近最佳点,在n维空间产生n+1个点构成单纯形,尝试将代价函数最差顶点以新的最佳点代替,并通过反射、扩展、内收缩、外收缩及整体变小的方式来更新多面体,从而构建一个新的单纯形,逐步逼近至最优解[11]。
在确定A、B和Cw的取值后,设定Cp值为0,根据(1)式得出叶片水分对鲜叶片总反射率的贡献。
本文采用基于bootstrap的偏最小二乘回归模型(PLSR)来构建盘锦湿地芦苇叶片氮浓度预测模型。PLSR是一种多元回归统计分析方法,它集中典型相关分析、主成分分析和多元线性回归分析基本功能的优点[12-15]。但当PLSR的应用对象为小样本量,并且其具有非线性性质和总体分布特征难以确定时,使用bootstrap技术是有效的。bootstrap方法利用有限的样本资料经由多次重复抽样,重新建立起足以代表母体样本分布之新样本。
建模和精度评价均在MATLAB平台上编程计算,基本步骤包括:基于原数据建立偏最小二乘回归模型,获得初始回归系数数据集;在原数据集中随机抽取样本点,记录其值后再放回原数据集,如此重复n次,从而得到一个bootstrap样本;基于获得的bootstrap样本建立偏最小二乘回归模型;重复上述步骤,得到偏最小二乘回归系数数据组,构建基于bootstrap样本的回归系数数据集;计算基于bootstrap样本的回归系数与初始回归系数差值的绝对值,取绝对值的90%分位点作为拒绝域的临界值;比较初始回归系数的绝对值与临界值,如前者大于后者,则自变量通过显著性检验予以保留,否则舍去;将经过显著性检验的自变量在原数据集上重新构建偏最小二乘回归模型,重复上述步骤,直到所有变量均通过显著性检验。
本研究采用留一交叉验证法(leave-one-out)进行预测模型精度的检验,选取决定系数(determination coefficient,R2)和均方根误差(root mean square error,RMSE)为评价指标。
本文对比了光谱变换技术[包括WR、包络线去除(CR)、光谱一阶微分(FD)、光谱倒数的对数(LR)]以及原光谱数据(R)反演芦苇叶片氮浓度的性能。分别以芦苇叶片WR、CR、FD、LR以及R光谱与相对应的叶片氮浓度建立基于bootstrap的PLSR模型。
CR、FD、LR均为较常用的光谱变换技术,高光谱遥感常利用这些光谱变换技术较好地估算了植被生化组分的含量[10,13]。而且,一些光谱变换技术(例如CR、FD、对数变换等)还可用于在不同程度上减小植被叶片水分的影响[6,10]。CR能够突出光谱曲线的吸收和反射特征,通过将其归一到相一致的光谱背景上,便于和其它光谱曲线进行比较和提取特征波段[14]。FD计算了光谱曲线相邻波段的瞬时变化差异,能够迅速找出反射光谱曲线发生变化的波段,通过分解重叠混合光谱扩大了光谱特征的差异[15]。LR技术对光谱反射率数据计算倒数后再进行对数变换,从而不仅增强了可见光范围的光谱差异,还降低了由光照条件变化导致的多重变化因素的影响。
本文通过计算变量投影重要性指标VIP(文中量表示为VVIP)来分析各光谱波段对芦苇叶片氮浓度预测模型的贡献。VIP的计算公式为:
式中,VVIPj为第j个自变量的投影重要性指标;p为自变量数量;m为基于PLSR的成分提取数量; th代表第h个成分(h=1,2,3,…,m);Rd(Y, th)为成分th对因变量Y的解释能力,是二者相关系数的平方;whj是轴wh的第j个分量,用以计算xj对构造成分th的边际贡献,wh为矩阵
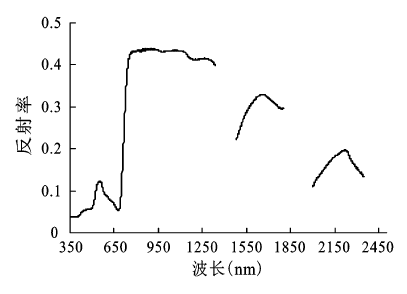
图1为经测量获取的湿地植被芦苇叶片的平均反射光谱曲线。数据采集时间为当地芦苇生长最旺盛的7月份,该物候期的光谱最能代表芦苇叶片的光谱特征。图1看出,芦苇叶片具有绿色植物叶片的一般光谱特征:在可见光波段,受到叶绿素等色素吸收作用的影响,叶片反射率较低,在553 nm处有一个明显的反射峰,在679 nm处有一个吸收谷;679 ~794 nm的近红外波段有一个反射“陡坡”(常被称为“红边”特征),叶片的细胞结构和叶片中色素在近红外波段保持的高度透过性导致了“红边”光谱特征的产生;在近红外区域叶片反射率较大,在794~1 323 nm之间形成一个反射率达到43.9%的反射峰,在波长845、1 066、1 264 nm出现了局部区域的反射峰;在短波红外波长范围,芦苇叶片的光谱特征主要受叶片所含水分的影响,尤其以1 450、1 950 nm波段为中心的水分吸收带处,形成明显的波谷,由于来自大气和水分噪音干扰较大,删除了该区间的反射光谱曲线。
图1 湿地植被芦苇叶片反射光谱曲线
Fig.1 The spectral reflectance curve for reed leaves in wetlands
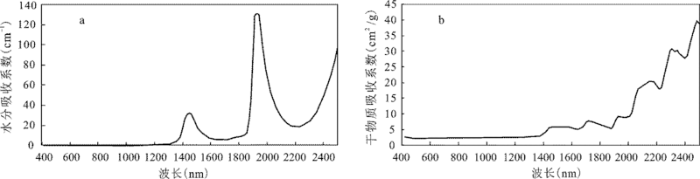
PROSPECT模型是一个基于平板模型来计算叶片半球反射率和透射率的辐射传输模型(模拟的光谱范围为400~2 500 nm)[17,18]。该模型根据组分浓度(叶绿素浓度、水的浓度和干物质浓度等)及对应的吸收系数来描述植被叶片对光的吸收特性。模型中水、叶绿素和干物质的吸收系数是通过实验来确定的。本研究从PROSPECT模型中获取公式(1)中的水分吸收系数[Kw(λ)]和干物质吸收系数[Kp(λ)]2个参数(图2)。图中看出,水分在近红外和短波红外光谱范围存在吸收光谱,而在可见光区域其吸收光谱近乎为0。干物质的吸收光谱主要位于短波光谱范围。
图2 水分(a)和干物质(b)吸收系数
Fig.2 The absorption coefficients of water(a)and dry matter(b)
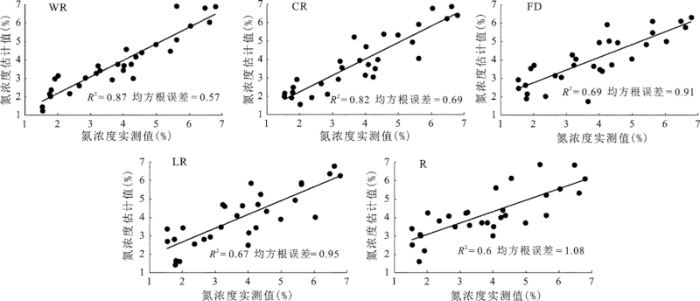
研究结果表明,光谱变换WR技术和基于bootstrap的PLSR模型相结合可以成功用于估算湿地植被芦苇叶片的氮浓度。图3显示,采用WR和CR光谱变换技术估算芦苇叶片氮浓度的精度较高,R2分别达到0.87和0.82,均方根误差分别为0.57和0.69。
图3 基于不同光谱变换技术的芦苇叶片氮浓度估算结果与实测值比较
Fig.3 Estimated versus measured nitrogen concentrations for reed leaves based on different spectral transformation techniques
WR方法在估算芦苇叶片氮浓度时获得了较好的精度。主要因为植物叶片组分中的蛋白质是主要的氮承载体之一,其对太阳辐射的吸收能力较弱,这种较弱的吸收特征较易被叶片中的水分影响所掩盖[17]。而WR技术可以降低水分吸收对植被叶片生物化学参数浓度细微变化的影响,这对于水分吸收影响的主要光谱区域在估算叶片生物化学参数时的预测精度尤其重要[9]。Schlerf等[10]以挪威云杉针叶作为研究对象,结果表明WR技术获得了较好的氮浓度估算精度。Abel等[18]采用WR方法高精度预测了南非草原的氮磷比。在本研究中CR方法在估算芦苇叶片氮浓度时取得了略逊于WR方法的预测精度水平。
相比WR和CR技术,FD、LR和R光谱变换技术预测芦苇叶片氮浓度的精度较低,R2在0.6~0.69区间变化,均方根误差值在0.91~1.08之间。本研究中LR和FD估算芦苇叶片氮浓度所获得的精度较为接近,多数研究中LR和FD技术对叶片生化组分的估算精度常常超过使用原反射率光谱的预测精度,与本文研究结果一致[6,10,13]。
本文采用VIP方法进行湿地植被芦苇叶片氮浓度估算波段选取的研究,有助于获知对应于不同光谱变换技术的氮吸收特征波段的选取,同时也有利于在进一步研究中探索湿地植被区别于陆生植被独特的氮吸收特征波段。
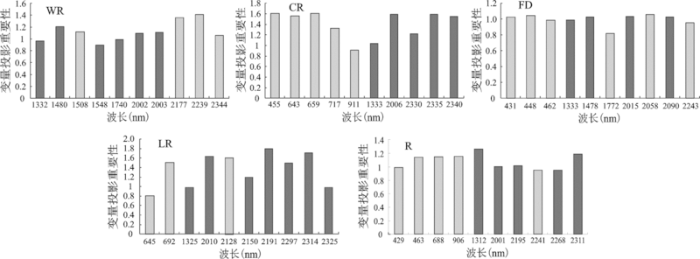
基于光谱测量数据和PLSR模型的VIP方法计算分析结果,显示不同光谱变换技术应用中,各波段在估算芦苇叶片氮浓度时的重要性(图4)。使用VIP方法进行光谱波段重要性评估时,当波段的VIP值大于1.0时,说明该波段在估算芦苇叶片氮浓度时具有重要的作用;当波段的VIP值在0.5~1.0之间时,说明该波段的预测重要性还需要进一步分析,这需要通过增加样本或根据其它条件进行判断;当波段的VIP值小于0.5时,说明该波段不是预测芦苇叶片氮浓度的关键波段。一般认为,VIP值大于0.8的对应波段是预测芦苇叶片氮浓度的重要波段(图4)。
图4 基于不同光谱变换技术的芦苇叶片氮浓度各估算波段的VIP重要性(浅灰色柱条对应已知的与氮相关的估算波段,深灰色柱条则代表在本研究中新发现的芦苇叶片氮浓度估算波段)
Fig.4 The VIP values of various bands for estimating foliar nitrogen concentrations of reeds based on different spectral transformation techniques
图4中,浅灰色柱条对应已知的与氮相关的估算波段,即已在发表文献中经验证与氮吸收特征相关的波段。而深灰色柱条则代表在本研究中新发现的芦苇叶片氮浓度估算波段,它们并不在已知的氮相关估算波段之列。Curran[1]的研究结果显示,与氮有关的主要吸收特征在1 020、1 510、1 690、1 940、1 980、2 060、2 130、2 180、2 240、2 300和2 350 nm波长附近。Kumar等[19]总结了以前文献中出现的氮吸收特征波段。另外,植被氮素总量的75%包含在叶绿体中,叶绿素含量主要由可用的氮含量决定,叶片中氮浓度和叶绿素浓度之间存在强相关性。叶绿素吸收光谱的最强区域分别在可见光区域的红光波段和蓝紫光波段 。因此,一些研究采用了对叶绿素较为敏感的光谱波段构成的植被指数来估算植被氮浓度(例如,冠层叶绿素浓度光谱指数,CCCI)[20]。但是,以不同植被为对象的研究中,构成光谱指数的氮吸收特征波段也存在明显的差异。
从图4看出,基于WR光谱变换技术所选取的芦苇叶片氮浓度估算特征波段,与已知氮吸收特征波段存在联系的比例只占40%。当采用FD方法时,所选取估算波段的60%与已知氮估算波段相关,这在所有对比的光谱变换技术中的比例是最高的。总体来看,各光谱变换技术所选取的芦苇叶片氮浓度估算波段,与已知氮估算波段相关的波段所占比例偏低(30%~60%)。这可能反映了湿地植被由于其独特的生长环境,显示出与陆生植被相异的氮吸收特征波段。本研究所关注的WR技术,选取的与已知氮估算波段相关的波段所占比例较低,这也为挖掘湿地植被氮敏感波段提供了新的研究途径。
图4显示,不同光谱变换技术应用于芦苇叶片氮浓度估算过程中,所选取的估算波段大多数位于SWIR波谱范围。一些研究发现氮素在1 500~1 720 nm范围内对叶片波谱特征影响较大[21]。相比于可见光近红外波段(VNIR),SWIR波段用于植被氮浓度估算的主要优势包括:大气窗口SWIR波谱范围的总透过率超过90%、植被反射信号较强、较易诊断的植被特征等。这与本研究的结论相一致,尤其对于WR光谱变换技术,选取的氮估算波段其中心全部位于SWIR波段。
植被叶片中氮生化组分的光谱吸收区域主要位于SWIR和可见光波段,这些氮的吸收特征并不突出明显,通常被鲜叶片中水分的吸收特征所掩盖,而对于干叶片较易区分出氮的光谱吸收特征。因此,减小叶片水分影响可以提高植被氮浓度的估算精度。本文的主要研究结论包括:
1) WR光谱变换技术结合基于bootstrap的PLSR模型,可以以较高的精度估算湿地植被芦苇叶片氮浓度(R2=0.87,均方根误差=0.57)。该方法通过减小叶片水分影响,增强了鲜叶片光谱中细微的氮吸收特征。
2) 对比不同光谱变换技术(包括WR、CR、FD、LR)和原光谱数据(R)预测芦苇叶片氮浓度的估算精度,WR的估算精度最高,原光谱数据的估算精度最低(R2=0.6,均方根误差=1.08)。
3) WR光谱变换技术选取的芦苇叶片氮浓度估算特征波段其中心全部位于SWIR光谱范围,并且选取波段中40%的波段为已知氮估算波段。
受环境条件的影响和植被自身的物候变化,氮吸收特征波段位置常常发生偏移。因此,湿地植被氮浓度估算特征波段的选取,应该进一步深入研究和应用,不应局限于个别季相和植被类型,而应设置在不同环境、地理和植被类型的更广泛条件下。
The authors have declared that no competing interests exist.
| [1] |
Remote sensing of foliar chemistry [J]. |
| [2] |
青海省草地资源净初级生产力遥感监测 [J].
在研究特定区域的草地光能利用率和环境影响因素典型特点的基础上,建立基于光能利用率的草地NPP遥感估算模型,模拟并分析2006 年青海省草地FPAR、光能利用率、NPP的空间分布和季相变化特征。研究结果表明,2006 年青海省草地净初级生产力平均值为173.28 gC/(m<sup>2</sup>·a)。青海省东南部、南部和青海湖周围三个地区,是青海省草地NPP 较高的区域。不同草地类型的NPP 存在差异,高覆盖度草地的单位面积平均NPP 为193.82 gC/(m<sup>2</sup>·a),中覆盖度草地NPP为157.14 gC/(m<sup>2</sup>·a),低覆盖度草地NPP为121.08 gC/(m<sup>2</sup>·a)。
Net primary productivity of grassland resources monitoring based on remote sensing data in Qinghai Province .
在研究特定区域的草地光能利用率和环境影响因素典型特点的基础上,建立基于光能利用率的草地NPP遥感估算模型,模拟并分析2006 年青海省草地FPAR、光能利用率、NPP的空间分布和季相变化特征。研究结果表明,2006 年青海省草地净初级生产力平均值为173.28 gC/(m<sup>2</sup>·a)。青海省东南部、南部和青海湖周围三个地区,是青海省草地NPP 较高的区域。不同草地类型的NPP 存在差异,高覆盖度草地的单位面积平均NPP 为193.82 gC/(m<sup>2</sup>·a),中覆盖度草地NPP为157.14 gC/(m<sup>2</sup>·a),低覆盖度草地NPP为121.08 gC/(m<sup>2</sup>·a)。
|
| [3] |
湿地遥感研究进展 [J].
<p>湿地在维持生态平衡、保护生物多样性等方面发挥着重要作用。由于各种自然、人为因素的影响,目前越来越多的湿地转化为农业和城市用地,湿地的质量退化和数量减少引起人们广泛关注。遥感技术为湿地研究提供强有力的技术支撑。重点从遥感影像数据源、湿地分类、湿地调查3 个方面论述遥感技术在湿地研究中的应用,同时指出目前湿地遥感研究中存在的不足,并展望其未来发展。</p>
Application of remote sensing technology to wetland research .
<p>湿地在维持生态平衡、保护生物多样性等方面发挥着重要作用。由于各种自然、人为因素的影响,目前越来越多的湿地转化为农业和城市用地,湿地的质量退化和数量减少引起人们广泛关注。遥感技术为湿地研究提供强有力的技术支撑。重点从遥感影像数据源、湿地分类、湿地调查3 个方面论述遥感技术在湿地研究中的应用,同时指出目前湿地遥感研究中存在的不足,并展望其未来发展。</p>
|
| [4] |
叶片辐射等效水厚度计算与叶片水分定量反演研究 [J].https://doi.org/10.11834/jrs.20070340 Magsci [本文引用: 1] 摘要
在分析叶片水分对叶片反射率光谱影响的基础上,结合叶片内部水、干物质、叶绿素等光谱吸收系数曲线特征,分析了975nm波长水气吸收特征处叶片与光线相互作用原理,并利用Beer定律和945nm,975nm波长光谱反射率差值,推导了975nm波长辐射等效水厚度REWT的计算公式。由于表面反射、杂散射光、非均匀介质和叶片内部多次散射等因素,光在叶片内部的辐射传输不能直接用Beer定律描述,且利用Beer定律计算的REWT与叶片等效水水厚度EWT之间会有较大的偏差。论文设计和获取了多植物、不同水分梯度的叶片光谱获取试验数据,整理和分析了欧盟Lopex93数据,利用这两组独立数据和论文提出的REWT计算公式,比对验证了975nm波长叶片REWT和叶片EWT的统计模型,结果表明:由于光在叶片内部的多次散射,REWT是EWT的3.3倍左右。论文研究结果一方面为叶片EWT定量遥感探测提供了一种快速、简单且有较强通用性的计算方法和模型,另一方面,探测叶片REWT和EWT的定量关系,有助于了解叶片内部的光辐射传输情况,特别是间接了解近红外波段叶片内部的多次散射情况。
Detection of leaf EWT by calculating REWT from reflectance spectra .https://doi.org/10.11834/jrs.20070340 Magsci [本文引用: 1] 摘要
在分析叶片水分对叶片反射率光谱影响的基础上,结合叶片内部水、干物质、叶绿素等光谱吸收系数曲线特征,分析了975nm波长水气吸收特征处叶片与光线相互作用原理,并利用Beer定律和945nm,975nm波长光谱反射率差值,推导了975nm波长辐射等效水厚度REWT的计算公式。由于表面反射、杂散射光、非均匀介质和叶片内部多次散射等因素,光在叶片内部的辐射传输不能直接用Beer定律描述,且利用Beer定律计算的REWT与叶片等效水水厚度EWT之间会有较大的偏差。论文设计和获取了多植物、不同水分梯度的叶片光谱获取试验数据,整理和分析了欧盟Lopex93数据,利用这两组独立数据和论文提出的REWT计算公式,比对验证了975nm波长叶片REWT和叶片EWT的统计模型,结果表明:由于光在叶片内部的多次散射,REWT是EWT的3.3倍左右。论文研究结果一方面为叶片EWT定量遥感探测提供了一种快速、简单且有较强通用性的计算方法和模型,另一方面,探测叶片REWT和EWT的定量关系,有助于了解叶片内部的光辐射传输情况,特别是间接了解近红外波段叶片内部的多次散射情况。
|
| [5] |
扎龙湿地克钦湖富营养化状态的高光谱遥感评价 [J].
通过分析扎龙湿地克钦湖水体高光谱反射率与水质参数的相关关系,采用单波段、波段比值等算法分别选取特征波长建立水质参数的高光谱定量模型,并且结合修正营养状态指数(TSIM)和综合营养状态指数法,对水体的富营养化程度进行了监测和评价。结果表明,单波段归一化反射率对叶绿素a估测模型效果较为理想;利用高光谱一阶微分反射率,诊断各水质参数的敏感波段,建立线性模型,确定了TN、TP、SD、CODMn的敏感波段分别为733nm、765nm、782nm、680nm。单因素水质参数评价水体富营养化水平具有一定的局限性。综合考虑多个水质指标,对水质的富营养化程度进行了评价,结果显示,克钦湖水体呈现出中营养化状态,需要采取一定的措施,防范于未然。
Hyperspectral data applied in monitoring and evaluating the water trophic state of Keqin Lake, ZhalongWetland .
通过分析扎龙湿地克钦湖水体高光谱反射率与水质参数的相关关系,采用单波段、波段比值等算法分别选取特征波长建立水质参数的高光谱定量模型,并且结合修正营养状态指数(TSIM)和综合营养状态指数法,对水体的富营养化程度进行了监测和评价。结果表明,单波段归一化反射率对叶绿素a估测模型效果较为理想;利用高光谱一阶微分反射率,诊断各水质参数的敏感波段,建立线性模型,确定了TN、TP、SD、CODMn的敏感波段分别为733nm、765nm、782nm、680nm。单因素水质参数评价水体富营养化水平具有一定的局限性。综合考虑多个水质指标,对水质的富营养化程度进行了评价,结果显示,克钦湖水体呈现出中营养化状态,需要采取一定的措施,防范于未然。
|
| [6] |
Water-removed spectra increase the retrieval accuracy when estimating savanna grass nitrogen and phosphorus concentrations [J].https://doi.org/10.1016/j.isprsjprs.2011.01.008 Magsci [本文引用: 3] 摘要
Information about the distribution of grass foliar nitrogen (N) and phosphorus (P) is important for understanding rangeland vitality and for facilitating the effective management of wildlife and livestock. Water absorption effects in the near-infrared (NIR) and shortwave-infrared (SWIR) regions pose a challenge for nutrient estimation using remote sensing. The aim of this study was to test the utility of water-removed (WR) spectra in combination with partial least-squares regression (PLSR) and stepwise multiple linear regression (SMLR) to estimate foliar N and P, compared to spectral transformation techniques such as first derivative, continuum removal and log-transformed (Log(1/R)) spectra. The study was based on a greenhouse experiment with a savanna grass species (Digitaria eriantha). Spectral measurements were made using a spectrometer. The D. eriantha was cut, dried and chemically analyzed for foliar N and P concentrations. WR spectra were determined by calculating the residual from the modelled leaf water spectra using a nonlinear spectral matching technique and observed leaf spectra. Results indicated that the WR spectra yielded a higher N retrieval accuracy than a traditional first derivative transformation (R(2) = 0.84, RMSE = 0.28) compared to R(2) = 0.59, RMSE = 0.45 for PLSR. Similar trends were observed for SMLR The highest P retrieval accuracy was derived from WR spectra using SMLR (R(2) = 0.64, RMSE = 0.067), while the traditional first derivative and continuum removal resulted in lower accuracy. Only when using PLSR did the first derivative result in a higher P retrieval accuracy (R(2) = 0.47, RMSE = 0.07) than the WR spectra (R(2) = 0.43, RMSE = 0.070). It was concluded that the water removal technique is a promising technique to minimize the perturbing effect of foliar water content when estimating grass nutrient concentrations. 2011 International Society for Photogrammetry and Remote Sensing, Inc. (ISPRS). Published by Elsevier B.V. All rights reserved.
|
| [7] |
|
| [8] |
氮可利用性对东北不同类型湿地土壤有机碳矿化的影响 [J].
2010年6~10月,在中国东北连续多年冻土区,岛状多年冻土区和季节性冻土区采集典型湿地土壤,通过室内分析和模拟试验研究了不同冻土区湿地土壤有机碳矿化及其微生物活性对不同氮可利用性的响应特征。试验设置4个氮处理水平,分别为0 mg/g(N0),0.1 mg/g(N1),0.2 mg/g(N2),0.5 mg/g(N3)。结果表明,培养结束后3种土壤在N0处理下的有机碳累计矿化量分别为5 646 mg/kg,2 103 mg/kg和1 287 mg/kg,与初始土壤有机碳含量、全氮含量和微生物量碳(MBC)呈显著正相关。3种土壤在氮输入后的有机碳矿化速率和累积矿化量都明显低于N0处理,表明氮输入对有机碳矿化产生抑制作用。随着氮输入量的增大,氮输入对不同土壤有机碳矿化的抑制作用有所差异,表现为:不同氮输入对连续多年冻土区土壤累积矿化量影响无显著差异;岛状多年冻土区土壤在N1和N2处理下的有机碳累积矿化量明显高于N3处理;季节性冻土区土壤在N2和N3处理下的累积矿化量明显低于N1处理。培养结束后,3种土壤微生物量氮(MBN)含量随氮输入量增加而降低,MBC/MBN随氮输入量增加而增加;季节性冻土区草甸沼泽土培养结束后的MBN和MBC/MBN都与累积矿化量存在显著相关关系,表明季节性冻土区草甸沼泽土氮可利用性增加可能改变了微生物的组成或结构,进而对有机碳矿化产生影响。
Effects of exogenous nitrogen availability on carbon mineralization of different wetland soil types in northeast China .
2010年6~10月,在中国东北连续多年冻土区,岛状多年冻土区和季节性冻土区采集典型湿地土壤,通过室内分析和模拟试验研究了不同冻土区湿地土壤有机碳矿化及其微生物活性对不同氮可利用性的响应特征。试验设置4个氮处理水平,分别为0 mg/g(N0),0.1 mg/g(N1),0.2 mg/g(N2),0.5 mg/g(N3)。结果表明,培养结束后3种土壤在N0处理下的有机碳累计矿化量分别为5 646 mg/kg,2 103 mg/kg和1 287 mg/kg,与初始土壤有机碳含量、全氮含量和微生物量碳(MBC)呈显著正相关。3种土壤在氮输入后的有机碳矿化速率和累积矿化量都明显低于N0处理,表明氮输入对有机碳矿化产生抑制作用。随着氮输入量的增大,氮输入对不同土壤有机碳矿化的抑制作用有所差异,表现为:不同氮输入对连续多年冻土区土壤累积矿化量影响无显著差异;岛状多年冻土区土壤在N1和N2处理下的有机碳累积矿化量明显高于N3处理;季节性冻土区土壤在N2和N3处理下的累积矿化量明显低于N1处理。培养结束后,3种土壤微生物量氮(MBN)含量随氮输入量增加而降低,MBC/MBN随氮输入量增加而增加;季节性冻土区草甸沼泽土培养结束后的MBN和MBC/MBN都与累积矿化量存在显著相关关系,表明季节性冻土区草甸沼泽土氮可利用性增加可能改变了微生物的组成或结构,进而对有机碳矿化产生影响。
|
| [9] |
Retrieval of equivalent water thickness and information related to biochemical components of vegetation canopies from AVIRIS data [J].https://doi.org/10.1016/0034-4257(95)00039-4 URL [本文引用: 2] 摘要
Remote sensing of water status and biochemical components of vegetation can have important applications in the fields of agriculture and forestry. Reflectance of fresh, green vegetation in the 1.0-2.5 m region is dominated by liquid water absorption and also weakly affected by absorption due to biochemical components, such as protein, lignin, and cellulose. We have developed both the nonlinear and linear least squares spectrum-matching techniques for deriving equivalent water thickness (EWT) of vegetation from AVIRIS data in the 1.0 m and 1.6 m regions. EWT values are compared with in situ canopy measurements in Harvard Forest, Massachusetts. Seasonal variations of EWTs over an agricultural area in Greeley, Colorado are determined. EWTs from the 1.0 m region are generally greater than those from the 1.6 m region. This is because the absorptivity of water near 1.0 m is much less than that at 1.6 m--resulting in a greater mean absorption path length in the 1.0 m region. After fitting the AVIRIS data with a reflectance spectrum of water, a weak lignin-cellulose absorption feature centered at 1.72 m is seen in the difference spectra. We map the depth of the 1.72- m feature, which can be considered as an index of abundance of those compounds in the canopy. AVIRIS data for the Harvard Forest, Massachusetts were analyzed and compared with laboratory chemical analysis of the foliage. The results obtained with the linear least squares spectrum-matching technique are comparable to the stepwise linear regression results obtained from first difference spectra.
|
| [10] |
Retrieval of chlorophyll and nitrogen in Norway spruce (Picea abies L. Karst.) using imaging spectroscopy [J].https://doi.org/10.1016/j.jag.2009.08.006 Magsci [本文引用: 5] 摘要
<h2 class="secHeading" id="section_abstract">Abstract</h2><p id="">The research evaluated the information content of spectral reflectance (laboratory and airborne data) for the estimation of needle chlorophyll (<em>C</em><sub>AB</sub>) and nitrogen (<em>C</em><sub>N</sub>) concentration in Norway spruce (<em>Picea abies</em> L. <em>Karst.</em>) needles. To identify reliable predictive models different types of spectral transformations were systematically compared regarding the accuracy of prediction. The results of the cross-validated analysis showed that <em>C</em><sub>AB</sub> can be well estimated from laboratory and canopy reflectance data. The best predictive model to estimate <em>C</em><sub>AB</sub> was achieved from laboratory spectra using continuum-removal transformed data (<em>R</em><sup>2</sup>cv = 0.83 and a relative RMSEcv of 8.1%, <em>n</em> = 78) and from hyperspectral HyMap data using band-depth normalised spectra (<em>R</em><sup>2</sup>cv = 0.90, relative RMSEcv = 2.8%, <em>n</em> = 13). Concerning the nitrogen concentration, we observed somewhat weaker relations, with however still acceptable accuracies (at canopy level: <em>R</em><sup>2</sup>cv = 0.57, relative RMSEcv = 4.6%). The wavebands selected in the regression models to estimate <em>C</em><sub>AB</sub> were typically located in the red edge region and near the green reflectance peak. For <em>C</em><sub>N</sub>, additional wavebands related to a known protein absorption feature at 2350 nm were selected. The portion of selected wavebands attributable to known absorption features strongly depends on the type of spectral transformation applied. A method called “water removal” (WR) produced for canopy spectra the largest percentage of wavebands directly or indirectly related to known absorption features. The derived chlorophyll and nitrogen maps may support the detection and the monitoring of environmental stressors and are also important inputs to many bio-geochemical process models.</p>
|
| [11] |
|
| [12] |
Multivariate analysis of nitrogen content for rice at the heading stage using reflectance of airborne hyperspectral remote sensing [J].https://doi.org/10.1016/j.fcr.2011.03.013 Magsci [本文引用: 1] 摘要
Airborne hyperspectral remote sensing was adapted to establish a general-purpose model for quantifying nitrogen content of rice plants at the heading stage using three years of data. There was a difference in dry mass and nitrogen concentration due to the difference in the accumulated daily radiation (ADR) and effective cumulative temperature (ECT). Because of these environmental differences, there was also a significant difference in nitrogen content among the three years. In the multiple linear regression (MLR) analysis, the accuracy (coefficient of determination: R(2), root mean square of error: RMSE and relative error: RE) of two-year models was better than that of single-year models as shown by R(2) >= 0.693, RMSE <= 1.405 g m(-2) and RE <= 9.136%. The accuracy of the three-year model was R(2) = 0.893, RMSE = 1.092 g m(-2) and RE = 8.550% with eight variables. When each model was verified using the other data, the range of RE for two-year models was similar or increased compared with that for single-year models. In the partial least square regression (PLSR) model for the validation, the accuracy of two-year models was also better than that of single-year models as R(2) >= 0.699, RMSE <= 1.611 g m(-2) and RE <= 13.36%. The accuracy of the three-year model was R(2) = 0.837, RMSE = 1.401 g m(-2) and RE = 11.23% with four latent variables. When each model was verified, the range of RE for two-year models was similar or decreased compared with that for single-year models. The similarities and differences of loading weights for each latent variable depending on hyperspectral reflectance might have affected the regression coefficients and the accuracy of each prediction model. The accuracy of the single-year MLR models was better than that of the single-year PLSR models. However, accuracy of the multi-year PLSR models was better than that of the multi-year MLR models. Therefore, PLSR model might be more suitable than MLR model to predict the nitrogen contents at the heading stage using the hyperspectral reflectance because PLSR models have more sensitive than MLR models for the inhomogeneous results. Although there were differences in the environmental variables (ADR and ECT), it is possible to establish a general-purpose prediction model for nitrogen content at the heading stage using airborne hyperspectral remote sensing. (C) 2011 Elsevier B.V. All rights reserved.
|
| [13] |
On spectral estimates of fresh leaf biochemistry [J].https://doi.org/10.1080/014311698215441 URL [本文引用: 2] 摘要
Protein, lignin, cellulose, hemicellulose, sugar, and starch contents per unit leaf area of fresh leaves were related to the corresponding reflectance and transmittance spectra using multiple linear regressions. When the regressions are evaluated over the data set used for calibrating, they show relatively good performances. However, applying these relations to an independent data set led to very poor performances. It was concluded that the detailed canopy biochemistry was not accessible in a robust way from fresh leaf optical properties measurements over a large range of leaf types. The only variables that can be accurately derived from leaf reflectance or transmittance measurements are water and dry matter (i.e., the specific leaf weight) contents per unit leaf area. Transforming reflectance (rho) or transmittance (tau) values into the corresponding absorbance (log(1/rho) or log(1/tau)) values improves the accuracy of the estimates. Using transmittance rather than reflectance provides better retrieval performances. We investigated the sensitivity of the relationships to the radiometric noise associated to reflectance or transmittance measurements. It appears, particularly for water, that the estimates are quite sensitive to the radiometric resolution of the instrument used. We propose a technique that minimizes the sensitivity of the estimates to the radiometric noise and improves their robustness. It consists of enlarging the calibration data set by adding random instrumental noise similar to that observed over the test data set. Results show that, this way, three wavebands (1910, 1380, and 900nm for water; 2310, 2160, and 1870 nm for dry matter) allow good estimates of water (RMSE 0.0011g cm 2) and dry matter contents (RMSE 0.0008 g cm 2).
|
| [14] |
Reflectance spectroscopy:quantitative analysis techniques for remote sensing applications [J]. |
| [15] |
叶片化学组分成像光谱遥感探测机理分析 [J].https://doi.org/10.11834/jrs.20000208 Magsci [本文引用: 2] 摘要
利用地面光谱仪的测量数据, 进行了成像光谱遥感探测叶片化学组分的机理性研究。采用多元逐步回归方法, 分析了鲜叶片7种化学组分含量与其光谱特性的统计关系, 分别建立了反射率ρ及其变化式1/ρ、logρ和ρ的一阶导数K<sub>ρ</sub>与化学组分含量的统计方程, 并对这4个指标的性能进行了比较和评价。
Mechanism analysis of leaf biochemical concentration by high spectral remote sensing .https://doi.org/10.11834/jrs.20000208 Magsci [本文引用: 2] 摘要
利用地面光谱仪的测量数据, 进行了成像光谱遥感探测叶片化学组分的机理性研究。采用多元逐步回归方法, 分析了鲜叶片7种化学组分含量与其光谱特性的统计关系, 分别建立了反射率ρ及其变化式1/ρ、logρ和ρ的一阶导数K<sub>ρ</sub>与化学组分含量的统计方程, 并对这4个指标的性能进行了比较和评价。
|
| [16] |
PLS-regression: a basic tool of chemometrics [J].https://doi.org/10.1016/S0169-7439(01)00155-1 URL [本文引用: 1] 摘要
PLS-regression (PLSR) is the PLS approach in its simplest, and in chemistry and technology, most used form (two-block predictive PLS). PLSR is a method for relating two data matrices, X and Y, by a linear multivariate model, but goes beyond traditional regression in that it models also the structure of X and Y. PLSR derives its usefulness from its ability to analyze data with many, noisy, collinear, and even incomplete variables in both X and Y. PLSR has the desirable property that the precision of the model parameters improves with the increasing number of relevant variables and observations.This article reviews PLSR as it has developed to become a standard tool in chemometrics and used in chemistry and engineering. The underlying model and its assumptions are discussed, and commonly used diagnostics are reviewed together with the interpretation of resulting parameters.Two examples are used as illustrations: First, a Quantitative Structure-Activity Relationship (QSAR)/Quantitative Structure-Property Relationship (QSPR) data set of peptides is used to outline how to develop, interpret and refine a PLSR model. Second, a data set from the manufacturing of recycled paper is analyzed to illustrate time series modelling of process data by means of PLSR and time-lagged X-variables.
|
| [17] |
PROSPECT:a model of leaf optical properties [J]. |
| [18] |
Heitkönig, Renaud Mathieu, Moses A.Cho.Savanna grass nitrogen to phosphorous ratio estimation using field spectroscopy and the potential for estimation with imaging spectroscopy [J]. |
| [19] |
Imaging spectroscopy and vegetation science [M]// |
| [20] |
Integrated narrow-band vegetation indices for prediction of crop chlorophyll content for application in precision agriculture [J]. |
| [21] |
SWIR-based spectral indices for assessing nitrogen content in potato fields [J]. |

/
| 〈 |
|
〉 |