张其兵 , 康世昌
, 康世昌
Zhang Qibing, Kang Shichang
中图分类号: P951
文献标识码: A
文章编号: 1000-0690(2016)12-1937-08
收稿日期: 2015-12-9
修回日期: 2016-02-20
网络出版日期: 2016-12-20
版权声明: 2016 《地理科学》编辑部 本文是开放获取期刊文献,在以下情况下可以自由使用:学术研究、学术交流、科研教学等,但不允许用于商业目的.
基金资助:
作者简介:
作者简介:张其兵(1975-),男,安徽安庆人,博士,讲师,主要从事冰川遥感研究。E-mail: 10555108@qq.com
展开
摘要
利用Landsat TM/ETM+/8 OLI和HJ1A遥感影像资料作为数据源,通过目视解译方法,提取念青唐古拉山脉西段雪线高度变化值,同时对研究区周边气温与降水变化趋势进行分析,研究其与冰川变化的关系。结果表明:2004~2013年北坡13条冰川和南坡15条冰川的雪线高度都呈升高的趋势;从整体上来考察,北坡雪线高度升高值为14 m/a,南坡升高值为4.9 m/a,北坡升高速度比南坡快;自1964年以来,研究区气温升高趋势显著,降水增加不明显,气候变暖是冰川退缩的主要原因;北坡冰川比南坡冰川经历更大的物质负平衡,主要是由于气温的升高率北坡比南坡快所致。
关键词:
Abstract
Glaciers in the Tibetan Plateau have experienced change in recent decades with the climate change, and the change trend were not homogeneous. The variation of snow line altitude (SLA) can indicate the glacier change. The changes of SLA for glaciers in the western Nyainqentanglha Range can be detected by remote sensing images obtained at the end of ablation season, such as Landsat TM/ETM+/8 OLI and HJ1A images, when eye interpretation technologywere used to extract snow line. Meanwhile, the variation trend of temperature and precipitation recorded by 4 meteorological stations adjacent to the research area were analyzed, so as to find its influence on glacier change. The results showed that SLA of total studied 28 glaciers rose obviously in 2004-2013. SLA on north slope as a whole raised 14 m/a, while 4.9 m/a on south slope. The air temperature in the studied area rose obviously, precipitation rose slowly since 1964. Climate warming is the main cause for glacier recession. Glaciers on north slope experienced more negative mass balance than south slope, because the rate of air temperature increase on the north is higher than that on the south.
Keywords:
冰川变化是全球气候变化的良好指示器[1,2]。全球和区域气候变化影响冰川(冰盖)面积(area)、高程(elevation)、平衡线高度(ELA, Equilibrium Line Altitude)变化等,反过来冰川(冰盖)变化又影响地区和全球气候,形成正反馈机制[3-6]。由于冰川所处的特殊自然环境,人工监测只能在点上展开,并且费时费力,因此,对于绝大部分冰川只能通过遥感来监测。冰川物质平衡对气候变化具有高度敏感性,雪线高度(SLA,Snow Line Altitude)可以作为ELA的一个好的替代,利用遥感手段监测冰川雪线高度变化进而监测物质平衡与气候变化[7]。用遥感影像来提取雪线,主要是利用近红外波段影像,该波段在湿雪与冰表面上不易饱和,其反射率与雪粒径的大小及雪冰表面上的湿润度有关。
青藏高原随着气温的升高,冰川经历强烈的物质负平衡,随着海拔的升高,增暖的趋势更明显,青藏高原冰川物质平衡呈现空间分异特征,念青唐古拉山脉西段是青藏高原主要冰川集中区之一,冰储量变化研究显示,2003~2009年间冰川高程变化值为-0.30±0.13 m/a,其中古仁河口冰川2005~2010年物质平衡为-0.312 m w.e.[8, 9]。冰川面积变化研究显示,自1970以来,念青唐古拉山脉西段北坡纳木错流域冰川面积变化率位于-6.8%~-18.2%之间,念青唐古拉山脉东南坡的冰川面积变化率在-5.2%~-5.8%范围内,面积减小率北坡比南坡大,北坡扎当冰川比南坡的拉弄、爬努、西布和汤色2号冰川的退缩速度快[10-18]。本文将对该区域的雪线高度变化进行研究,从另一侧面探讨冰川与气候变化的相互关系。
念青唐古拉山脉西段位于青藏高原的中南部,呈北东-西南走向,西起尼木县,向东北延伸至当雄县,范围为29.8°N~31.1°N,89.9°E~91.6°E,平均高度5 500 m[14, 15],6 000 m以上的山峰有30多座,超过7 000 m的有4座,念青唐古拉主峰位于30°23.33′N,90°34.57′E,海拔7 117 m[16](图1)。念青唐古拉山脉西段夏季受印度季风的控制,冬季受西风带的控制[16]。夏季接受强烈的太阳辐射和印度季风带来丰富的水汽,5~9月是湿季,盛行东南风,降水主要集中在7~9月;10月到次年4月是干季,受低太阳高度角和强烈的西风影响,空气寒冷干燥[11,13]。 研究区临近的当雄、那曲、班戈与申扎气象站近50 a来的气温与降水数据被用来分析该区域气候变化趋势。那曲、班戈与申扎气象站距离纳木错湖分别为130 km,50 km和140 km。
图1 念青唐古拉山脉西段冰川分布
Fig.1 Glacier distribution in the western Nyainqentanglha Range, Tibetan Plateau
用来进行雪线提取的遥感影像获取日期优先选取冰川消融季末期,因为该时间段内有最小的积雪面积。选用每年消融季全部可用的遥感影像,取其中雪线高度最高的作为当年的平衡线。念青唐古拉山脉西段在8月与9月雪覆盖最少,故尽量选取该时间段内的影像。云的影响也限制了遥感影像的选取。本文选取的影像类型有LandsatMSS/TM/ETM+/8 OLI和HJ1A,来自美国地质调查局USGS(http://earthexplorer.usgs.gov/)和中国资源卫星应用中心(http://www.cresda.com)。念青唐古拉山脉西段由于积累期与消融期重叠,8、9月天空云量多,获得的影像质量比较差,真正可以利用的影像数量少,只选取了跨度为7 a共14景数据。其中2005年、2006年与2007年的影像只能以7月份的来代替,该时间段内的雪线高度可能比实际值要偏低。尽管从2003年5月以后Landsat ETM+影像扫描线校正器(scan line corrector)失效,减少了可以用来进行雪线测定的冰川数目,但仍旧有些冰川被清晰地记录并可以利用来进行雪线的提取。
冰川表面可以分为积累区和消融区,消融区包括裸冰和冰碛覆盖下的冰川,积累区包括附加冰、湿雪、渗浸带和干雪带[3,21]。由于冰川表面雪粒径大小、含水量和雪中颗粒物浓度的差别,可见光在积累区的反射率要大于消融区[22,23]。利用遥感影像观测到的雪线是季节雪线(Seasonal Snow Line),也称瞬时雪线(TSL,Transient Snow Line),它随季节而变化,冬季低,夏季高[24]。在大陆性冰川的雪线附近有附加冰带,它的下界才是真正的雪线。通过消融季末期遥感影像获取的雪线,大致相似于冰川物质平衡线。本研究中从USGS下载的Landsat MSS、TM、ETM+和8OLI影像都是L1T/L1G产品,L1T数据产品经过系统辐射校正和地面控制点几何校正,并且通过DEM进行了地形校正。自2003年5月31日开始,Landsat7 ETM+影像数据有22%的数据条带丢失[25],需要进行数据填补。本研究中用ENVI 4.8中的tm_destripe模块进行去条带处理。对于HJIA影像,几何畸变严重,需要进行正射纠正。启动ERDAS IMAGINE 9.3中地形校正(Geometric correction)模块,以2004年9月9日Landsat-7 TM L1T影像做参考影像,以V4.1 SRTM DEM为地形参考,均匀地选取19个地面控制点,校正后的影像RMS均方根误差在一个像元内。把念青唐古拉山脉西段所有的影像配准到该区域2004年09月09日Landsat-7 TM L1T影像上,配准误差在一个像元以内,采用统一的投影、水准面和椭球体(WGS84椭球体,UTM投影)。在消融季末期的遥感影像上,不同物质的光谱值有足够的差异性,雪线很容易被目视识别,雪线高度为冰川冰连续地被雪覆盖的最高高程。应用自动运算法则来区分雪线会变得困难,并且某一运算法则并不适合所有的影像,如针对TM/ETM+影像的band 3/band 5、band 4/band 5和均一化差异雪盖指数(NDSI,Normalize difference snow index)运算法则,针对主成份影像的最大似然分类法等[26]。本研究中我们采用目视解译人工手绘法。雪线勾画在几乎是连续的雪盖的最高海拔处,并且穿越整个冰表面的宽度,把雪线叠加在SRTM DEM上来提取雪线高程。本研究中所用到的SRTM DEM下载自中国科学院计算机网络信息中心SRTM国际科学数据镜像服务系统(http://srtm.datamirror.csdb.cn),SRTM V4.1 DEM数据填补了空洞,经度与纬度间隔都是5°。念青唐古拉山脉西段的28条冰川(图2)被用来提取雪线高度。先把雪线从矢量转化成栅格的形式,统计雪线与DEM相交的所有像元的高程,进而获得每条冰川每年雪线高度的平均值、最大值、最小值和标准差,以上操作在ArcGIS 9.3中完成。雪线高程的不确定性是由于雪覆盖、雪线季节性差异、冰川表面高程变化及DEM的误差等造成的。本研究中的标准偏差不包括这些不确定性因素引起的误差,仅仅反应每一条冰川的表面高程变化。
图2 念青唐古拉山脉西段研究雪线高度变化的冰川位置
注:绿色字母表示南坡冰川,红色字母表示北坡冰川。
Fig.2 Location of glaciers studied for SLA variation in the western Nyainqentanglha Range
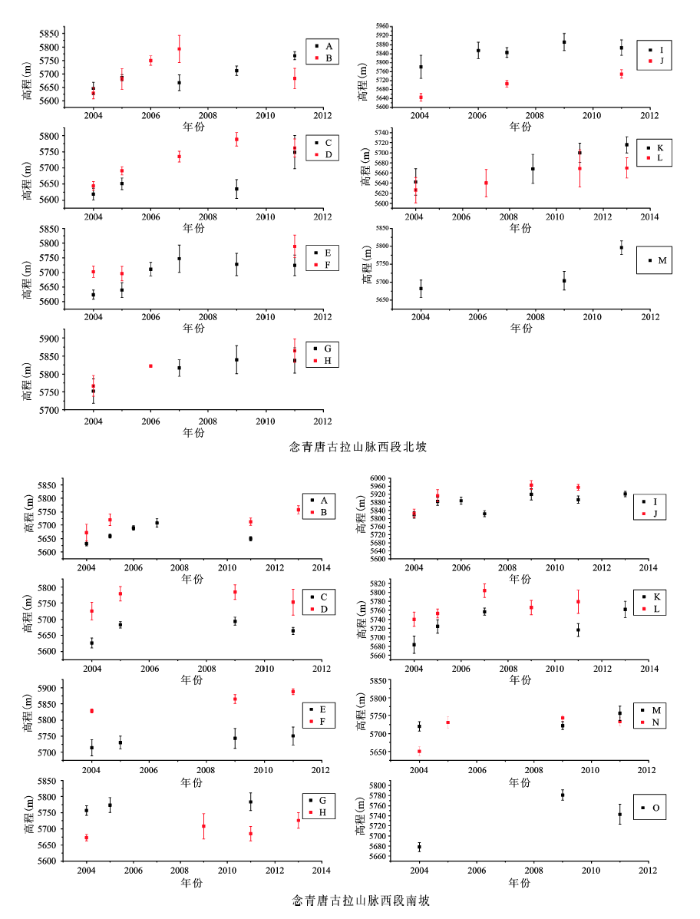
单条冰川的雪线高度及其随时间变化的不同趋势反应了不同山谷的积累和消融的状况。由于念青唐古拉山脉西段地区消融期与积累期重合,8月和9月的遥感影像云量多,用来进行雪线高度变化计算的冰川具有随机性,且从2004~2013年雪线高度的数值不连续,有些冰川只有3个年份值。因此,对于南坡与北坡单条冰川的雪线高度及总的平均雪线高度不讨论,我们只讨论单条冰川的变化趋势及南坡与北坡平均雪线高度的变化趋势。
南坡与北坡所有冰川的雪线高度都呈升高的趋势,一些时间系列数据少的冰川呈稳定的升高趋势(北坡的H、J、K、L和M冰川,南坡的E、F、G和M冰川),其它的冰川有较大的年际波动,但总的趋势是升高的(图3,表1)。不同的冰川有不同的变化趋势,体现了单条冰川的独特动力学机制。
图3 念青唐古拉山脉西段单条冰川的雪线高度年际变化
注:误差条代表平均值的一个标准差。
Fig.3 SLAs annual variation for each glacier in the western Nyainqentanglha Range
表1 念青唐古拉山脉西段单条冰川雪线高度的平均值、标准差和线性变化趋势
Table 1 Summary of mean, standard deviation and linear variation trend for individual glacier SLAs in the western Nyainqentanglha Range
| 北坡冰川 | 平均(m a.s.l.) | 标准差(m) | 线性趋势(m/a) | R2 | P |
|---|---|---|---|---|---|
| A | 5696 | 47 | 14.95 | 0.82 | 0.03 |
| B | 5707 | 65 | 5.14 | 0.05 | 0.73 |
| C | 5664 | 58 | 13.54 | 0.59 | 0.24 |
| D | 5724 | 58 | 17.92 | 0.79 | 0.04 |
| E | 5696 | 51 | 14.32 | 0.54 | 0.10 |
| F | 5729 | 52 | 13.5 | 0.96 | 0.12 |
| G | 5812 | 41 | 12.74 | 0.85 | 0.08 |
| H | 5818 | 49 | 12.96 | 0.91 | 0.20 |
| I | 5848 | 41 | 12.25 | 0.64 | 0.10 |
| J | 5700 | 52 | 14.64 | 0.97 | 0.12 |
| K | 5682 | 33 | 8.32 | 0.95 | 0.03 |
| L | 5651 | 22 | 5.32 | 0.96 | 0.02 |
| M | 5727 | 60 | 14 | 0.7 | 0.37 |
| 南坡冰川 | 平均(m a.s.l.) | 标准差(m) | 线性趋势(m/a) | R2 | P |
| A | 5668 | 31 | 1.1 | 0.01 | 0.88 |
| B | 5716 | 35 | 6.22 | 0.61 | 0.22 |
| C | 5667 | 30 | 4.07 | 0.2 | 0.55 |
| D | 5760 | 27 | 2.65 | 0.1 | 0.68 |
| E | 5735 | 16 | 4.69 | 0.92 | 0.04 |
| F | 5860 | 30 | 8.35 | 1 | 0.07 |
| G | 5772 | 14 | 3.1 | 0.74 | 0.34 |
| H | 5698 | 24 | 4.72 | 0.59 | 0.23 |
| I | 5878 | 42 | 8.55 | 0.45 | 0.10 |
| J | 5914 | 63 | 16.18 | 0.72 | 0.15 |
| K | 5728 | 32 | 4.95 | 0.35 | 0.29 |
| L | 5768 | 25 | 4.68 | 0.3 | 0.34 |
| M | 5733 | 20 | 4.23 | 0.57 | 0.46 |
| N | 5714 | 43 | 8.91 | 0.47 | 0.32 |
| O | 5734 | 52 | 11.46 | 0.63 | 0.42 |
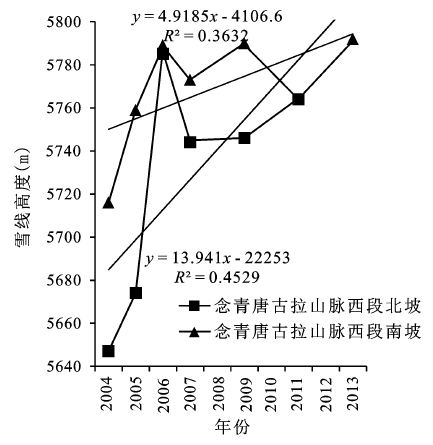
对雪线高度平均值的分析得出,念青唐古拉山脉西段北坡雪线高度从2004年的5 647±58 m a.s.l.上升到2011年的5 764±67 m a.s.l.,每年上升14 m(R2=0.45,P=0.14),呈明显的上升趋势。念青唐古拉山脉西段南坡雪线高度从2004年的5 716±67 m a.s.l.上升到2013年的5 792±88 m a.s.l.,每年上升了4.9 m(R2=0.36,P=0.152),雪线高度也呈较为明显的上升趋势(图4),这种变化趋势亦未考虑雪覆盖、雪线季节性差异、冰川表面高程变化及DEM误差等导致的误差。北坡相对于南坡来说雪线高度经历相对稳定的上升过程,少一些波动性。北坡雪线高度上升速度比南坡快,说明北坡经历更大的物质负平衡。单条冰川的雪线高度变化没有一致的模式,可能是由于冰川的坡度坡向不同引起降水、气温和太阳入射辐射的不同造成的。
图4 2004~2013年念青唐古拉山脉西段北坡与南坡平均雪线高度变化趋势比较
Fig.4 Comparison of the average SLAs variation trend for the Northern and Southern slope of the western Nyainqentanglha Range in 2004-2013
念青唐古拉山脉附近的班戈、那曲、申扎和当雄气象站有长时间序列(1964~2012年)的气象资料,可以被用来分析本区域气候变化。4个气象站点1964~2012年冬半年(10~3月)和夏半年(4~9月)气温和降水年际变化趋势见图5和图6。可以看出,冬半年增温趋势显著,增温速率为0.41~0.67℃/10a,如邻近纳木错流域的那曲气象站冬半年增温速率达到0.67℃/10a,冬半年降水量也呈增加趋势,但不明显;同时期夏半年气温和降水也呈上升趋势,气温的增温速率为0.25~0.36℃/10a,略低于冬半年气温的增长幅度。
图5 念青唐古拉山脉西段邻近4个气象站点冬半年平均气温和降水量的年际变化
Fig.5 Variations of annual temperature and precipitation in winter half year for the four meteorological stations adjacent to the western Nyainqentanglha Range
图6 念青唐古拉山脉西段邻近4个气象站点夏半年平均气温和降水量的年际变化
Fig.6 Variations of annual temperature and precipitation in summer half year for the four meteorological stations adjacent to the western Nyainqentanglha Range
念青唐古拉山脉西段2004~2006年雪线高度持续增加且变化率大,主要是由于该时间段内夏季气温升高,降水明显减少所致。2006年以后,雪线高度处于震荡之中甚至有所下降,主要是由于气温和降水处于波动状态。其它因素如降水的季节性分布与降水形态的差异,也可能导致冰川表面物质平衡的年际差异[27, 28]。北坡的典型冰川扎当冰川(编号为C)上升速率明显大于南坡的典型冰川西布冰川(编号为F)和爬努冰川(编号为I)。冰川高程、面积与雪线高度变化趋势有很好的一致性,都显示该区域冰川呈萎缩状态,主要是气温升高所致。北坡冰川比南坡冰川经历更大的物质负平衡,主要是由于夏季气温的升高率北坡比南坡快[16]。
本文利用Landsat MSS/TM/ETM+/8 OLI和HJ1A影像数据资料,对念青唐古拉山脉西段2000~2013年的雪线高度变化进行研究,结果表明念青唐古拉山脉西段北坡13条冰川和南坡15条冰川的雪线高度都呈升高的趋势,北坡雪线高度每年上升14 m,南坡雪线高度每年上升了4.9 m,北坡雪线高度上升速度比南坡快。结合前人对面积变化的研究,念青唐古拉山脉西段冰川面积减少,雪线高度升高,北坡冰川萎缩的强度比南坡大,主要是由于该地区气温升高,且夏季气温的升高率北坡比南坡快所致。
基于遥感观测的雪线高度变化能科学地反应冰川变化,与其它参数如面积和高程的变化趋势一致。由于该研究区域消融季末期天空云量多,可用的光学影像数量少,导致时间系列数据缺失,冰川变化趋势精度有局限。后续的研究中,将利用微波影像来弥补充光学影像的不足,及时动态地监测冰川与气候变化。
The authors have declared that no competing interests exist.
| [1] |
sIntegrated monitoring of mountain glaciers as key indicators of global climate change: the European Alps [J].https://doi.org/10.3189/172756407782871512 URL [本文引用: 1] 摘要
The internationally recommended multi-level strategy for monitoring mountain glaciers is illustrated using the example of the European Alps, where especially dense information has been available through historical times. This strategy combines in situ measurements (mass balance, length change) with remote sensing (inventories) and numerical modelling. It helps to bridge the gap between detailed local process-oriented studies and global coverage. Since the 1980s, mass balances have become increasingly negative, with values close to 611 m w.e.aduring the first 5 years of the 21st century. The hot, dry summer of 2003 alone caused a record mean loss of 2.45 m w.e., roughly 50% above the previous record loss in 1998, more than three times the average between 1980 and 2000 and an order of magnitude more than characteristic long-term averages since the end of the Little Ice Age and other extended periods of glacier shrinkage during the past 2000 years. It can be estimated that glaciers in the European Alps lost about half their total volume (roughly 0.5% a) between 1850 and around 1975, another 25% (or 1% a) of the remaining amount between 1975 and 2000, and an additional 10–15% (or 2–3% a) in the first 5 years of this century.
|
| [2] |
Quantifying global warming from the retreat of glaciers [J]. |
| [3] |
The physics of glaciers [M]. |
| [4] |
Glacier fluctuations and climate change detection [J].URL 摘要
Abstract Observed glacier fluctuations contribute important information about rates of change in energy fluxes at the earth/atmosphere-interface, possible acceleration trends in the development and the range of preindustrial variability. Both, the mass balance as the direct, undelayed signal as well as the cumulative length change as a clear but indirect, delayed, filtered and strongly enhanced signal, have a remarkable memory function and should be used in combination for worldwide glacier monitoring in view to climate change detection.
|
| [5] |
Glaciers and climate change [M].
|
| [6] |
Retreating alpine glaciers: increased melt rates due to accumulation of dust (Vadret da Morteratsch, Switzerland) [J]. |
| [7] |
Using remote-sensing data to determine equilibrium-line altitude and mass-balance time series: validation on three French glaciers, 1994-2002 [J].https://doi.org/10.3189/172756505781829106 URL [本文引用: 1] 摘要
ABSTRACT Alpine glaciers are very sensitive to climate fluctuations, and their mass balance can be used as an indicator of regional-scale climate change. Here, we present a method to calculate glacier mass balance using remote-sensing data. Snowline measurements from remotely sensed images recorded at the end of the hydrological year provide an effective proxy of the equilibrium line. Mass balance can be deduced from the equilibrium-line altitude (ELA) variations. Three well-documented glaciers in the French Alps, where the mass balance is measured at ground level with a stake network, were selected to assess the accuracy of the method over the 1994鈥2002 period (eight mass-balance cycles). Results obtained by ground measurements and remote sensing are compared and show excellent correlation (r 2 > 0.89), both for the ELA and for the mass balance, indicating that the remote-sensing method can be applied to glaciers where no ground data exist, on the scale of a mountain range or a given climatic area. The main differences can be attributed to discrepancies between the dates of image acquisition and field measurements. Cloud cover and recent snowfalls constitute the main restrictions of the image-based method.
|
| [8] |
Different glacier status with atmospheric circulations in Tibetan Plateau and surroundings [J].https://doi.org/10.1038/NCLIMATE1580 Magsci [本文引用: 1] 摘要
The Tibetan Plateau and surroundings contain the largest number of glaciers outside the polar regions(1). These glaciers are at the headwaters of many prominent Asian rivers and are largely experiencing shrinkage(2), which affects the water discharge of large rivers such as the lndus(3'4). The resulting potential geohazards(5,6) merit a comprehensive study of glacier status in the Tibetan Plateau and surroundings. Here we report on the glacier status over the past 30 years by investigating the glacial retreat of 82 glaciers, area reduction of 7,090 glaciers and mass-balance change of 15 glaciers. Systematic differences in glacier status are apparent from region to region, with the most intensive shrinkage in the Himalayas (excluding the Karakorum) characterized by the greatest reduction in glacial length and area and the most negative mass balance. The shrinkage generally decreases from the Himalayas to the continental interior and is the least in the eastern Pamir, characterized by the least glacial retreat, area reduction and positive mass balance. In addition to rising temperature, decreased precipitation in the Himalayas and increasing precipitation in the eastern Pamir accompanied by different atmospheric circulation patterns is probably driving these systematic differences.
|
| [9] |
A reconciled estimate of glacier contributions to sea level rise: 2003 to 2009 [J].https://doi.org/10.1126/science.1234532 URL PMID: 23687045 [本文引用: 1] 摘要
Abstract Glaciers distinct from the Greenland and Antarctic Ice Sheets are losing large amounts of water to the world’s oceans. However, estimates of their contribution to sea level rise disagree. We provide a consensus estimate by standardizing existing, and creating new, mass-budget estimates from satellite gravimetry and altimetry and from local glaciological records. In many regions, local measurements are more negative than satellite-based estimates. All regions lost mass during 2003–2009, with the largest losses from Arctic Canada, Alaska, coastal Greenland, the southern Andes, and high-mountain Asia, but there was little loss from glaciers in Antarctica. Over this period, the global mass budget was –259 ± 28 gigatons per year, equivalent to the combined loss from both ice sheets and accounting for 29 ± 13% of the observed sea level rise.
|
| [10] |
A glacier inventory for the western Nyainqentanglha Range and the Nam Co Basin, Tibet, and glacier changes 1976-2009 [J].https://doi.org/10.5194/tc-4-419-2010 URL [本文引用: 1] 摘要
ABSTRACT The western Nyainqentanglha range is located in the south-eastern centre of the Tibetan Plateau. Its western slope drains into Lake Nam Co. The area is of special interest for glacio-climatological research as this region is influenced by both the continental climate of central Asia and the Indian Monsoon system and it is situated at the transition zone between temperate and subcontinental glaciers. A glacier inventory for the whole mountain range for the year ~2000 was generated using automated remote sensing and GIS techniques based on Landsat ETM+ and SRTM3 DEM data. Change analysis is based on data from Hexagon KH-9 and Landsat MSS (year 1976), Metric Camera (year 1984), and Landsat TM/ETM+ (1991, 2001, 2005, 2009). Manual adjustment was especially necessary for the panchromatic Hexagon data and for debris covered glaciers. The whole mountain range contains about 960 glaciers covering an area of 795.6 卤 22.3 km虏 while the catchment area of Nam Co covers 198.1 卤 5.6 km虏. The median elevation of the glaciers is ~5800 m a.s.l. with the majority terminating around 5600 m. Five glaciers with debris-covered tongues terminate lower than 5200 m. The glacier area decreased between 1976 and 2001 by about 6 卤 3%, which is less than presented in previous studies based on topographic maps from the 1970s and Landsat data from 2000. The shrinkage rate increased in the period 2001 - 2009. No advancing glaciers were detected. Detailed length measurements for five glaciers indicate a retreat of the tongues of around 10 m per year (1976-2009) with higher absolute but lower relative values for the larger glaciers. No consistent trend was found for the rate of change within the investigation period which might indicate different response times of individual glaciers.
|
| [11] |
Glacier and glacial lake changes and their relationship in the context of climate change, Central Tibetan Plateau 1972-2010 [J].https://doi.org/10.1016/j.gloplacha.2013.09.011 URL [本文引用: 1] 摘要
The alpine ecosystem of the Western Nyainqentanglha region, located in the Central Tibetan Plateau, has experienced a lot of changes in the context of climatic change. The long data record of remote sensing data allowed us to evaluate spatio-temporal change in this remote area. The ecosystem changes of the Western Nyainqentanglha region were detected by using Landast MSS/TM/ETM +, Hexagon KH-9, Glas/ICESat, SRTM3 DEM remote sensing data and GIS techniques. The area of glacier lakes was delineated by visual interpretation, while for the inland lake by image classification. The change of glacier thickness was obtained by Glas/ICESat data of 2004 and 2008. Results show high variation in extent of glaciers and lakes with increased temperature and precipitation in the past 40 years. These variations include glacial retreat, increased water level of inland lakes and increased number of glacier lakes to higher altitudes. Glaciers lost 22% of its coverage from 1977 to 2010, and the annual shrinkage rate accelerated in the last decade compared with the previous time period of 1977-2001. In average, the thickness of the monitored glaciers reduced by 4.48 m from 2004 to 2008 with an annual rate of 1.12 m. From 1972 to 2009, the number of new formed glacier lakes increased by 150 and the area of glacier lakes increased by 173% (4.53 km). At the same time, the surface area of the largest salt lake in Tibet expanded by 4.13% (80.18 km). These variations appear to be associated with an increase in mean annual temperature of 0.05 掳C per year, and an increase in annual precipitation of 1.83 mm per year in the last four decades. By analyzing the relationship between the decreased glacier area and the increased number and extent of lakes in the vertical zones over the past 40 years, there is a high correlation of 0.81. These results indicate that the climate change has great impacts on glaciers and glacier lakes on the central Tibetan Plateau. Further detailed investigations are required to understand the contribution of melting water and precipitation to the water cycle and the complicated hydrological relationship between the characteristics of glaciers and glacier lakes and climate warming in this alpine region.
|
| [12] |
The response of lake-glacier variations to climate change in Nam Co Catchment, central Tibetan Plateau, during 1970-2000 [J].https://doi.org/10.1007/s11442-008-0177-3 Magsci 摘要
<a name="Abs1"></a>Based upon the 1970 aero-photo topographic map, and TM/ETM satellite images taken in 1991 and 2000, the authors artificially interpreted boundaries of lake and glaciers in Nam Co Catchment, and quantified lake-glacier area variations in different stages by “integrated method” with the support of GIS. Results show that from 1970 to 2000, lake area increased from 1942.34 km<sup>2</sup> to 1979.79 km<sup>2</sup> at a rate of 1.27 km<sup>2</sup>/a, while glacier area decreased from 167.62 km<sup>2</sup> to 141.88 km<sup>2</sup> at a rate of 0.86 km<sup>2</sup>/a. The increasing rate of lake in 1991–2000 was 1.76 km<sup>2</sup>/a that was faster than 1.03 km<sup>2</sup>/a in 1970–1991, while in the same period of time, the shrinking rates of glaciers were 0.97 km<sup>2</sup>/a and 0.80 km<sup>2</sup>/a respectively. Important factors, relevant to lake and glacier response to the climate, such as air temperature, precipitation, potential evapotranspiration and their values in warm and cold seasons, were discussed. The result suggests that temperature increasing is the main reason for the accelerated melting of glaciers. Lake expansion is mainly induced by the increase of the glacier melting water, increase of precipitation and obvious decrease of potential evapotranspiration. Precipitation, evaporation and their linkages with lake enlargement on regional scale need to be thoroughly studied under the background of global warming and glacier retreating.
|
| [13] |
纳木错流域冰川和湖泊变化对气候变化的响应 [J].https://doi.org/10.3969/j.issn.1008-2786.2009.06.001 URL [本文引用: 1] 摘要
利用纳木错流域及其周边地区气象资料、地形图、遥感资料以及野外实地观测资料,对该流域过去37年来气候变化特征以及冰川、湖泊变化过程进行了分析。结果表明,自1970年以来,纳木错区域气温上升趋势明显,其中冬季升温幅度高于夏季;降水量变化冬、夏两季均呈增加趋势,但冬季增加量不显著。在整体升温的背景下,纳木错流域冰川整体呈退缩趋势。1970~2007年间,流域内冰川面积减少37.1km2,占流域冰川面积的18.2%,年变化率为-1.0km2/a。流域内扎当冰川和拉弄冰川末端GPS观测表明,1970~2008年间冰川末端分别退缩381.8m和489.5m,年均退缩量为10.3m和13.4m。1970~2007年间,纳木错湖面积增加了72.6km2,增加速率为2.0km2/a。1970~1991年、1991~2000年和2000~2007年三个阶段的年增加速率不断增大,分别为1.1、2.8、3.4km2/a;湖泊水位在夏季升高非常显著,与湖泊面积的扩张是一致的。
Glaciers and lake change in response to climate change in the Nam Co basin, Tibet .https://doi.org/10.3969/j.issn.1008-2786.2009.06.001 URL [本文引用: 1] 摘要
利用纳木错流域及其周边地区气象资料、地形图、遥感资料以及野外实地观测资料,对该流域过去37年来气候变化特征以及冰川、湖泊变化过程进行了分析。结果表明,自1970年以来,纳木错区域气温上升趋势明显,其中冬季升温幅度高于夏季;降水量变化冬、夏两季均呈增加趋势,但冬季增加量不显著。在整体升温的背景下,纳木错流域冰川整体呈退缩趋势。1970~2007年间,流域内冰川面积减少37.1km2,占流域冰川面积的18.2%,年变化率为-1.0km2/a。流域内扎当冰川和拉弄冰川末端GPS观测表明,1970~2008年间冰川末端分别退缩381.8m和489.5m,年均退缩量为10.3m和13.4m。1970~2007年间,纳木错湖面积增加了72.6km2,增加速率为2.0km2/a。1970~1991年、1991~2000年和2000~2007年三个阶段的年增加速率不断增大,分别为1.1、2.8、3.4km2/a;湖泊水位在夏季升高非常显著,与湖泊面积的扩张是一致的。
|
| [14] |
|
| [15] |
念青唐古拉山西段冰川1977-2010年时空变化 [J].https://doi.org/10.3799/dqkx.2012.115 URL [本文引用: 1] 摘要
青藏高原现代冰川变化是对气候 变化的响应,对区域水资源评估有着重要的理论意义和现实意义.采用GIS分析方法,利用三期卫星遥感数据研究青藏高原中部念青唐古拉山西段冰川在2个时间 段(1977-2001和2001-2010)的时空分布和变化,并对比分析其在南坡和北坡变化速率趋势以及在不同海拔高度的变化特征.研究发现: (1)2010年念青唐古拉山西段冰川面积为571.81±16.01km2,主要分布在5500~6200m的高山区;(2)1977-2010年念青 唐古拉山西段冰川退缩明显,总面积减少22.42%±2.90%;(3)相比于1977-2001年时间段,近十年来该区冰川退缩速率呈明显加剧趋势; (4)与前一个时段相比,低于5700m海拔区域,各海拔段的冰川年均面积退缩速率呈减缓趋势;而在5700~7000m海拔区域,则呈加剧趋势;(5) 北坡冰川退缩率(23.6%±2.88%)高于南坡(21.97%±2.90%),且南北坡2001-2010年年均冰川面积减少最大的海拔段比 1977-2001年都升高了200m,研究区冰川的持续退缩有向高海拔转移的趋势;(6)南坡拉萨河流域内的冰川年均减少面积最大的海拔段比北坡高 100m左右.气温升高是影响近十年以来研究区的冰川退缩加剧的根本原因,将对区域水文和生态环境产生重大的影响.
Glacier temporal-spatial change characteristics in western Nyainqentanglha range, Tibetan Plateau 1977-2010.Earth Science-Journal of China University of https://doi.org/10.3799/dqkx.2012.115 URL [本文引用: 1] 摘要
青藏高原现代冰川变化是对气候 变化的响应,对区域水资源评估有着重要的理论意义和现实意义.采用GIS分析方法,利用三期卫星遥感数据研究青藏高原中部念青唐古拉山西段冰川在2个时间 段(1977-2001和2001-2010)的时空分布和变化,并对比分析其在南坡和北坡变化速率趋势以及在不同海拔高度的变化特征.研究发现: (1)2010年念青唐古拉山西段冰川面积为571.81±16.01km2,主要分布在5500~6200m的高山区;(2)1977-2010年念青 唐古拉山西段冰川退缩明显,总面积减少22.42%±2.90%;(3)相比于1977-2001年时间段,近十年来该区冰川退缩速率呈明显加剧趋势; (4)与前一个时段相比,低于5700m海拔区域,各海拔段的冰川年均面积退缩速率呈减缓趋势;而在5700~7000m海拔区域,则呈加剧趋势;(5) 北坡冰川退缩率(23.6%±2.88%)高于南坡(21.97%±2.90%),且南北坡2001-2010年年均冰川面积减少最大的海拔段比 1977-2001年都升高了200m,研究区冰川的持续退缩有向高海拔转移的趋势;(6)南坡拉萨河流域内的冰川年均减少面积最大的海拔段比北坡高 100m左右.气温升高是影响近十年以来研究区的冰川退缩加剧的根本原因,将对区域水文和生态环境产生重大的影响.
|
| [16] |
Different region climate regimes and topography affect the changes in area and mass balance of glaciers on the north and south slopes of the same glacierized massif (the West Nyainqentanglha Range, Tibetan Plateau) [J].https://doi.org/10.1016/j.jhydrol.2013.04.034 URL [本文引用: 3] 摘要
ABSTRACT This project launched a comparative study to investigate the areas of the Zhadang glacier (on the leeward slope/north slope of the West Nyainqentanglha Range, Tibetan Plateau) and the Gurenhekou glacier (on the windward slope/south slope) for nearly 40 years (1970–2007) and measure the mass balance of the two glaciers for three (2005–2008) and four (2004–2008) mass balance years, respectively. Results show that, in 1970–2007, overall annual precipitation decreased slightly caused by the weakening Indian monsoon and strengthened westerlies and annual mean air temperatures increased gradually in the areas to the north and south of the West Nyainqentanglha Range, respectively, resulting in the areas of the two glaciers reduced over the last nearly four decades. The rate of air temperature increase in the north is higher than that in the south. Moreover, mean annual precipitation in the south exceeds that in the north, due to the weakening of the Indian Monsoon activities across the West Nyainqentanglha Range. As a result, the area decrease of Zhadang glacier in the north slope of the West Nyainqentanglha Range is more intensive than that of Gurenhekou glacier in the south slope. Results also show that these two small glaciers experienced gradual reduction of the mass loss during the observation period of 2005–2008 and 2004–2008, and exhibited positive mass balances in 2008, possibly resulting from increases of annual precipitation and decreases in mean annual air temperatures, especially the lowering of air temperatures and the notably increasing of precipitation during the ablation period in 2006–2008. However, the mass balances of the two glaciers differed considerably. The differences in mass balance between the glaciers appear closely related to local climatic factors (different local moisture recycling and different seasonal distributions of precipitation) and glacier topography (the leeward/windward slopes and different elevations of the accumulation and ablations zones). Interestingly, the mass balances in the final year of our study period (2007/2008) for these two glaciers are much more similar, although they differed during the first year (2005/2006), resulting from differences between their annual precipitation trends. Observations indicate that changes in either the air temperature or precipitation will drive mass balance changes for the two glaciers, and the changes in the mass balance will directly affect the local water resource. These findings will provide important data for hydrological modelling of glacierized catchments and local water resource management strategies.
|
| [17] |
1970-2000年念青唐古拉山脉西段冰川变化 [J].Magsci 摘要
<FONT face=Verdana>运用多光谱遥感资料监测冰川变化已成为冰川研究的有效数据源, 分析了念青唐古拉山脉西段念青唐古拉山峰区1970年冰川及Landsat ETM+(2000)解绎的冰川分布.结果显示, 念青唐古拉山峰区共有870条冰川, 30a来冰川面积减小了5.7%,冰储量减少了7%;其中,冰川面积1-5km2的冰川退缩的贡献最大,占总面积退缩量的56.7%. 念青唐古拉山东南坡与西北坡的退缩幅度稍有不同,东南坡冰川面积减少了5.2%,西北坡冰川面积减少了6.9%. 西北坡的拉弄冰川长度减少了(305±36) m,年退缩率为(10.2±1.2)m<FONT face=Verdana><I>&#</I>8226;</FONT>a<SUP>-1</SUP>,面积退缩为2.6%. 当雄气象站的资料表明,冰川退缩主要受温度持续上升的影响,尤其是1985年以来的温度快速上升的影响. 对处于西北坡冰川体积变化分析表明,冰川体积减少可能是导致纳木错湖水位上升、水量增加的重要因素. </FONT>
Variation of glaciers in the western Nyainqentanglha range of Tibetan Plateau during 1970-2000 .Magsci 摘要
<FONT face=Verdana>运用多光谱遥感资料监测冰川变化已成为冰川研究的有效数据源, 分析了念青唐古拉山脉西段念青唐古拉山峰区1970年冰川及Landsat ETM+(2000)解绎的冰川分布.结果显示, 念青唐古拉山峰区共有870条冰川, 30a来冰川面积减小了5.7%,冰储量减少了7%;其中,冰川面积1-5km2的冰川退缩的贡献最大,占总面积退缩量的56.7%. 念青唐古拉山东南坡与西北坡的退缩幅度稍有不同,东南坡冰川面积减少了5.2%,西北坡冰川面积减少了6.9%. 西北坡的拉弄冰川长度减少了(305±36) m,年退缩率为(10.2±1.2)m<FONT face=Verdana><I>&#</I>8226;</FONT>a<SUP>-1</SUP>,面积退缩为2.6%. 当雄气象站的资料表明,冰川退缩主要受温度持续上升的影响,尤其是1985年以来的温度快速上升的影响. 对处于西北坡冰川体积变化分析表明,冰川体积减少可能是导致纳木错湖水位上升、水量增加的重要因素. </FONT>
|
| [18] |
纳木错流域近30年来湖泊——冰川变化对气候的响应 [J].
<p>利用1970 航测地形图和1991、2000 年两期卫星影像数据, 人工建立数字高程模型 (DEM), 解译不同时期的湖泊、冰川边界, 在GIS 技术支持下采用图谱的方法, 定量分析了 湖泊、冰川的面积变化情况。结果表明, 自1970~2000 年期间, 纳木错湖面面积从1941.64 km<sup>2</sup> 增加到1979.79 km<sup>2</sup>, 增加的速率为1.27 km<sup>2</sup>/a; 流域内冰川的面积从167.62 km<sup>2</sup> 减少到141.88 km<sup>2</sup>, 退缩速率为0.86 km<sup>2</sup>/a。其中, 湖面面积在1991~2000 年的增加速率为1.76 km<sup>2</sup>/a, 明显大于其在1970~1991 年的1.03 km<sup>2</sup>/a; 而冰川面积在1991~2000 年的退缩速率为 0.97 km<sup>2</sup>/a, 明显大于其在1970~1991 年的0.80 km<sup>2</sup>/a。对比该流域前后两个时期的气温、降水和蒸发变化, 发现升温幅度的增加是冰川加速退缩的根本原因, 而湖面的加速扩张主要受冰川的加剧退缩及其引起的融水增加影响, 但与区域降水量略微增加和蒸发量显著减少也具有密切联系。区域降水增加和蒸发减少及其与湖面扩张之间的内在联系仍是一个需要深入探讨的问题。</p>
The response of lake-glacier area change to climate variations in Nam Co basin, central Tibetan Plateau, during the last three decades .
<p>利用1970 航测地形图和1991、2000 年两期卫星影像数据, 人工建立数字高程模型 (DEM), 解译不同时期的湖泊、冰川边界, 在GIS 技术支持下采用图谱的方法, 定量分析了 湖泊、冰川的面积变化情况。结果表明, 自1970~2000 年期间, 纳木错湖面面积从1941.64 km<sup>2</sup> 增加到1979.79 km<sup>2</sup>, 增加的速率为1.27 km<sup>2</sup>/a; 流域内冰川的面积从167.62 km<sup>2</sup> 减少到141.88 km<sup>2</sup>, 退缩速率为0.86 km<sup>2</sup>/a。其中, 湖面面积在1991~2000 年的增加速率为1.76 km<sup>2</sup>/a, 明显大于其在1970~1991 年的1.03 km<sup>2</sup>/a; 而冰川面积在1991~2000 年的退缩速率为 0.97 km<sup>2</sup>/a, 明显大于其在1970~1991 年的0.80 km<sup>2</sup>/a。对比该流域前后两个时期的气温、降水和蒸发变化, 发现升温幅度的增加是冰川加速退缩的根本原因, 而湖面的加速扩张主要受冰川的加剧退缩及其引起的融水增加影响, 但与区域降水量略微增加和蒸发量显著减少也具有密切联系。区域降水增加和蒸发减少及其与湖面扩张之间的内在联系仍是一个需要深入探讨的问题。</p>
|
| [19] |
Estimation on the response of glaciers in China to the global warming in the 21st century [J].https://doi.org/10.1007/BF02886048 URL 摘要
正 Glaciers in China can be categorized into 3 types, i.e. the maritime (temperate) type, sub-continental (sub-polar) type and extreme Continental (polar) type, which take 22%, 46% and 32% of the total existing glacier area (59 406 km2) respectively. Researches indicate that glaciers of the three types show different response patterns to the global warming. Since the Maxima of the Little Ice Age (the 17th century), air temperature has risen at a magnitude of 1.3℃on average and the glacier area decreased corresponds to 20% of the present total glacier area in western China. it is estimated that air temperature rise in the 2030s, 2070s and 2100s will be of the order of 0.4-1.2, 1.2-2.7 and 2.1-4.0 K in western China. With these scenarios, glaciers in China will suffer from further shrinkage by 12%, 28% and 45% by the 2030s, 2070s and 2100s. The uncertainties may account for 30%-67% in 2100 in China.
|
| [20] |
Early onset of rainy season suppresses glacier melt: a case study on Zhadang glacier, Tibetan Plateau [J].https://doi.org/10.3189/002214309789470905 URL 摘要
The article presents a case study on the effect of early onset of rainy season to the melting rate of Zhadang glacier in Tibetan Plateau, China. It observes the seasonal influence of precipitation on the mass balance of glacier for a Tibetan glacier. The study suggests that early rainy season causes the low level of temperatures in 2008 compared with 2007.
|
| [21] |
Analysis of glacier facies using satellite techniques [J]. |
| [22] |
Snow and ice studies by Thematic Mapper and multispectral scanner Landsat images [J].https://doi.org/10.3198/1987AoG9-1-109-118 URL [本文引用: 1] 摘要
Digitally enhanced Landsat Thematic Mapper (TM) images of Antarctica reveal snow and ice features to a detail never seen before in satellite images. The six TM reflective spectral bands have a nominal spatial resolution of 30 m, compared to 80 m for the Multispectral Scanner (MSS). TM bands 2鈥4 are similar to the MSS bands. TM infra-red bands 5 and 7 discriminate better between clouds and snow than MSS or the lower TM bands. They also reveal snow features related to grain-size and possibly other snow properties. These features are not observed in the visible wavelengths. Large features such as flow lines show best in the MSS and lower TM bands. Their visibility is due to photometric effects on slopes. TM thermal band 6 has a resolution of 120 m. It shows ground radiation temperatures and may serve to detect liquid water and to discriminate between features having similar reflectivities in the other bands, such as blue ice.Repeated Landsat images can be used for sophisticated glaciological studies. By comparing images from 1975 and 1985, flow rates averaging 0.72 km a, and mean longitudinal and transverse strains of respectively 1.3 脳 10 a and 130 脳 10ahave been measured for Jutulstraumen, Dronning Maud Land.
|
| [23] |
ERTS data in glaciology--an effort to monitor glacier mass balance from satellite imagery [J].https://doi.org/10.3198/1975JoG15-73-403-415 URL [本文引用: 1] 摘要
Due to increased demand for electric energy, which in Norway is produced almost entirely by hydro-electric power plants, extensive glacierized basins are now considered for future power production, However, glacier behaviour has a great impact on the annual run-off from these basins, and information about expected annual deviations from a “normal” discharge must be obtained from mass-balance studies on representative glaciers within the basin. For this reason such studies are presently performed at eight selected Norwegian glaciers; the costs involved are in the order of $3 000-$10 000 annually for each observed glacier.The transient snow line can be identified easily on conventional air photographs and its height determined by direct comparisons with reliable topographie maps (with contour lines on glaciers). The resolution in ERTS images is sufficiently good to use the satellite data for a similar height determination of the transient snow line on glaciers—at least on the larger valley glaciers and, of course, on ice caps.Due to an existing correlation between the height of the transient snow line (at the end of the melt season) and the annual specific net mass balance, it is possible to construct a diagram expressing this relationship, provided detailed mass-balance studies have been performed during a period of several years of different mass-balance conditions (ideally comprising both years of negative and of positive net balances). Determinations of the transient snow-line height based upon ERTS data, obtained at the end of the summer season, can then be used to determine the mass balance for those glaciers where the above-mentioned relationship is established. This would be a great advantage in cases where there is a request for information on the net balance only; no separate data on winter balance or summer balance will be obtained by this method.Experiments have been performed to delineate the transient snow line on glaciers directly from ERTS digital data (CCT magnetic tape). The results indicate that last winter’s snow is characterized by grey-levels 41-48 (of 63 possible grey-scale levels) on MSS-7, whereas exposed glacier ice is represented by levels 13—20 in the same multi-spectral band. Snow and ice can also be separated on MSS-4, but the difference in grey-scale levels between the two materials is much smaller.
|
| [24] |
|
| [25] |
Summary of current radiometric calibration coefficients for Landsat MSS, TM, ETM+, and EO-1 ALI sensors [J].https://doi.org/10.1016/j.rse.2009.01.007 URL [本文引用: 1] 摘要
This paper provides a summary of the current equations and rescaling factors for converting calibrated Digital Numbers (DNs) to absolute units of at-sensor spectral radiance, Top-Of-Atmosphere (TOA) reflectance, and at-sensor brightness temperature. It tabulates the necessary constants for the Multispectral Scanner (MSS), Thematic Mapper (TM), Enhanced Thematic Mapper Plus (ETM+), and Advanced Land Imager (ALI) sensors. These conversions provide a basis for standardized comparison of data in a single scene or between images acquired on different dates or by different sensors. This paper forms a needed guide for Landsat data users who now have access to the entire Landsat archive at no cost.
|
| [26] |
Glacial areas, lake areas, and snow lines from 1975 to 2012: status of the Cordillera Vilcanota, including the Quelccaya Ice Cap, northern central Andes, Peru [J].https://doi.org/10.5194/tc-8-359-2014 Magsci [本文引用: 1] 摘要
Glaciers in the tropical Andes of southern Peru have received limited attention compared to glaciers in other regions (both near and far), yet remain of vital importance to agriculture, fresh water, and hydropower supplies of downstream communities. Little is known about recent glacial-area changes and how the glaciers in this region respond to climate changes, and, ultimately, how these changes will affect lake and water supplies. To remedy this, we have used 158 multi-spectral satellite images spanning almost 4 decades, from 1975 to 2012, to obtain glacial-and lake-area outlines for the understudied Cordillera Vilcanota region, including the Quelccaya Ice Cap. Additionally, we have estimated the snow-line altitude of the Quelccaya Ice Cap using spectral unmixing methods. We have made the following four key observations: first, since 1988 glacial areas throughout the Cordillera Vilcanota (1988 glacial area: 361 km(2)) have been declining at a rate of 3.99 +/- 1.15 km(2) yr(-1) (22 year average, 1988-2010, with 95% confidence interval (CI), n = 8 images). Since 1980, the Quelccaya Ice Cap (1980 glacial area: 63.1 km(2)) has been declining at a rate of 0.57 +/- 0.10 km(2) yr(-1) (30 year average, 1980-2010, with 95% CI, n = 14). Second, decline rates for individual glacierized regions have been accelerating during the past decade (2000-2010) as compared to the preceding decade (1988-1999) with an average increase from 37.5 to 42.3 x 10(-3) km(2) yr(-1) km(-2) (13 %). Third, glaciers with lower median elevations are declining at higher rates than those with higher median elevations. Specifically, glaciers with median elevations around 5200 ma.s.l. are retreating to higher elevations at a rate of similar to 1myr(-1) faster than glaciers with median elevations around 5400 ma.s.l. Fourth, as glacial regions have decreased, 77% of lakes connected to glacial watersheds have either remained stable or shown a roughly synchronous increase in lake area, while 42% of lakes not connected to glacial watersheds have declined in area (58% have remained stable). Our new and detailed data on glacial and lake areas over 37 years provide an important spatiotemporal assessment of climate variability in this area. These data can be integrated into further studies to analyze inter-annual glacial and lake-area changes and assess hydrologic dependence and consequences for downstream populations.
|
| [27] |
Energy and mass balance of Zhadang glacier surface, central Tibetan Plateau [J].https://doi.org/10.3189/2013JoG12J152 URL [本文引用: 1] 摘要
Abstract Climate variables that control the annual cycle of the surface energy and mass balance on Zhadang glacier in the central Tibetan Plateau were examined over a 2 year period using a physically based energy-balance model forced by routine meteorological data. The modelled results agree with measured values of albedo, incoming longwave radiation, surface temperature and surface level of the glacier. For the whole observation period, the radiation component dominated (82%) the total surface energy heat fluxes. This was followed by turbulent sensible (10%) and latent heat (6%) fluxes. Subsurface heat flux represented a very minor proportion (2%) of the total heat flux. The sensitivity of specific mass balance was examined by perturbations of temperature (卤1 K), relative humidity (卤20%) and precipitation (卤20%). The results indicate that the specific mass balance is more sensitive to changes in precipitation than to other variables. The main seasonal variations in the energy balance were in the two radiation components (net shortwave radiation and net longwave radiation) and these controlled whether surface melting occurred. A dramatic difference in summer mass balance between 2010 and 2011 indicates that the glacier surface mass balance was closely related to precipitation seasonality and form (proportion of snowfall and rainfall).
|
| [28] |
纳木错流域扎当冰川径流对气温和降水形态变化的响应 [J].
<p>报道西藏纳木错湖南岸念青唐古拉山脉北坡扎当冰川2007/2008年的径流年际大变化并分析其成因. 与2007年夏半年相比, 2008年同期降水量增加了17.9%, 流域径流量却减少了33.3%, 由此得出冰川消融量减少了53.8%. 利用通常的度日模型分析发现, 大气正积温的变化只能解释约一半的冰川消融量年际差, 说明该冰川对气温变化异常敏感. 能量平衡分析显示, 冰川表面反照率的改变造成了冰川消融量的年际重大差异. 而反照率的改变主要是由降水形态的差异造成的. 统计得出, 2007年夏半年冰川末端以降雨为主, 降雨量占降水总量的71.5%; 相反, 2008年以降雪为主, 降雨量仅占30.7%. 说明在对某些冰川进行气候变化的敏感性分析或径流预测时, 降水形态是需要单独考虑的一个因素.</p>
Response of Zhadang glacier runoff in Nam Co basin,Tibet,to changes in air temperature and precipitation form .
<p>报道西藏纳木错湖南岸念青唐古拉山脉北坡扎当冰川2007/2008年的径流年际大变化并分析其成因. 与2007年夏半年相比, 2008年同期降水量增加了17.9%, 流域径流量却减少了33.3%, 由此得出冰川消融量减少了53.8%. 利用通常的度日模型分析发现, 大气正积温的变化只能解释约一半的冰川消融量年际差, 说明该冰川对气温变化异常敏感. 能量平衡分析显示, 冰川表面反照率的改变造成了冰川消融量的年际重大差异. 而反照率的改变主要是由降水形态的差异造成的. 统计得出, 2007年夏半年冰川末端以降雨为主, 降雨量占降水总量的71.5%; 相反, 2008年以降雪为主, 降雨量仅占30.7%. 说明在对某些冰川进行气候变化的敏感性分析或径流预测时, 降水形态是需要单独考虑的一个因素.</p>
|

/
| 〈 |
|
〉 |


