大连海事大学交通运输管理学院,辽宁 大连 116026
中图分类号: F562.3
文献标识码: A
文章编号: 1000-0690(2016)03-0335-07
收稿日期: 2015-03-9
修回日期: 2015-07-19
网络出版日期: 2016-03-20
版权声明: 2016 《地理科学》编辑部 本文是开放获取期刊文献,在以下情况下可以自由使用:学术研究、学术交流、科研教学等,但不允许用于商业目的.
基金资助:
作者简介:
褚艳玲(1976-),女,黑龙江绥化人,讲师,博士研究生,主要从事交通运输规划与管理及物流网络优化研究。E-mail:
展开
摘要
基于标准差椭圆和空间基尼系数,利用2001~2012年机场和航段的数据对中国航空货运空间变化特征进行分析,为制定航空货运产业发展战略和优化航空货运网络布局提供决策参考。结果表明:① 航空货运的空间格局和经济格局分布一致,航空货运中心由东南沿海地区向西北内陆方向移动;② 航空货运网络由混合式网络向轴辐式枢纽网络转化,由单一机场枢纽发展形成了京津、沪杭、广深和成渝4个组合枢纽;③ 航空货运在机场和航段上分布趋于分散;④ 航空货运主通道集中了30%以上的运输量。
关键词:
Abstract
The domestic express market in China expands quickly since 2000. Air cargo transportation industry becomes a new growth point in China civil aviation transportation industry. In 2012, China civil aviation cargo turnover volume is 57.44×10⁸ tn-km, second behind US in the world. China air transportation varies from both time and space with the international air freight transportation market change and domestic air freight transportation rise. Air freight transportation is a very important part of air transportation and flight network is its spatial carrier to provide air transport service. Illustration of China air transportation feature and its spatial pattern to both air freight transportation industry and aviation industry will contribute to formulate aviation industry development strategy, which has a very important theoretical significance and practical value to China air freight transportation industry development and airline network layout optimization. The air transportation and its spatial pattern are the important topics in air transport field in China. Currently concerning studies are mainly focusing on the passenger traffic. Thus, this paper analyzes the spatial pattern and temporal evolution of air cargo transportation in China based on SDE and Spatial Gini index. SDE is used to describe temporal process of the element spatial distribution. Spatial Gini index is used to measure element concentration in network. With domestic airport and flight segment data from 2001 to 2012, this paper calculates SDE and Spatial Gini index to describe China air cargo transportation and its spatial pattern. The result shows: 1) The spatial pattern of the air cargo transportation is consistent with the economic pattern, mainly concentrating in Shanghai and Hangzhou—the core of Changjiang River Delta, Guangzhou and Shenzhen—the core of Zhujiang River Delta, Beijing and Tianjin—the core of Beijing and Tianjin District, as well as developed areas in western China, (e.g.) Chengdu and Chongqing). China flight transport center is moving to the northwest inland region from the southeast coastal areas; 2) Four combination airports (e.g. Beijing/Tianjin, Shanghai/Hangzhou, Guangzhou/Shenzhen and Chengdu/Chongqing) replace Beijing, Shanghai and Guangzhou and become four highly concentrated regional air freight transport combination hubs. Air freight network is changing from coexistence hybrid network (point-to-point structure, hub-and-spoke hub structure) to hub-and-spoke network. 3) The air cargo at the airports and flight segments tends to disperse, and its volume on hub airports and main routes reduces slowly year on year. Regional airports and branch flight segments undertake more and more air cargo. 4) The air cargo transportation main corridors are established between four combination hubs. On those corridors, the total air cargo volume reduces from 47.04% in 2001 to 30.91% in 2012.
Keywords:
经济增长、管制放松、竞争加剧等都促进了航空运输的快速发展[1],使得航空运输和航线网络成为国内外研究的热点。航线网络是提供航空运输服务的空间载体,航空货运是航空运输的重要组成部分。国外研究从宏观角度分析了世界、欧洲、北美航线网络的特点和航空运输空间演化过程[2~8],从微观角度分析了航空公司航空货运网络的特点并提出网络设计方法[9~12]。随着中国国内快递市场迅速扩张,航空货运快速发展,逐步引起了学者的关注。国内学者发现中国航空货运网络已发展到点对点结构和轴辐式枢纽结构并存的混合模式,网络通达性越来越高,并确定未来中国10个枢纽机场的布局[13~16];航空网络具有“无标度”特征的“小世界网络”演变趋势[17, 18];航空货运模式以拥有全货机且客机腹舱兼营货运的航空公司为主[19~21]。现有研究多集中在航空货运网络和服务模式方面,对中国航空货运空间分布及变化展开的动态研究较少。本文试图运用标准差椭圆和空间基尼系数相结合的方法,定量识别并以空间可视化的方式刻画中国航空货运空间变化整体特征,从多重角度揭示21世纪以来中国航空货运空间变化过程,有助于制定航空产业发展战略,对促进中国航空货运业发展和优化航线网络布局具有重要理论意义和实用价值。
以中国境内(不含香港、澳门和台湾地区的机场)2001~2012年经营的民用航空机场和航段为研究对象,合并同城机场(具体如:浦东+虹桥机场=上海机场,首都+南苑=北京机场)。机场经纬度数据来自中国地图出版社,2001~2012年机场和航段数据来源于《从统计看民航(2002~2013)》[22]。
1.2.1 标准差椭圆
标准差椭圆(Standard deviational ellipse,SDE)最早在1926年由Lefever提出,用于揭示地理要素的空间分布特征[23],之后被广泛用于空间统计领域。随着GIS技术的发展,基于地理信息的SDE方法已成为空间统计模块的常规统计工具[24, 25]。SDE能够从多重角度反映要素空间分布的整体性特征[26],其中SDE中心反映要素空间分布整体在二维空间上的相对位置;长轴方向反映其在二维空间上展布的主趋势方向,这种趋势是通过转角体现的,即从标准差椭圆的顶点开始按顺时针进行测量的长轴的旋转角度;长轴长度表征要素空间分布在主要方向上偏离中心的程度,短轴长度代表其在次要方向上偏离中心的程度,长、短轴长度的比值体现要素空间分布的形态。在一定的时间尺度上,要素空间分布变化的时空过程可以通过SDE方法来刻画。要素空间分布的中心、展布范围、方向和形态随时间变化具有不同的动态特征,这就为描述航空货运空间变化过程提供了参考标准。本文基于2001~2012年中国机场的空间区位(经纬度),以机场年货邮吞吐量为相应权重,计算不同时间航空货运空间分布的标准差椭圆。
1.2.2 空间基尼系数
Krugman[27]等将洛伦茨曲线和基尼系数用于衡量产业在空间上的分布均衡程度,构建了空间基尼系数(Spatial Gini index)。空间基尼系数介于0到1之间,某产业在空间上的分布越均匀,该产业的空间基尼系数就越小,当空间基尼系数等于0时,说明产业呈均匀分布状态。反之,产业在空间上分布越集中,其空间基尼系数越大,当空间基尼系数等于1时,说明产业都集中在某一个地区。
Reynolds-Feighan[28, 29]把空间基尼系数引入到航空运输网络中,用来衡量网络中要素的集中度,空间基尼系数[2]被定义为:

式中,i、j为网络中的节点,yi为第i个节点或边的权重,
空间基尼系数的最大值[2]为:
本文分别把机场的年货邮吞吐量作为节点的权重、航段的年货邮运输量作为边的权重,计算空间基尼系数。此时空间基尼系数越小,表明货运空间分布越均匀,当空间基尼系数为0时,货运在各个机场和航段上均匀分布。空间基尼系数越大,表明货运空间分布越集中,当空间基尼系数等于1时,所有货运都集中在一个机场或一个航段上。
空间基尼系数随n的增加而增大,因此需要对空间基尼系数进行改进,以剔除n对系数的影响,这里借鉴Burghouwt[2]的研究,引入NC(network concentration)系数
NC系数介于0~1之间,当介于0.05~0.35之间时,对应的网络为点对点式的网络,当介于0.75~1.0之间时,对应的网络为轴辐式枢纽网络,当介于0.35~0.75之间时,对应的网络为点对点结构和轴辐式枢纽结构共存的混合式网络[2]。NC系数的大小也揭示了网络中枢纽机场的数量,当介于0.7~0.8之间时,网络中有2~4个枢纽机场[2]。
2001~2012年,中国民用机场数量由139个增至183个,同期货邮吞吐量从339.3万t增至1 157.8万t;2012年货邮吞吐量在万t以上机场有49个,较2001年增加了16个,其总吞吐量占全国总量的比例由97.71%提高到98.46%,说明航空货邮主要集中在万吨以上的大型机场;2001~2012年,前20位机场的吞吐量之和占全国总量的比重变化不大,在90%左右,其中青岛、长沙和郑州取代福州、石家庄和太原进入前20名;20个机场中货邮吞吐量年均增长率最高的是天津,为16.41%,最低的是海口,为5.74%[22]。
2002年2月,中国民航总局将全国的民航业划分为七大地区航空管理局,分别为华北区、华东区、中南区、东北区、西南区、西北区和新疆区。
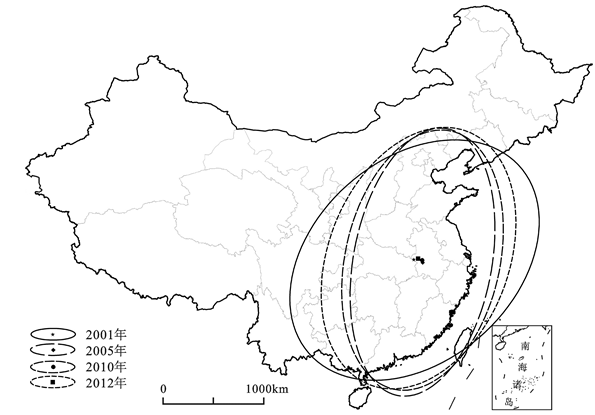
2001~2012年中国机场货邮空间分布的标准差椭圆如图1。
图1 2001~2012年中国机场货邮分布标准差椭圆
Fig.1 SDE of airport cargo distribution in China in 2001-2012
2.1.1 货运中心由东南沿海向西北内陆方向移动
标准差椭圆的中心坐标空间移动轨迹如图1。2001~2005年中心坐标由(115.66°E,31.29°N)移动到(116.63°E,31.02°N),中心总位移为112.47 km,其中向东移动108.35 km,向南移动30.16 km,总体呈现向东南移动的趋势。这个时期东南沿海地区的航空货运发展速度高于其他地区;2005~2010年,中心向西北移动了24.73 km,2010~2012年继续向西北移动了52.64 km。中心从2005年开始离开东部海岸线,向西北方向移动,表明中西部航空货运的增长速度变快,货运中心由沿海向内陆方向移动,国内市场对航空货运拉动作用增强。中国社科院的研究也表明2008~2011年中西部地区和东北地区经济增长速度超过了东部地区[26]。
2.1.2 京津地区和中西部地区航空货运发展速度加快
2001~2005年,标准差椭圆的长轴呈顺时针转动,转角由25.82°增加到74.33°,表明华东区货邮吞吐量比重上升,同期中南和华北区比重下降,相对于京津冀地区和中西部地区,东南沿海地区航空货运发展速度更快。2005~2010年标准差椭圆的长轴呈现逆时针转动,转角由74.33°缩小到69.32°,表明该时期华东区货邮吞吐量比重下降,中南、华北和西南比重上升。2010~2012年标准差椭圆的长轴继续呈逆时针转动,转角由69.32°缩小到53.24°,表明此时京津地区和中西部地区航空货运的发展加快,结论与图2的统计结果一致。
2.1.3 航空货邮在主要方向和次要方向上均远离中心
2001~2005年短轴与长轴的比值由0.77变为0.72,呈现减小的趋势,2005~2012年短轴与长轴的比值由0.72变为0.88,呈现增大趋势。2001~2005年SDE在西南-东北方向上呈收缩趋势(长轴减短),在东南-西北方向上也有收缩趋势(短轴减短),表明在该期间中国航空货运分布在主要方向和次要方向上越来越趋向中心。2005~2012年SDE在西南-东北方向上有扩张趋势(长轴增长),在东南-西北方向上有扩张趋势(短轴增长),表明该时期中国航空货运分布在主要方向和次要方向远离中心。
2.1.4 航空货邮分布呈现先集中后分散的趋势
2001~2005年标准差椭圆面积由1 125 629.02 km2减小到746 014.87 km2,表明货运分布趋于集中,前20位机场货邮吞吐量占比由88.76%增加到90.86%。到2012年椭圆面积增加到969 921.64 km2,表明货运分布趋向分散,统计前20位机场货邮吞吐量占比由90.86%下降到87.798%。标准差椭圆囊括了中国航空货运网络中的主要机场。
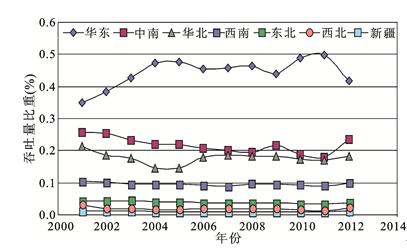
把七大区域里每个区域机场数据进行合并得到7个区域的机场货邮量分布及变化情况如图2所示。2012年华东区货邮比重最高为41.7%,其次排名为中南、华北、西南、东北、西北和新疆区,华北、华东和中南区集中了货邮吞吐量的83.2%,是航空货邮运输的主要出发地和目的地。2001~2012年,7个区域货邮吞吐量平均年增长率为14.29%,排名没有变化,华东地区占绝对优势。2001~2005年,华东地区吞吐量占比上升,中南和华北地区占比下降;2005~2012年,华东地区占比下降,中南和华北地区占比上升。
图2 2001~2012年中国分区域货邮吞吐量占比变化
Fig.2 Ratio of 7 region’s airport freight volume in 2001-2012
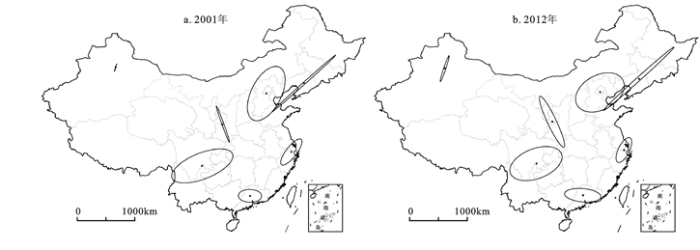
分别对每个区域机场进行标准差椭圆分析得到图3,分析结果表明:① 2001~2012年,7个标准差椭圆的中心只有微小的变化,华东、中南、华北和西南地区的标准差椭圆的中心分别位于上海杭州、广州深圳、北京天津、成都重庆之间,这表明上海/杭州、广州/深圳、北京/天津、成都/重庆分别为华东、中南、华北和西南区内货运分布的中心。
② 2001~2012年,华东和西南区标准差椭圆面积减小,表明华东区机场货邮越来越集中在上海和杭州,而西南区则集中在成都和重庆;中南、华北、东北、西北和新疆区的面积增大,表明他们内部机场货运从干线机场向支线机场转移。
图3 2001~2012年中国七大区域机场货邮分布标准差椭圆
Fig.3 SDE of airport cargo distribution in seven regions in 2001-2012
基于公式(1)~(3)计算得到2001~2012年机场货邮吞吐量分布的空间基尼系数和NC系数(图4),具体分析如下:① 2001~2005年,空间基尼系数和NC系数逐渐变大,表明航空货运分布越来越集中在少数大型机场。其中北京、上海、广州货邮吞吐量占总吞吐量的比重由54.58%上升到56.86%,北京-天津、上海-杭州、广州-深圳、成都-重庆4组机场货邮吞吐量比重由70.2%上升到73.37%。2005~2012年,空间基尼系数和NC系数逐年变小,航空货运集中速度变缓,北、上、广三大机场占的比重下降到53.75%,航空货运由集中在北、上、广三大机场向周围机场扩散,北京-天津、上海-杭州、广州-深圳、成都-重庆4组机场货邮吞吐量比重上升到74.37%。② 2012年NC系数为0.711,网络中有181个机场,说明网络处于大型枢纽网络的边缘,网络中有3~4个枢纽。结合标准差椭圆分析结果,可以判定北京-天津、上海-杭州、广州-深圳和成都-重庆4组机场取代北京、上海、广州形成了航空货运网络的4个高度集中的区域性货运组合枢纽,航空货运网络处于从混合结构向轴辐式枢纽结构转化的过程中。航空货运空间分布格局和经济发展格局相吻合,主要集中在以上海、杭州为核心的长三角地区,以广州、深圳为核心的珠三角地区,以北京和天津为核心的环渤海地区(京津地区)和西部发达地区的成都和重庆。
图4 中国机场货邮分布空间基尼系数和NC系数
Fig.4 Spatial Gini index and NC index of airport cargo distribution in China
2001~2012年运输量在万t以上的航段数量由35个增加到72个,运输量占比由68.11%下降到52.23%,平均每个航段运输量比重由1.95%下降到0.73%;运输量在万吨以下的航段数量由213个增加到501个,运输量占比由31.89%上升到47.77%,平均每个航段运输量比重由0.15%降低到0.09%。
2001~2012年,前10位航段货邮运输量占总货邮运输量比重由42.16%下降到23.59%,前20位航段货邮运输量占总货邮运输量比重由55.12%下降到32.12%,如表1所示。基于公式(1)~(3)计算得到2001~2012年航段货邮运输量分布的空间基尼系数和NC系数(图5),NC系数变小,表明航段上的货运趋向分散,航空货运由干线航段向支线航段转移,干线航段上货邮运输量比重降低,而支线航段承担的货邮运输量逐渐增加。
表1 中国主要航段货邮运输量变化
Table 1 China’s top 20 flight segment freight transport volumes (2001-2012)
| 项目 | 2001年 | 2005年 | 2010年 | 2012年 | ||||
|---|---|---|---|---|---|---|---|---|
| 货运量(万t) | 占比(%) | 货运量(万t) | 占比(%) | 货运量(万t) | 占比(%) | 货运量(万t) | 占比(%) | |
| 前5位 | 416957 | 30.79 | 574724 | 25.04 | 709476 | 19.15 | 617293 | 15.89 |
| 前10位 | 570804 | 42.16 | 777992 | 33.89 | 1007647 | 27.20 | 916417 | 23.59 |
| 前15位 | 665763 | 49.17 | 905240 | 39.43 | 1209345 | 32.65 | 1116532 | 28.74 |
| 前20位 | 746371 | 55.12 | 997408 | 43.45 | 1338449 | 36.13 | 1248068 | 32.12 |
| 全国 | 1354019 | 100.00 | 2295618 | 100.00 | 3704056 | 100.00 | 3885173 | 100.00 |
在2012年的588个航段中,以北京天津(华北区)、上海杭州(华东区)、深圳广州(中南区)、成都重庆(西南区)为起点或终点的航段数合计380条,占航段总数的60%以上;4组机场之间的航段共有24条,形成了华北、华东、中南和西南之间航空货邮运输主通道。其中北京天津-上海杭州之间货邮运输量最大,占总货邮运输量的7.76%,北京天津-重庆成都之间的比重最小,只有2.74%。24条主通道上货邮运输量占比由2001年的47.04%降至2012年的30.91%。主通道上货运量逐年向支线航段转移,支线航段承担了越来越多的航空货邮运输量。
图5 中国航段货邮分布空间基尼系数和NC系数
Fig.5 Spatial Gini index and NC index of flight segment cargo distribution in China
本文利用2001~2012年机场和航段的数据,分析21世纪以来中国航空货运演化形态,揭示航空货运空间变化特征,得出如下结论:① 中国航空货运空间分布格局和经济格局相吻合,主要集中在以上海杭州为核心的长三角地区,以广州深圳为核心的珠三角地区,以北京天津为核心的京津地区和西部发达地区成都和重庆,航空货运中心由东南沿海地区向西北内陆方向移动。② 航空货运网络由混合网络向轴辐式枢纽网络转化,由单一机场枢纽发展形成了京津、沪杭、广深和成渝4个组合枢纽。③ 航空货运空间分布趋于分散,枢纽机场和干线航段上航空货邮量降低,庞大的支线机场和支线航段承担了越来越多的航空货邮量。④ 四大组合枢纽之间形成了航空货运的主要通道,主通道上货运量占比由2001年的47.04%降至2012年的30.91%。主通道上货运量逐年向支线航段转移,支线航段承担了越来越多的航空货邮运输量。
本文研究对象仅限于中国境内经营的民用航空机场和航段,未来需要扩大研究范围,加入国外民用机场和航段的数据,以求更加全面的揭示世界航空货运在21世纪的空间变化特征。
The authors have declared that no competing interests exist.
| [1] |
航空网络研究综述 [J].A survey of aviation network research . |
| [2] |
Ritsema Van Eck J. The spatial configuration of airline networks in Europe [J].https://doi.org/10.1016/S0969-6997(03)00039-5 Magsci [本文引用: 6] 摘要
<h2 class="secHeading" id="section_abstract">Abstract</h2><p id="">The deregulation of US domestic passenger aviation in 1978 resulted in the reconfiguration of airline networks into radial route systems, spatially concentrated around a small number of central airports or ‘hubs’. This paper investigates whether a similar spatial concentration trend can be observed in the European aviation network after deregulation at the airline network level. Using the network concentration index, it is demonstrated that European ‘flag carriers’ already showed a very high traffic concentration rate at the beginning of deregulation. Between 1990 and 1999, the distribution of European traffic of these carriers remained remarkably stable according to the network concentration index. A spatial concentration trend of European traffic on a small number of hubs can only be observed for some regional airlines.</p>
|
| [3] |
International air network structures and air traffic density of world cities [J].https://doi.org/10.1016/j.tre.2006.10.007 URL 摘要
This paper examines international air passenger and cargo flows within and among Asia, Europe, and America, and the degree of air traffic density for major cities worldwide, using a basic gravity model composed of GDP, population, distance, and several dummy variables. The results reveal that many cities are strengthening their position as international air transportation hubs, especially: Tokyo, Hong Kong, Singapore, London, Paris, Frankfurt, Amsterdam, New York, and Miami. Finally, the results show that the air traffic density of three cities, Seoul, Hong Kong, and Amsterdam, is growing at an extraordinary rate.
|
| [4] |
The impact of US-EU“Open Skies”agreement on airline market structures and airline networks [J].https://doi.org/10.1016/j.jairtraman.2008.09.010 Magsci 摘要
<h2 class="secHeading" id="section_abstract">Abstract</h2><p id="">The gradual liberalization of international air transport has largely benefited the traveling public. Progress since the development of concepts such as “Open Skies” in the late 1970s as an alternative to the restrictive bilateral air service agreements that had effectively controlled most international air transport since the mid-1940s has been uneven and spasmodic. The recent move to open the North Atlantic more fully to competition has proved a particularly challenging task, and the agreement between the US and the European Union is still both partial and conditional. This paper offers an overview of the economics of the situation and provides insights into the reasons why it has developed in the way it has, the outcomes that we may expect from it, and some consideration of the wider, non-commercial, impacts that it may have.</p>
|
| [5] |
Characterization of airline networks: A North American and European comparison [J].https://doi.org/10.1016/j.jairtraman.2009.07.009 Magsci 摘要
<h2 class="secHeading" id="section_abstract">Abstract</h2><p id="">This paper contrasts the North American and European air transport markets using the extensive Official Airline Guide Databases. The pattern of network development in the two continental regions is examined using data for 1996–2008. The top ten carriers in both regions are analysed closely in terms of network structures and the basic geographical characteristics of these networks are highlighted. In addition, different measures of air transport activity such as seating capacity, and number of movements and of routes are compared. Visualisations of carrier networks are used to highlight the different network strategies operated by low cost and full service carriers. European carrier networks display many significant differences to North American carrier networks. European carriers generally organise their networks around one or two key nodes within the member state in which they are registered and generally do not operate interactive, continental-wide, multiple hub-and-spoke networks as do North American carriers. European and North American low-cost carriers operate much more interconnected networks than full services carriers. Southwest Airlines stands out as operating a particularly highly interconnected network.</p>
|
| [6] |
A comparative study of airport connectivity in China, Europe and US: Which network provides the best service to passengers? [J].https://doi.org/10.1016/j.tre.2009.08.003 URL 摘要
This paper investigates the connectivity of the airport networks in China, Europe and US. Our aim is to analyze which network is most beneficial to final passengers in terms of travel time and which of the network features lead to such a result. A time-dependent minimum path approach is employed to calculate the minimum travel time between each pair of airports in the three networks, inclusive of flight times and waiting times in intermediate airports. The authors evaluate each fastest indirect connection in terms of waiting times and routing factors to consider the effect of the hubs' coordination and locations. The Chinese network provides the quickest travels for passengers, but this performance is explained by a small number of airports per inhabitant. The US network is the most coordinated when considering indirect connections. The EU network provides the most homogeneous level of service when comparing airports of different sizes.
|
| [7] |
Study of the topology and robustness of airline route networks from the complex network approach: a survey and research agenda [J].https://doi.org/10.1016/j.jtrangeo.2014.04.015 URL 摘要
Communication via air routes is an important issue in a world organized around a web city network. In this context, the robustness of network infrastructures, e.g. air transport networks, are a central issue in transport geography. Disruption of communication links by intentional causes (e.g., terrorist attack on an airport) or unintentional (e.g., weather inclemency) could be crucial for countries, regions and even the airlines affected themselves. Policymakers and the management of airlines and alliances should be able to reduce the effects of such interruptions in order to ensure good communication through air transport (i.e., maximize the robustness of their network at a reasonable cost). The literature review of the study of air transport route networks through an analysis of complex networks has highlighted a lack of contributions to the study of the topology and the robustness of such networks which contrasts, with advances undertaken for other transport networks or communication systems. This survey suggests areas in which research should be undertaken, based on the existing literature in other areas and from three different perspectives: global route networks, airline alliances, airlines and airports so as to help towards a better understanding of air traffic and, therefore, to be able to assess the potential damage of any airport being inoperative for a continent, country or airline.
|
| [8] |
An exploratory analysis on the evolution of the US airport network [J].https://doi.org/10.1016/j.physa.2014.06.067 URL [本文引用: 1] 摘要
Airport network has a nontrivial impact on shaping the development of a country or region, and decision makers or researchers can benefit from its evolution characteristics. This paper presents an exploratory analysis on the evolution of the US airport network from 1990 to 2010. Generally, we find that (1) the USAN has experienced a drastic change in both its structure and traffic amount in the year 2002. Particularly, regarding the entire USAN, we show that (2) it preserves the scale-free, small-world, and disassortative mixing properties over time which is consistent with the previous studies. Thereafter, the evolution of the USAN is examined from two perspectives: stable cities that never disappear in the time period and new cities that only appear in certain years. Findings from the first perspective imply that (3) stable cities form the backbone of the USAN over time and their structural similarity over time shows regularity. On the other hand, results from the second one indicate that (4) the USAN is undergoing a process of continuous densification intertwined with intense exploration in 1991 and 2002, which consequently leads to a stable USAN.
|
| [9] |
J T. A spatial analysis of FedEx and UPS: hubs, spokes, and network structure [J]. |
| [10] |
Does EU ETS instigate Air Cargo network reconfiguration? A model-based analysis [J].https://doi.org/10.1016/j.ejor.2012.10.016 Magsci 摘要
From 2012 on aviation is included in the European Emissions Trading Scheme (EU ETS) and operators have to hold one allowance per tonne of CO2 emitted on every flight departing from and/or arriving at an airport within the EU. Now two questions are of interest: Is it profitable for airlines to reconfigure their routes to reduce EU-related emissions and costs, and, will the scheme be successful in the sense that emissions are reduced significantly. Here the potential for and the consequences of reconfiguration are different for the passenger and cargo business, respectively. In this paper we present a model-based evaluation of network (re-)configuration/optimization at cargo airlines under different EU ETS scenarios and we discuss the results with respect to the two issues raised above. (C) 2012 Elsevier B.V. All rights reserved.
|
| [11] |
Air freight hubs in the FedEx system: Analysis of fuel use [J]. |
| [12] |
Analysis of mode choice variables in short-distance intermodal freight transport using an agent-based model [J].https://doi.org/10.1016/j.tra.2014.01.002 URL [本文引用: 1] 摘要
Medium to long-distance intermodal transport has been strongly promoted by the European Commission and national governments as a solution for ensuring the sustainability of the freight transport sector. However, so far, intermodal transport has revealed limited capacity for competing against road transport. New solutions aimed at expanding the limits of its competitiveness are needed. Some successful cases of short-distance intermodal transport reveal untapped market opportunities. The literature on mode choice fails to explain these successes. The research has focused mainly on long-distance services, and the findings are not necessarily transferable to the short-distance transport. This paper presents the results of research aimed at testing this assumption. A new agent-based model to simulate the transport operations and behavioural reactions of transport agents was developed, applying mode choice variables that are consensually referred to as pivotal in the mode choice process: price, transit time, reliability and flexibility. The use of the model was to ascertain the performance of competing transport modes (intermodal and road) under different demand scenarios. Applications of the model to a short-distance transport service show that only price could explain the Freight Forwarder choice for intermodality. The evidence produced by this research suggests that the mode choice process for short-distance transport services may be governed by other decision variables and that current intermodality-oriented policy options should be revised, as they exclude a potential market segment.
|
| [13] |
我国航空货运网络结构研究 [J].https://doi.org/10.3969/j.issn.1000-8462.2007.04.030 URL [本文引用: 1] 摘要
选取国内空港130个、航线317条,国际空港72个、航线237条,从空港和航线两个角度 探讨我国航空货运机场分布格局和网络结构,结果发现:华东区、华北区、中南区是航空货物的主来源地、目的地和中转地,上海、广州和深圳、北京构成我国航空 货运的“三极”,形成货运三角;航空货运主要分布在少数枢纽空港间的航线上,呈现集中状态,前五位航线的货运量之和为43.83万t,占27.33%;航 空货运高度集中在人口100万以上的城市间,人口100万以下的城市间航空货运联系很弱,所占市场份额之和不足1%,中等城市之间、大城市与中等城市、小 城市之间无直航航线联系;我国对外航空货运联系主要集中在北美、日韩、西欧和港澳地区,与东欧、中东和南亚地区的航空货运联系较弱,与非洲和拉美地区目前 还没有直通航班。
Wei H Y et al.The study on distributing pattern and network structure of air freight airports in China .https://doi.org/10.3969/j.issn.1000-8462.2007.04.030 URL [本文引用: 1] 摘要
选取国内空港130个、航线317条,国际空港72个、航线237条,从空港和航线两个角度 探讨我国航空货运机场分布格局和网络结构,结果发现:华东区、华北区、中南区是航空货物的主来源地、目的地和中转地,上海、广州和深圳、北京构成我国航空 货运的“三极”,形成货运三角;航空货运主要分布在少数枢纽空港间的航线上,呈现集中状态,前五位航线的货运量之和为43.83万t,占27.33%;航 空货运高度集中在人口100万以上的城市间,人口100万以下的城市间航空货运联系很弱,所占市场份额之和不足1%,中等城市之间、大城市与中等城市、小 城市之间无直航航线联系;我国对外航空货运联系主要集中在北美、日韩、西欧和港澳地区,与东欧、中东和南亚地区的航空货运联系较弱,与非洲和拉美地区目前 还没有直通航班。
|
| [14] |
50 多年来中国空港布局演变及其影响因素——基于空间分析和数理统计的方法 [J].A research on airports distribution and determinative factors in china in the past over fifty years: based on spatial analysis and quantitative statistic . |
| [15] |
中国航空货运发展及其空间格局研究 [J].URL 摘要
航空货运是航空运输的重要内容,航空货运发展及空间关系是航空运输研究的重要方向。通过对20多年来中国国内航空货运发展的研究,得到中国航空货运空间分布格局及其演变特征。研究结果表明,中国航空货流网络体现出明显的空间分异特征,符合空间距离衰减规律,85%的航空货运发生在1000~2000km的范围内;初步形成由北京、上海、广州3个全国性枢纽和昆明、成都、乌鲁木齐3个区域性枢纽为主导的初级枢纽轮辐式网络结构;超大城市控制航空货运网络,航空货流进一步向东西部少数城市集聚,合理组织航空货运网络具有深远意义。
Zhang L et al. The air cargo transportation development and air cargo flow’s spatial pattern in China .URL 摘要
航空货运是航空运输的重要内容,航空货运发展及空间关系是航空运输研究的重要方向。通过对20多年来中国国内航空货运发展的研究,得到中国航空货运空间分布格局及其演变特征。研究结果表明,中国航空货流网络体现出明显的空间分异特征,符合空间距离衰减规律,85%的航空货运发生在1000~2000km的范围内;初步形成由北京、上海、广州3个全国性枢纽和昆明、成都、乌鲁木齐3个区域性枢纽为主导的初级枢纽轮辐式网络结构;超大城市控制航空货运网络,航空货流进一步向东西部少数城市集聚,合理组织航空货运网络具有深远意义。
|
| [16] |
Evolution of air transport network of China 1930-2012 [J]. |
| [17] |
Empirical study of Chinese airline network structure based on complex network theory . |
| [18] |
Exploring the network structure and nodal centrality of China’s air transport network: A complex network approach [J].https://doi.org/10.1016/j.jtrangeo.2010.08.012 Magsci [本文引用: 1] 摘要
This paper paper uses a complex network approach to examine the network structure and nodal centrality of individual cities in the air transport network of China (ATNC). Measures for overall network structure include degree distribution, average path length and clustering coefficient. Centrality metrics for individual cities are degree, closeness and betweenness, representing a node's location advantage as being directly connected to others, being accessible to others, and being the intermediary between others, respectively. Results indicate that the ATNC has a cumulative degree distribution captured by an exponential function, and displays some small-world (SW) network properties with an average path length of 2.23 and a clustering coefficient of 0.69. All three centrality indices are highly correlated with socioeconomic indicators of cities such as air passenger volume, population, and gross regional domestic product (GRDP). This confirms that centrality captures a crucial aspect of location advantage in the ATNC and has important implications in shaping the spatial pattern of economic activities. Most small and low-degree airports are directly connected to the largest cities with the best centrality and bypass their regional centers, and therefore sub-networks in the ATNC are less developed except for Kunming in the southwest and Urumchi in the northwest because of their strategic locations for geographic and political reasons. The ANTC is relatively young, and not as efficient and well-developed as that of the US. (C) 2010 Elsevier Ltd. All rights reserved.
|
| [19] |
我国航空货运的模式分析及发展思路 [J].
本文对四类航空公司货运发展模式进行对比分析,提出我国航空货运企业应该明确市场定位,基于自身的市场战略,选择不同的发展路径,以专业化发展促进产业协作,进而提升产业竞争力。
Analysis of China air cargo transportation pattern and its development ideas .
本文对四类航空公司货运发展模式进行对比分析,提出我国航空货运企业应该明确市场定位,基于自身的市场战略,选择不同的发展路径,以专业化发展促进产业协作,进而提升产业竞争力。
|
| [20] |
我国航空货运服务链相关问题分析及对策 [J].URL 摘要
本文系统地阐述了航空货运的特点,以及航空贷运产业链和服务链等相关重要问题,从系统的观点分析了目前我国航空货运发展中存在的一些问题与产生的原因,并提出一些建议。
Analysis and countermeasures for China cargo transportation service chain .URL 摘要
本文系统地阐述了航空货运的特点,以及航空贷运产业链和服务链等相关重要问题,从系统的观点分析了目前我国航空货运发展中存在的一些问题与产生的原因,并提出一些建议。
|
| [21] |
上海航空货运业发展现状及未来趋势分析 [J].https://doi.org/10.3969/j.issn.1009-6744.2011.05.004 URL [本文引用: 1] 摘要
上海航空货运业已成为上海经济新的增长点,在全国亦占有重要地 位.本文从机场及货运设施、航空货邮吞吐量及结构等方面分析了上海航空货运业的发展现状,并对上海机场及货运设施发展进行了展望.运用SPSS软件对航空 货邮吞吐量与外贸进出口总额进行了回归分析和弹性分析.在此基础上预测了上海航空货邮吞吐量的发展趋势.结果表明,上海机场的服务范围已超越长三角地区, 航空货邮吞吐量具有显著的不均衡性,未来将随着外贸进出口总额的增加而增加,但其增速慢于外贸进出口总额增速,预计“十二五”末达到530万吨左右.机场 货运设施能够满足航空货运发展的需要.最后,提出了上海航空货运业的发展对策.
Status and future development of shanghai air cargo industry .https://doi.org/10.3969/j.issn.1009-6744.2011.05.004 URL [本文引用: 1] 摘要
上海航空货运业已成为上海经济新的增长点,在全国亦占有重要地 位.本文从机场及货运设施、航空货邮吞吐量及结构等方面分析了上海航空货运业的发展现状,并对上海机场及货运设施发展进行了展望.运用SPSS软件对航空 货邮吞吐量与外贸进出口总额进行了回归分析和弹性分析.在此基础上预测了上海航空货邮吞吐量的发展趋势.结果表明,上海机场的服务范围已超越长三角地区, 航空货邮吞吐量具有显著的不均衡性,未来将随着外贸进出口总额的增加而增加,但其增速慢于外贸进出口总额增速,预计“十二五”末达到530万吨左右.机场 货运设施能够满足航空货运发展的需要.最后,提出了上海航空货运业的发展对策.
|
| [22] |
|
| [23] |
Measuring geographic concentration by means of the standard deviational ellipse [J].https://doi.org/10.1086/214027 URL [本文引用: 1] 摘要
Many social problems involve the geographic location of the social factors concerned. To know the characteristics of the areas in which these factors appear is to throw light on the entire situation. A statistical method for measuring the concentration of unit locations on a"
|
| [24] |
地理空间分布整体统计研究进展 [J].https://doi.org/10.11820/dlkxjz.2009.01.001 Magsci [本文引用: 1] 摘要
<p>利用统计学方法研究社会经济与自然等要素的地理空间分布在最近几十年来已引起许多学者的关注。地 理空间分布的整体性就像它的局部性一样,是空间统计分析的主要对象。本文目的是综述各种地理空间分布整体 性特征的统计研究进展。在这里,地理空间分布的整体性特征是指它在二维空间上的中心和方位以及它自身的地 理范围、空间密集度和形状。文中介绍了对这些整体性特征进行统计描述、预测和估计的方法。已有近20 个空间统 计指标用于描述社会经济和自然地理空间分布的各种整体性特征,分析和预测它们的时空演化过程,如空间移动、 扩张、加密、旋转,并确定不同空间分布的相关关系。文中探讨了地理空间分布整体统计目前存在的主要科学问题, 如空间独立性假设、空间随机抽样、时空过程分析(包括时空稳态随机过程)、空间统计描述方法和空间分布函数等。</p>
Global statistics of spatial distribution: a literature review .https://doi.org/10.11820/dlkxjz.2009.01.001 Magsci [本文引用: 1] 摘要
<p>利用统计学方法研究社会经济与自然等要素的地理空间分布在最近几十年来已引起许多学者的关注。地 理空间分布的整体性就像它的局部性一样,是空间统计分析的主要对象。本文目的是综述各种地理空间分布整体 性特征的统计研究进展。在这里,地理空间分布的整体性特征是指它在二维空间上的中心和方位以及它自身的地 理范围、空间密集度和形状。文中介绍了对这些整体性特征进行统计描述、预测和估计的方法。已有近20 个空间统 计指标用于描述社会经济和自然地理空间分布的各种整体性特征,分析和预测它们的时空演化过程,如空间移动、 扩张、加密、旋转,并确定不同空间分布的相关关系。文中探讨了地理空间分布整体统计目前存在的主要科学问题, 如空间独立性假设、空间随机抽样、时空过程分析(包括时空稳态随机过程)、空间统计描述方法和空间分布函数等。</p>
|
| [25] |
Contributions to a statistical methodology for areal distribution [J]. |
| [26] |
中国经济格局时空演化趋势 [J].https://doi.org/10.3969/j.issn.1006-3862.2013.07.003 URL [本文引用: 2] 摘要
国内市场正在重塑我国经济空间格局。本文利用标准差椭圆和标准距离方法,基于全国287个城 市(地级及以上)数据确定了我国经济格局时空演化的基本态势:2003~2010年,我国经济重心正向内陆方向移动,经济发展呈现出空间收缩密集化态势, 且在东一西方向上的增长趋势强于南一北方向,经济发展空间均衡趋势明显,空间差异呈下降趋势。这些趋势表明,我国国内市场引发的聚集经济作用在不断加强。 建议以华北平原和长江中下游平原为主构建我国经济发展的核心区,加大对安徽省、河南省和湖北省等靠近全国市场的中部地区的投入力度,大力推动我国经济进入 内生增长、沿海一内陆双轮驱动的发展轨道。
Projecting the spatial-temporal evolution of economic pattern in China .https://doi.org/10.3969/j.issn.1006-3862.2013.07.003 URL [本文引用: 2] 摘要
国内市场正在重塑我国经济空间格局。本文利用标准差椭圆和标准距离方法,基于全国287个城 市(地级及以上)数据确定了我国经济格局时空演化的基本态势:2003~2010年,我国经济重心正向内陆方向移动,经济发展呈现出空间收缩密集化态势, 且在东一西方向上的增长趋势强于南一北方向,经济发展空间均衡趋势明显,空间差异呈下降趋势。这些趋势表明,我国国内市场引发的聚集经济作用在不断加强。 建议以华北平原和长江中下游平原为主构建我国经济发展的核心区,加大对安徽省、河南省和湖北省等靠近全国市场的中部地区的投入力度,大力推动我国经济进入 内生增长、沿海一内陆双轮驱动的发展轨道。
|
| [27] |
中国制造业集聚程度变动趋势实证研究 [J].https://doi.org/10.3969/j.issn.1002-4565.2005.08.005 URL [本文引用: 1] 摘要
制造业是集群特征最为明显的产 业。本文利用Ellision和Glaeser建立的产业地理集中指数和自定义的五省市集中度对中国20个制造行业1993、1997、2002、 2003年的集聚程度进行了精确测定。结果表明,1993—1997年集聚程度有所下降,1997—2002—2003年集聚程度呈增长趋势。集聚程度的 提高是主要的变动方向和发展趋势。集聚程度由高到低的行业分布依次为:技术密集型产业———资本密集型产业———劳动密集型产业。地域分布极不平衡,江 苏、广东、山东、浙江、上海五省市集中度很高,西部边远地区则远远落后,两极分化严重。总体上看,制造业的集聚程度与工业增长表现出较强的正相关性。
A positive research on fluctuation trend of China’s manufacturing industrial agglomeration degree .https://doi.org/10.3969/j.issn.1002-4565.2005.08.005 URL [本文引用: 1] 摘要
制造业是集群特征最为明显的产 业。本文利用Ellision和Glaeser建立的产业地理集中指数和自定义的五省市集中度对中国20个制造行业1993、1997、2002、 2003年的集聚程度进行了精确测定。结果表明,1993—1997年集聚程度有所下降,1997—2002—2003年集聚程度呈增长趋势。集聚程度的 提高是主要的变动方向和发展趋势。集聚程度由高到低的行业分布依次为:技术密集型产业———资本密集型产业———劳动密集型产业。地域分布极不平衡,江 苏、广东、山东、浙江、上海五省市集中度很高,西部边远地区则远远落后,两极分化严重。总体上看,制造业的集聚程度与工业增长表现出较强的正相关性。
|
| [28] |
An assessment of the capacity and congestion levels at European airports [J].https://doi.org/10.1016/S0969-6997(99)00006-X URL [本文引用: 1] 摘要
This paper examines the current capacity of the EU's airport infrastructure and the main factors determining that capacity. The nature and role of airport services are detailed. The determination of capacity is examined with discussion of the influence which air traffic control factors, demand characteristics, environmental conditions and engineering design will have on capacity. The methods used to assess delay are detailed along with extensive data sketching the current state of Europe's system of large airports and the extent of infrastructure congestion. The options available to policy makers to improve the management and organisation of capacity are set out and critically discussed.
|
| [29] |
Traffic distribution in low-cost and fullservice carrier networks in the US air transportation market [J]. |

/
| 〈 |
|
〉 |

