李静 , 吴吉春
, 吴吉春
Li Jing, Wu Jichun
中图分类号: P461.4
文献标识码: A
文章编号: 1000-0690(2016)04-0588-09
通讯作者:
收稿日期: 2015-03-18
修回日期: 2015-07-28
网络出版日期: 2016-07-21
版权声明: 2016 《地理科学》编辑部 本文是开放获取期刊文献,在以下情况下可以自由使用:学术研究、学术交流、科研教学等,但不允许用于商业目的.
作者简介:
作者简介:李静(1979-),女,山西长治人,副研究员,主要从事多年冻土环境与分布研究。E-mail: li_jing9797@lzb. ac. cn
展开
摘要
以黄河源区多年冻土分布现状和热力特征为研究目标,通过野外调查及实测数据,分析了黄河源区不同地形地貌、不同地表覆盖条件下的冻土形成、分布特征和以地温为基础的热学特征,探讨了不同尺度因素对多年冻土分布的影响。结果表明,在高程低于4 300 m的平原区,多年冻土多不发育;在高于4 350 m的山区,局地地形对多年冻土的形成与分布作用显著。除阳坡地形外,多年冻土均比较发育;介于4 300~4 350 m的低山丘陵和平原区,局地地形、地表植被、土壤湿度等因素共同决定着多年冻土的形成和分布格局。以年均地温指标为基础,构建了以纬度、经度和高程为自变量的回归模型,并对阳坡地形进行微调和校正。结果表明,以0ºC作为划分季节冻土和多年冻土的标准和界限,多年冻土面积2.5×10⁴km2,约占整个源区面积的85.1%;季节冻土面积0.3×10⁴km2,约占整个源区面积的9.7%。进一步以0.5ºC或1.0ºC为分类间隔绘制了黄河源区多年冻土热稳定性空间分布图。
关键词:
Abstract
The source area of the Yellow River (SAYR) is located in the eastern-to-medium part of the Qinghai-Tibet Plateau. Permafrost in the SAYR experienced remarkable degradation in the past. Taking distribution patterns of frozen soil and permafrost stability as research object, the characteristics of permafrost development and distribution patterns at various terrains and land covers were analyzed based on a large amount of field investigations and the measurements. In addition, thermal features of permafrost were analyzed based on the measured ground temperatures at various depths. The effects of the geological and geographic factors on permafrost distribution and thermal stability were discussed. It was indicated that: 1) Permafrost was occasionally developed in the various fluvial and proluvial plains with elevation generally lower than 4 300 m; 2) Permafrost was widely distributed in the mountains higher than 4 350 m except for the sunny slope terrain, where local terrain played an important role in permafrost development and distribution; 3) The combinations of local terrain, surficial vegetation, soil wetness and moisture conditions all contributed to the formation and distribution of permafrost in the low hills and mountains where elevation ranged in 4 300-4 350 m.Taking the annual mean ground temperature (MAGT) as the basis, an experiential-statistical MAGT-based model was constructed, of which latitude, longitude and elevation were set up as independent variables. Together with DEM data, permafrost MAGTs were primarily modeled using the statistically regression model. And then, the modeled results in the south-facing areas were slightly adjusted, and a secondly model was constructed to model permafrost distribution in the shady areas. Thirdly, the combined modeling results were locally adjusted using the measurements. The frozen soil map in the SAYR was thus compiled. Taking 0ºC as the boundary between permafrost and seasonally frozen soil, it was indicated that permafrost was distributed in an area of 2.5×10⁴km2, which occupied approximately 85.1% in the SAYR, and that seasonally frozen soil was distributed in an area of 0.3×10⁴km2 with an areal percentage of 9.7%. Permafrost was further divided into seven stability taking 0.5ºC or 1.0ºC of MAGTs as intervals.They were the first zone with permafrost MAGT smaller than -4.0ºC, the second zone with permafrost MAGT varying between -4.0ºC and -3.0ºC, the third zone with permafrost MAGT varying between -3.0ºC and -2.0ºC, the fourth zone with permafrost MAGT varying between -2.0ºC and -1.0ºC, the fifth zone with permafrost MAGT varying between -1.0ºC and -0.5ºC, the sixth zone with permafrost MAGT varying between -0.5ºC and 0ºC, and the seventh zone with permafrost MAGT higher than 0ºC.
Keywords:
由于全球气候变化和人类活动的增强,多年冻土退化所引起的环境问题、水文效应等问题逐渐引起人们的关注[1~4]。但由于其地下埋藏性,多年冻土的空间分布具有较大的模糊性和不确定性。青藏高原是中国多年冻土的主要分布区,主要发育了高山和高平原2种高海拔多年冻土类型[5]。在青藏高原,经度、纬度和高程作用的多年冻土分布的“三向地带性”规律明显[6,7]。随着空间尺度的下降,在区域尺度上,纬度和高程成为制约多年冻土空间分布格局的主要宏观因素[8]。而在流域尺度上,局地因素如局地地形、植被、土壤水分等因素对多年冻土空间分布格局的形成发挥主要作用[9, 10]。不同空间尺度的经验-统计模型成为模拟多年冻土分布的常用方法,在高纬度和高海拔多年冻土区都得到了不同程度的应用[11~13]。经验-统计模型具有输入变量少、变量相对容易获取等优势,但其最大的缺陷在于空间上的不可推广性。近年来,也有研究分析探讨了将经验-统计模型实现不同区域空间上的拓展,但效果不甚明显。
黄河源区位于中国青藏高原的中东部,214国道从其东部穿过,源区东部交通较为便利,而中西部交通条件则较差。目前已有多年冻土研究集中在源区东部的214国道沿线[14]、温泉地区[15]、巴颜喀拉山北坡和查拉坪地带等[16],涉及中西部地区的多年冻土研究较少。从多年冻土的演替发展上来看,源区多年冻土呈区域性退化趋势,表现为由片状分布逐渐变为岛状、斑状分布,多年冻土层变薄,冻土面积缩小,融区范围扩大。部分多年冻土岛完全消失变为季节冻土[17]。多年冻土的退化也导致了黄河源区占主导地位的高寒草甸失水向沙漠化草地和“黑土滩”型次生裸地退化[18]。在中科院重点部署项目“黄河源区冻土变化的水文效应”支持下,对黄河源区多年冻土实地考察的范围拓展到了中西部地带,从而使得全面认识源区多年冻土形成和分布特征、绘制源区冻土分布图成为可能。在已有和新增钻孔和地温数据的支持下,通过构建多年冻土分布的经验-统计模型来绘制源区多年冻土分布图和分析多年冻土年均地温空间分布格局。
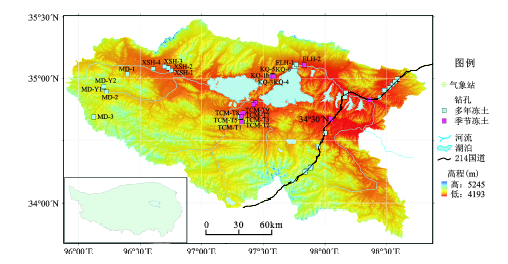
本文所指黄河源是多石峡(34°46′26″N,98°20′59″E,4 197 m)以上的源头区集水范围,地理坐标介于95°55'E~98°41'E、33°56'N~35°31'N之间(图1),两湖(鄂陵湖和扎陵湖)形成区域的汇水中心。北以昆仑山中列支脉布青山与柴达木盆地相隔,南抵巴颜喀拉山与长江上游通天河水系相邻,西至各式各雅山高原丘陵与格尔木河流域相邻[19]。地表水体丰富,除鄂陵湖、扎陵湖以外,尚有隆热错、茶木错、尕拉拉错、星星海等诸多湖泊,多曲、热曲、勒那曲、贝敏曲等河流构成黄河的一级支流。流域面积2.97×10⁴km2,其中湖泊面积0.15×10⁴km2,约占整个流域面积的5%左右。由河流、湖泊等流水作用形成的冲洪积平原和台地等在整个源区中面积比例较大,沼泽湿地非常发育。区内海拔整体高峻,气候高寒。玛多气象站年平均气温为-3.7℃,年降水量为318 mm。源区年降水量为300~600 mm,年蒸发量为1 000~1 500 mm[20],为典型的高原大陆性气候。植被类型较为简单,高寒沼泽草甸、高寒草甸、高原草原和荒漠是主要的植被类型,局部高山部位分布着垫状植被和流石滩稀疏植被。
图1 黄河源区地形及钻孔位置示意图
Fig.1 Sketch map of the general topography and the locations of present boreholes in the source area of the Yellow River
本文所采用数据为不同时期的地温和钻孔实测数据。数据的来源包括214沿线工程研究监测资料理调查和“黄河源区冻土退化的水文效应”项目等的长期积累。其中,214沿线工程监测资料提供钻孔及测温数据14个,主要分布于214国道沿线多钦安科郎至巴颜喀拉山北坡一带,各钻孔点特征分析见文献[14]。此外,2013年、2014年间2次野外分别在黄河源区中、西部地带开展钻探和地温测量工作,共获取钻孔及测温数据35个。钻孔深度均为15~20 m,地温测量不定期进行,测温深度为地表至地下15~20 m以0.5 m或1 m间隔。地温的测量采用冻土工程国家重点实验室研制开发的高精度热敏探头,传感器测温精度优于0.05℃[21]。在钻探过程中,用手持式GPS记录各钻孔点的地理位置信息,与此同时,调查并记录各钻孔点周围地形地貌特征、植被、岩性特征。
多年冻土年均地温是表征多年冻土热状况的常用指标[22]。在青藏高原,10~15 m深度处地温基本不随外界温度变化而发生变化,因此,常被视作多年冻土的年均地温值[8]。在本文的研究中,统一采用15 m深度处的实测地温值作为多年冻土的年均地温。以钻探过程中岩芯冻结特征(地下冰的存在是野外判断多年冻土存在的重要标准)、0℃附近的实测地温数据和地温-深度廓线等指标相结合判断各钻孔点的冻土发育特征,将其划分为多年冻土和季节冻土,用以进行建模数据的初步筛选和对模型模拟结果的精度校验。
以SRTM DEM数据(空间分辨率90 m)为基础,提取出各钻孔点坡度坡向等地形特征。结合数字地貌数据(1:100万)分析各钻孔所在地的地貌类型特征[23]。在对地温数据进行详细分析的基础上,通过相关分析、回归分析等数学统计方法对多年冻土地温数据进行分析,构建模拟黄河源区多年冻土年均地温分布的主体模型。在此基础上,考虑局地地形特征(坡度坡向等),对局地地形引起的地温差异进行调整。首先通过现在普遍通用的青藏高原冻土图(1:300万)[24]对模拟结果进行验证,其次通过“青藏高原冻土本底调查项目”绘制的高原冻土图对模拟结果进行验证,以及对比分析本结果与其他相关研究成果之间的异同性等讨论本研究结果存在的问题。
以DEM数据和数字地貌数据(1:100万)为基础对黄河源区整体地形地貌特征进行分析。结果表明,源区海拔变化于4 200~5 245 m之间,以坡度5º作为划分平地和山区的界限,则坡度小于等于5º(即平地)的区域占整个研究区域面积的68.5%,坡度大于5º的山区占整个区域面积的31.5%。因此,平地是整个源区地形的主体地貌特征。
2013年、2014年黄河源新增钻孔主要分布于黄河源中西部的平原和山地等地区,以点群方式分布于5个区域,分别是源区中部两湖北部湖积冲洪积平原区、两湖之间低山丘陵区、两湖南部冲洪积平原-低山丘陵-高山区和源区西部的高山区和星宿海冲积扇平原区(图1)。以钻探结果、年均地温值0℃等指标作为划分多年冻土和季节冻土的界限,则新增钻孔中包括多年冻土26个,季节冻土9个;214国道沿线已有钻孔中多年冻土12个,季节冻土2个,合计多年冻土钻孔38个、季节冻土钻孔11个。对新增钻孔点所在位置的局地地形提取结果来看,11个钻孔点位于山区,24个钻孔点位于平地。各钻孔点特征见表1。就山区钻孔而言,除阳坡地形条件外(钻孔KQ-2、TCM-T4),源区中部山区多年冻土均比较发育,各个钻孔点多年冻土的差别在于年均地温的差异。但是海拔高度高于一定范围以上,阳坡地形条件下多年冻土也比较发育(钻孔MD-Y1和MD-Y2)。就平地钻孔而言,海拔高度和地表条件决定着多年冻土的发育与否。源区中部两湖南部的钻孔剖面(TCM-1、TCM-2、TCM-3、TCM-4a、TCM-4b、TCM-5、TCM-6a、TCM-6b、TCM-7、TCM-8、TCM-9)揭示,随着海拔高度的上升和地表覆盖条件由草原/荒漠(TCM-1、TCM-2、TCM-3、TCM-4a)向草甸/沼泽湿地(TCM-4b、TCM-5、TCM-6a)的转变,对应下覆冻土由季节冻土向多年冻土转变。
表1 黄河源中西部地区钻孔点信息汇总
Table 1 Information of boreholes located in the medium and western sections of the source area of the Yellow River
| 编号 | 地形地貌 | 高程(m) | 坡度(º) | 年均地温(℃) | 地表覆盖特征 | |
|---|---|---|---|---|---|---|
| 源区中部两湖以北 | ELH-1 | 冲洪积平原 | 4283 | 0 | -0.60 | 高寒荒漠 |
| ELH-2 | 冲洪积平原 | 4300 | 1 | -0.63 | 荒漠化草原 | |
| ELH-3 | 冲洪积平原 | 4285 | 1 | 1.50 | 荒漠化草原 | |
| 源区中部两湖之间 | KQ-1a | 小盆地(平地) | 4302 | 1 | -0.57 | 荒漠化草原 |
| KQ-1b | 小盆地(小土丘顶部) | 4302 | 3 | -0.43 | 荒漠化草原 | |
| KQ-1c | 小盆地(冻胀台地) | 4302 | 2 | 0.43 | 高寒荒漠 | |
| KQ-2 | 山前缓坡(阳坡坡脚) | 4314 | 6 | 0.95 | 高寒草原 | |
| KQ-3 | 低山丘陵(山顶) | 4345 | 9 | -0.31 | 荒漠化草原 | |
| KQ-4 | 低山丘陵(阴坡) | 4316 | 7 | -0.20 | 荒漠化草原 | |
| KQ-5 | 小型冲洪积扇 | 4315 | 5 | -0.11 | 高寒荒漠 | |
| KQ-6 | 小盆地(小土丘顶部) | 4322 | 3 | -0.46 | 荒漠化草原 | |
| 源区中部两湖以南 | TCM-1 | 洪积平原 | 4284 | 1 | 1.99 | 高寒草原 |
| TCM-2 | 洪积平原 | 4295 | 0 | 2.96 | 高寒荒漠 | |
| TCM-3 | 洪积平原 | 4330 | 1 | 1.99 | 荒漠化草原 | |
| TCM-4a | 洪积平原 | 4315 | 1 | 1.44 | 荒漠化草原 | |
| TCM-4b | 洪积平原(洪积扇) | 4324 | 0 | -0.04 | 退化草甸边缘 | |
| TCM-5 | 洪积平原(洪积扇) | 4335 | 1 | -0.02 | 退化草甸 | |
| TCM-6a | 山前缓坡坡脚 | 4336 | 2 | -0.21 | 沼泽湿地 | |
| TCM-6b | 山前缓坡坡脚 | 4332 | 1 | 0.37 | 黑土滩 | |
| TCM-7 | 高山(阴坡) | 4344 | 6 | -0.05 | 高寒草甸 | |
| TCM-8 | 高山(阴坡) | 4370 | 15 | -0.10 | 高寒草甸 | |
| TCM-9 | 高山(山顶) | 4400 | 10 | -0.10 | 高寒草甸 | |
| TCM-T1 | 高山(山间台地) | 4404 | 7 | -0.36 | 沼泽湿地 | |
| TCM-T2 | 高山(山间台地) | 4426 | 2 | -0.64 | 黑土滩 | |
| TCM-T3 | 高山(阴坡) | 4422 | 11 | -0.54 | 高寒草甸 | |
| TCM-T4 | 高山(阳坡) | 4435 | 7 | 1.33 | 高寒草甸 | |
| 源区西部冲积扇平原 | XSH-1 | 冲积扇边缘 | 4322 | 0 | -0.14 | 高寒荒漠 |
| XSH-2 | 冲积扇中部 | 4330 | 1 | -0.58 | 高寒荒漠 | |
| XSH-3 | 冲积扇中部 | 4341 | 0 | -0.16 | 高寒荒漠 | |
| XSH-4 | 冲积扇边缘 | 4392 | 0 | -0.33 | 高寒荒漠 | |
| 源区西部高山区 | MD-1 | 高山(山间台地) | 4433 | 1 | -0.44 | 沼泽湿地 |
| MD-2 | 高山(河流阶地) | 4509 | 1 | -0.95 | 高寒草甸 | |
| MD-3 | 高山(山间台地) | 4626 | 2 | -1.31 | 沼泽湿地 | |
| MD-Y1 | 高山(阳坡坡脚) | 4625 | 6 | -0.97 | 退化草甸 | |
| MD-Y2 | 高山(阳坡坡顶) | 4699 | 10 | -1.27 | 高寒荒漠 |
整体来看,两湖北部冲洪积平原以多年冻土为主,3个钻孔中2个为多年冻土(ELH-1和ELH-2),年均地温为-0.6ºC左右,1个为季节冻土或融区(ELH-3),可能是河流和湖泊等水体作用的结果。两湖之间低山丘陵区也以多年冻土为主,除阳坡地形(KQ-2)和局地因素(KQ-1c)作用显著的钻孔为季节冻土以外,其余均为多年冻土。受地形和局地地表特征的影响,源区中部两湖以南的区域基本为不连续多年冻土区。而进入源区西部区域,钻孔及实测地温值揭示多年冻土普遍发育。
为获取多年冻土年均地温整体变化趋势,在构建地温模型的过程中,首先排除了季节冻土钻孔(ELH-3、KQ-1c、TCM-1、TCM-2、TCM-3、TCM-4a),原因在于季节冻土孔的温度一般会发生剧增,与多年冻土地温孔之间有突变,所以不能参与多年冻土地温统计。其次排除阳坡地形的影响,即在建模的过程中剔除掉4个阳坡孔(KQ-2、TCM-T4、MD-Y1和MD-Y2);最后对局地因素作用显著的钻孔(TCM-6b)点进行了排除。以38个多年冻土钻孔及其实测地温数据为基础构建黄河源区多年冻土分布的主体模型(公式1),结果表明,经度、纬度、高程是影响源区多年冻土年均地温空间变化的主要因素,而且3因素对年均地温的影响均呈负相关,即海拔越高、多年冻土地温越低,纬度值越大、地理位置越偏北、多年冻土地温越低,经度值越大、地理位置越偏西、多年冻土地温越低。这与源区西部的实测钻孔和地温资料是相吻合的。位于西部的钻孔由于经度值和海拔高度都比较大,因此,多年冻土是普遍发育的,年均地温值也比较低。
GT=76.59-0.20LONG-1.16LAT-0.0039H R2=76.59 (1)
式中,GT为模拟地温值,LONG为经度,LAT为纬度,H为高程。
将此主体模型用于全部49个钻孔的地温计算和模拟,结果发现,源区西部2个阳坡地形孔(MD-Y1、MD-Y2)的模拟温度低于实测温度0.3ºC。进一步深入分析发现,源区西部山区钻孔中,MD-3和MD-Y1基本位于相同海拔高度的平地和山区地形条件下,二者的实测地温相差约0.3ºC。由此认为,基于此主体模型对区域年均地温格局的模拟降低了阳坡地形条件下的冻土地温值。因此,在主体模型模拟的基础上,对阳坡地形多年冻土地温值进行单独调整,建立阳坡地形条件下的微调模型(公式2)。
GTS=GT+0.3 (2)
式中,GTS为阳坡地形条件下多年冻土地温值,GT为模拟地温值。
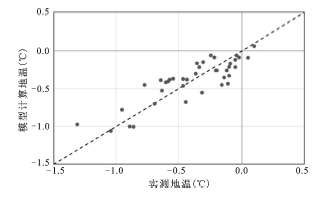
在此基础上,将参与模型构建的多年冻土钻孔点的模拟结果与实测结果进行对比分析,结果表明,参与模型构建的多年冻土钻孔实测地温值与年均地温值均具有较好的一致性,表明本模型用于黄河源区多年冻土年均地温空间分布格局的模拟具有较大的可行性(图2)。
图2 黄河源区多年冻土钻孔点实测地温值与模拟地温值对比分析
Fig.2 The comparison between measured and modeled values of mean annual ground temperatures at permafrost boreholes in the source area of the Yellow River
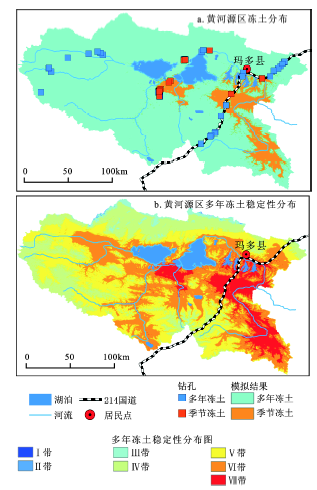
首先,以DEM数据为基础,采用主体模型在ArcMAP软件中对源区冻土地温宏观格局进行计算模拟。其次,根据各钻孔点地形特征计算结果,将阳坡区域定义为坡度大于5º、坡向介于112.5º~247.5º之间的区域。之后,对主体模型模拟结果进行阳坡地形校正,以0℃作为多年冻土和季节冻土的分界线对模拟结果进行冻土分布格局的划分。最后,以两湖南部钻孔断面揭示的不连续多年冻土区为基础对模拟结果进行精度验证和局部校正,最终得到源区冻土分布图(图3a)。结果表明,除湖泊覆盖区以外,源区多年冻土面积2.5×10⁴km2,约占整个源区面积的85.2%;季节冻土面积0.3×10⁴km2,约占整个源区面积的9.8%。季节冻土主要分布于两湖南部冲洪积平原区、源区东部黄河沿滩地和东南部热曲河谷及周边地区。
图3 黄河源区冻土分布图及多年冻土热力稳定性空间分布
Fig.3 The frozen soil distribution and the permafrost stability in the source area of the Yellow River
年均地温值计算结果表明,最小值为-4.47ºC,最大值为0.46ºC。以0.5ºC或1.0ºC为分类间隔对模拟地温值进行分类,分为Ⅰ带(GT≤-4.0ºC)、Ⅱ带(-4.0<GT≤-3.0ºC)、Ⅲ带(-3.0<GT≤-2.0ºC)、Ⅳ带(-2.0<GT≤-1.0ºC)、Ⅴ带(-1.0<GT≤-0.5ºC)、Ⅵ带(-0.5<GT≤0ºC)和Ⅶ带(GT>0ºC)7个地温带(图3b)。整体来看,黄河源区冻土为高温多年冻土类型,地温高于-2.0ºC以上的区域占整个区域的98%,而地温高于-1.0ºC以上的区域占整个区域的63%。低于-2.0ºC的区域基本分布于Ⅲ带,低于-3.0ºC的区域所占面积比例只有0.1%左右。各地温带面积比例依次为0.001%(Ⅰ带)、0.1%(Ⅱ带)、2.0%(Ⅲ带)、24.4%(Ⅳ带)、31.8%(Ⅴ带)、31.2%(Ⅵ带)和10.4%(Ⅶ带)。
4.1.1 模拟结果的精度分析
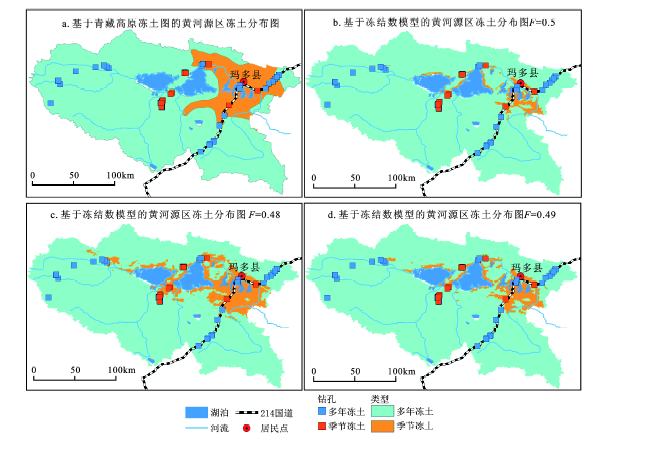
目前,可利用的黄河源区冻土分布图有青藏高原冻土图(1:300万)和青藏高原多年冻土本底调查项目完成的青藏高原冻土分布图(1:100万)。多年冻土本底调查项目是以中分辨率成像光谱仪(Moderate Resolution Imaging Spectroradiometer)MODIS地表温度(Land Surface Temperature)LST产品和自动气象站(Automatic Weather Station)AWS地表温度观测数据为基础,采用地表冻结数模型(公式3)对青藏高原冻土分布进行制图,空间分辨率为1 km。在此模型中,多年冻土定义为F≥0.5,季节冻土定义为F<0.5。从这两张图上分别截取出黄河源区部分,以全部49个钻孔及实测地温数据为基础、以0ºC地温作为划分季节冻土和多年冻土的标准,对3个图件的制图精度进行对比分析。
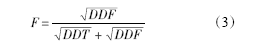
式中,F是冻结数模型值,DDF为冻结指数(℃∙d),DDT为融化指数(℃∙d)。
高原冻土图(1:300万)截取结果表明,黄河源区多年冻土面积2.4×10⁴km2、其所占面积比例为81.4%,季节冻土面积0.43×10⁴km2、其所占面积比例为14.4%,湖泊面积4.2%。由于比例尺偏小,高原冻土图上忽略了黄河源区一些面积比较小的湖泊。从图上看出,季节冻土主要分布于鄂陵湖以北、以东地区、国道214沿线长石头山路段和黄河沿路段。以钻孔为基础的精度分析结果表明,在鄂陵湖北部,3个钻孔中的2个多年冻土孔均位于高原冻土图的季节冻土区范围,因此,在这部分区域高原冻土图扩大了季节冻土的范围。更大的误差出现在国道214沿线长石头山路段和两湖南部地区。在214沿线长石头山路段,钻孔监测数据表明,此区域基本为连续多年冻土分布区,而高原冻土图将其化为季节冻土分布区。在两湖南部地区,钻孔揭示该区域为不连续多年冻土分布区,而高原冻土图将其划分为大片连续多年冻土区(图4a)。
冻结数模型的截取结果表明,黄河源区多年冻土面积2.5×10⁴km2、其所占面积比例为83.9%,季节冻土面积0.35×10⁴km2、所占面积比例为12.0%。季节冻土大片分布于鄂陵湖东部、国道214沿线黄河沿路段(图4b)。但是由于该模型结果取决于F值的取值范围,如果将划分多年冻土和季节冻土的界限值定为0.49和0.48,则黄河源区的冻土分布格局会出现较大变化(图4c、4d),鄂陵湖东侧季节冻土由连续分布变得不连续,两湖南部的区域也会出现相同的变化趋势。由此可以判断,这些区域多年冻土基本处于临界状态,这部分区域也是冻土制图中的难点所在。
除此以外,本模型模拟结果在热曲区域(图中东南角)有较大出入(图4a)。高原冻土图(1:300万)和冻结数模型模拟结果均将该区域划为多年冻土区,而本文研究结果显示该区域为季节冻土区,主要是经度、纬度、高程3个要素在这个区域均为低值的原因。此外,在鄂陵湖东侧,本模型模拟的多年冻土面积也要远大于其他研究结果,所有这些区域都需要进一步核实。但是,整体上来说,相比于上述2项研究结果,本文研究结果基于实测数据,因此,与实测数据有较高的吻合性,冻土分布图的模拟精度也最高。
图4 黄河源区已有冻土分布
Fig.4 The existed frozen soil distribution in the source area of the Yellow River
4.1.2 黄河源区多年冻土分布的影响因素分析
20世纪70年代左右,中国的冻土学者就已经提出青藏高原多年冻土分布的“三向地带性”特征,即经度、纬度和高程因素共同作用下的多年冻土空间分布规律[6]。但是受数据、研究区域特征等条件的制约,已有的基于经验-统计方法为基础的区域多年冻土分布模拟均提出了纬度和高程因素的重要性(如青藏公路/铁路沿线、214国道沿线等)[7,8,14],尚没有研究将经度因素的重要性以定量的方式表现出来。其主要原因在于它们是以工程走廊沿线为研究对象,区域特征主要表现为南北方向上的纬度变化和垂直方向上的高程变化。因此,所获取的实测数据不足以揭示经度方向上由于气候干湿特征所引起的多年冻土空间分布变化。
在黄河源区,经向上跨越大约3°,纬向上跨越大约2.5°,整个区域高程变化在4 200~5 245 m间,为研究多年冻土空间分布特征的“三向地带性”规律提供了良好的区域基础。更重要的是,我们所获取的实测采样点分别位于源区的东、中、西部的南部和北部地区,因此,为揭示多年冻土分布的“三向地带性”特征奠定了良好的区域和数据基础。统计分析结果也证明,影响黄河源区多年冻土年均地温空间变化的因素为纬度、经度和高程,且纬度的作用要大于经度的作用。由此看出,纬度变化所引起的热量变化相对于经度变化所引起的干湿条件变化起作用要大很多。
基于大量的实测数据分析了黄河源区多年冻土形成与分布特征,并对整个源区多年冻土及其热力稳定性分布格局进行了模拟。研究结果如下:
1) 基于钻孔点的实测数据分析结果表明,源区中部多年冻土地温变化可以归结为:低于4 300 m的平原区,多年冻土多不发育;高于4 350 m的山区,局地地形对多年冻土的形成与分布作用显著。除阳坡地形外,多年冻土均比较发育;介于4 300~
4 350 m的低山丘陵和平原区,局地地形、地表植被、土壤湿度和水分条件等因素共同决定着多年冻土的形成和分布格局。
2) 黄河源区多年冻土年均地温宏观分布格局是经度、纬度和高程宏观因素作用的结果,这3个要素可以解释实测地温数据76.59%的变化,由此建立黄河源区多年冻土分布的主体模型(公式1);另外,局地阳坡地形也对多年冻土发育及其地温特征影响显著,高于同等海拔高度阴坡和平地地形钻孔约0.3ºC。由此,建立阳坡地形条件下的微调模型(公式2)。
3) 主体模型和微调模型的模拟结果表明,黄河源区多年冻土年均地温最小值为-4.47ºC,最大值为0.46ºC。以0ºC作为划分季节冻土和多年冻土的标准和界限,则多年冻土面积2.5×10⁴km2,约占整个源区面积的85.1%;季节冻土面积0.3×10⁴km2,约占整个源区面积的9.7%,且季节冻土主要分布于两湖南部冲洪积平原区、源区东部黄河沿滩地和东南部热曲河谷及周边地区。进一步以0.5ºC或1.0ºC为分类间隔对多年冻土的热力稳定性进行分类,分为Ⅰ带(GT≤-4.0ºC)Ⅱ带(-4.0<GT≤-3.0ºC)、Ⅲ带(-3.0<GT≤-2.0ºC)、Ⅳ带(-2.0<GT≤-1.0ºC)、Ⅴ带(-1.0<GT≤-0.5ºC)、Ⅵ带(-0.5<GT≤0ºC)和Ⅶ带(GT>0ºC)7个地温带和稳定性类型,各类型所占面积比例依次为0.001%、0.1%、2.0%、24.4%、31.8%、31.2%和10.4%;
4) 由于多年冻土的地下埋藏特征使得冻土分布制图成为一项复杂的工作,而实测数据相对较少、钻孔点不能覆盖所有典型区域等因素导致冻土图的精度验证工作存在较大难度。本文研究结果与已有冻土图的对比分析结果表明,在源区的东南部热曲河谷及周边地区、鄂陵湖东部等区域由于缺乏实测钻孔信息,对这些区域的多年冻土分布制图精度仍有待进一步考证。
致谢: 本文所使用的青藏高原冻土分布图(1:300万)矢量数据和数字地貌数据(1:100万)来源于“黑河计划数据管理中心”(http://westdc.westgis.ac.cn);所使用冻结数模型模拟结果来源于青藏高原多年冻土本底调查项目(编号:2008FY110200)。
The authors have declared that no competing interests exist.
| [1] |
Recent advances in mountain permafrost research [J].https://doi.org/10.1002/ppp.1772 Magsci [本文引用: 1] 摘要
<p>Knowledge of the thermal state of mountain permafrost has greatly increased since 2007 with the establishment of numerous new monitoring stations around the world. Data collected at these sites have pointed to longer-term changes in ground temperatures, which seem to have increased during the last two to three decades in cold permafrost, while in ground close to 0°C the near-surface ice content has restricted warming and similar trends are not apparent. Modelling of mountain permafrost has developed greatly, driven by general circulation models or gridded temperature maps, through both predictive methods and spatial equilibrium and transient approaches. The spatial resolution of climate parameters, which is normally much coarser than the spatial heterogeneity of alpine environments, presents a major problem for modelling studies. This is a fundamental challenge for future research. Copyright © 2013 John Wiley & Sons, Ltd.</p>
|
| [2] |
Permafrost-thaw-induced land-cover change in the Canadian subarctic: implications for water resources [J].https://doi.org/10.1002/hyp.7894 URL 摘要
Not Available
|
| [3] |
Progress in permafrost hydrology in the new millennium [J].https://doi.org/10.1002/ppp.613 URL 摘要
ABSTRACT Increased attention directed at the permafrost region has been prompted by resource development and climate change. This review surveys advances in permafrost hydrology since 2000. Data shortage and data quality remain serious concerns. Yet, there has been much progress in understanding fundamental hydrologic processes operating in a wide range of environments, from steep mountainous catchments, to the Precambrian Shield with moderate relief, to the low-gradient terrain of plains, plateaus and wetlands. Much of the recent research has focused on surface water, although springs and groundwater contribution to streamflow have also been studied. A compendium of water-balance research from 39 high-latitude catchments reveals the strengths and limitations of the available results, most of which are restricted to only a few years of study at the small watershed scale. The response of streamflow to climate receives continued if not increasing attention, from the occurrence of extreme hydrologic events to the changing regimes of river flow at a regional scale. The effect of climate change and the role of permafrost on the changing discharge of large boreal rivers are major topics for further investigation. Extended field and modelling research on physical processes will improve knowledge of permafrost hydrology and enhance its relevance to societal needs. Copyright 漏 2008 John Wiley & Sons, Ltd.
|
| [4] |
Permafrost degradation and its environmental effects on the Tibetan Plateau: A review of recent research [J].https://doi.org/10.1016/j.earscirev.2010.07.002 URL [本文引用: 1] 摘要
A significant portion of the Tibetan Plateau is underlain by permafrost, and is highly sensitive to climate change. Observational data from recent Chinese investigations on permafrost degradation and its environmental effects in the Tibetan region indicate that a large portion of the Tibetan Plateau has experienced significant warming since the mid-1950s. The air temperature increase is most significant in the central, eastern, and northwestern parts of the Plateau. The warming trend in the cold season was greater than that in the warm season. The duration of seasonal ground freezing has shortened due to the air temperature increase in winter. Numerical simulations indicate that air temperature on the Plateau will continue to increase in the 21st century. Significant warming has resulted in extensive degradation of permafrost. Over the last 3002years, a 2502m increase in the lower altitudinal occurrences of permafrost has taken place in the north. In the south the increase is 50–8002m over the past 2002years. Active-layer thickness and mean annual ground temperature have increased by 0.15–0.5002m during 1996–2001 and by 0.1–0.502°C during the last 3002years on the Tibetan Plateau, respectively. Widespread permafrost degradation has already caused environmental deterioration. Extensive desertification processes are apparent in the eastern and western portions of the Tibetan Plateau, with the area occupied by desert increasing annually by about 1.8%. With rapid retreat and thinning of permafrost, large carbon pools sequestered in permafrost could be released to increase net sources of atmospheric carbon, creating a positive feedback and accelerated warming. Damage to human infrastructure is also caused by frost heave, thaw settlement, and thaw slumping in the permafrost-affected region. The impact of permafrost degradation on energy and water exchange processes between the ground and atmosphere require further examination. Large-scale intensive monitoring networks, remote sensing investigations, and models for frozen soil are needed to clarify regional details of climate change, permafrost degradation, and their environmental effects.
|
| [5] |
气候变化对中国多年冻土和寒区环境的影响 [J].https://doi.org/10.3321/j.issn:0375-5444.2000.05.004 URL [本文引用: 1] 摘要
中国的多年冻土总面积为2.15×10^6km^2,主要分布在高海拔地区40年来,随寒区经济的快速发展和资源、环境问题的日益突出,冻土和寒区气候变化研究获得了长足的进展。我国大部分地区的多年冻土退缩趋势明显。21世纪,受气候变暖和人为活动的共同影响,青藏高原和东北地区北部多年冻土将大幅退缩。冻土广泛退缩将对中国的寒区经济和环境产生重要影响。但是,冻退缩及其对环境的影响还存在很大的不确定性。
Impacts of climnatic change on permafrost and cold regions environments in China. https://doi.org/10.3321/j.issn:0375-5444.2000.05.004 URL [本文引用: 1] 摘要
中国的多年冻土总面积为2.15×10^6km^2,主要分布在高海拔地区40年来,随寒区经济的快速发展和资源、环境问题的日益突出,冻土和寒区气候变化研究获得了长足的进展。我国大部分地区的多年冻土退缩趋势明显。21世纪,受气候变暖和人为活动的共同影响,青藏高原和东北地区北部多年冻土将大幅退缩。冻土广泛退缩将对中国的寒区经济和环境产生重要影响。但是,冻退缩及其对环境的影响还存在很大的不确定性。
|
| [6] |
中国区域冻土研究的回顾和展望 [J].
我国系统的区域冻土研究是从新中国成立以后才开始的。解放前只有少数日本人在东北做过一些零碎的调查工作。解放以后寒区的经济建设推动了冻土水文地质和工程地质的研究工作,同时也带动了区域冻土的研究。特别是东北大、小兴安岭森林资源的开发和水利工程的兴建,青藏公路及乌鲁木齐至库尔勒公路的修筑,揭开了区域冻土研究的序幕。通过三十年来区域冻土的研究工作,对我国多年冻土的分布及其影响因素的了解有了质的飞跃。从而确立了我国作为世界冻土第三大国的地位。
Review and prospect of regional geocryology in China.
我国系统的区域冻土研究是从新中国成立以后才开始的。解放前只有少数日本人在东北做过一些零碎的调查工作。解放以后寒区的经济建设推动了冻土水文地质和工程地质的研究工作,同时也带动了区域冻土的研究。特别是东北大、小兴安岭森林资源的开发和水利工程的兴建,青藏公路及乌鲁木齐至库尔勒公路的修筑,揭开了区域冻土研究的序幕。通过三十年来区域冻土的研究工作,对我国多年冻土的分布及其影响因素的了解有了质的飞跃。从而确立了我国作为世界冻土第三大国的地位。
|
| [7] |
基于年平均地温的青藏高原冻土分布制图及应用 [J].https://doi.org/10.3969/j.issn.1000-0240.2002.02.006 URL Magsci [本文引用: 2] 摘要
年平均地温是指多年冻土年较差为零的深度处的地温,是冻土分带划分的主要指标之一.利用青藏公路沿线钻孔实测年平均地温数据,进行回归统计分析,获取年平均地温与纬度、高程的关系,并基于该结果,结合TOPO30高程数据模拟得到整个青藏高原范围上的年平均地温分布.以年平均地温0.5℃作为多年冻土与季节冻土的界限,对比分析模拟图与青藏高原冻土图,除个别区域有较明显的差异,模拟结果图较好地体现了青藏高原冻土的分布情况.利用模拟结果,根据青藏高原多年冻土分带指标及寒区工程多年冻土区划指标,对青藏高原多年冻土分布进行了分带划分,并统计各分带面积;根据简化的冻土厚度计算公式,计算了青藏高原多年冻土的厚度分布.最后,利用数值预测方法的结果,在气候年增温0.04℃的背景下,对高原未来冻土分布进行了预测.
Mean annual ground temperature distribution on the Tibetan Plateau:permafrost distribution mapping and further application. https://doi.org/10.3969/j.issn.1000-0240.2002.02.006 URL Magsci [本文引用: 2] 摘要
年平均地温是指多年冻土年较差为零的深度处的地温,是冻土分带划分的主要指标之一.利用青藏公路沿线钻孔实测年平均地温数据,进行回归统计分析,获取年平均地温与纬度、高程的关系,并基于该结果,结合TOPO30高程数据模拟得到整个青藏高原范围上的年平均地温分布.以年平均地温0.5℃作为多年冻土与季节冻土的界限,对比分析模拟图与青藏高原冻土图,除个别区域有较明显的差异,模拟结果图较好地体现了青藏高原冻土的分布情况.利用模拟结果,根据青藏高原多年冻土分带指标及寒区工程多年冻土区划指标,对青藏高原多年冻土分布进行了分带划分,并统计各分带面积;根据简化的冻土厚度计算公式,计算了青藏高原多年冻土的厚度分布.最后,利用数值预测方法的结果,在气候年增温0.04℃的背景下,对高原未来冻土分布进行了预测.
|
| [8] |
Permafrost temperatures and thickness on the Qinghai-Tibet Plateau [J].https://doi.org/10.1016/j.gloplacha.2010.03.001 URL [本文引用: 3] 摘要
Based on permafrost temperature measurements from 190 boreholes along the Qinghai-Tibet Highway/Railway since the early 1960s, we present spatial variations of permafrost temperatures, thermal gradients, and thickness on the Qinghai-Tibet Plateau. Overall, permafrost temperatures at 15 m depth are higher than -4.0°C and about half of the permafrost has its temperature higher than -1.0°C. The lo...
|
| [9] |
大通河源区冻土地温模拟与分类特征分析 [J].
以大通河源区为研究区域,分析了植被对多年冻土分布的影响。以等效高程为基础,根据实测的多年冻土地温数据和植被调查数据,建立了不同植被类型条件下的冻土地温一等效高程关系模型。借助于TM遥感数据、DEM数据和GIS技术模拟了大通河源区植被覆盖区的多年冻土地温分布特征。以地温数据为基础,参照青藏高原多年冻土分带方案,对多年冻土的分类特征进行了研究。结果表明:大通河源区多年冻土年均地温为-8.66-1.72℃,多年冻土和季节冻土的面积比例分别为95%和5%,其中极稳定型、稳定型、亚稳定型、过渡型和不稳定型多年冻土各类型的面积比例依次为1%,12%,31%,35%和16%。
Modeling permafrost temperature distribution and analysing zoning characteristics of permafrost in the source regiona of the Datong River.
以大通河源区为研究区域,分析了植被对多年冻土分布的影响。以等效高程为基础,根据实测的多年冻土地温数据和植被调查数据,建立了不同植被类型条件下的冻土地温一等效高程关系模型。借助于TM遥感数据、DEM数据和GIS技术模拟了大通河源区植被覆盖区的多年冻土地温分布特征。以地温数据为基础,参照青藏高原多年冻土分带方案,对多年冻土的分类特征进行了研究。结果表明:大通河源区多年冻土年均地温为-8.66-1.72℃,多年冻土和季节冻土的面积比例分别为95%和5%,其中极稳定型、稳定型、亚稳定型、过渡型和不稳定型多年冻土各类型的面积比例依次为1%,12%,31%,35%和16%。
|
| [10] |
Satellite-based modeling of permafrost temperatures in a tundra lowland landscape [J].https://doi.org/10.1016/j.rse.2013.03.011 URL Magsci [本文引用: 1] 摘要
Remote sensing offers great potential for detecting changes of the thermal state of permafrost and active layer dynamics in the context of Arctic warming. This study presents a comprehensive feasibility analysis of satellite-based permafrost modeling for a typical lowland tundra landscape in the Lena River Delta, Siberia. We assessed the performance of a transient permafrost model which is forced by time series of land surface temperatures (LSTs) and snow water equivalents (SWEs) obtained from MODIS and GlobSnow products. Both the satellite products and the model output were evaluated on the basis of long-term field measurements from the Samoylov permafrost observatory. The model was found to successfully reproduce the evolution of the permafrost temperature and freeze-thaw dynamics when calibrated with ground measurements. Monte-Carlo simulations were performed in order to evaluate the impact of inaccuracies in the model forcing and uncertainties in the parameterization. The sensitivity analysis showed that a correct SWE forcing and parameterization of the snow's thermal properties are essential for reliable permafrost modeling. In the worst case, the bias in the modeled permafrost temperatures can amount to 5 degrees C. For the thaw depth, a maximum uncertainty of about +/- 15 cm is found due to possible uncertainties in the soil composition. (C) 2013 Elsevier Inc. All rights reserved.
|
| [11] |
Recent advances in permafrost modelling [J].https://doi.org/10.1002/ppp.615 URL [本文引用: 1] 摘要
Abstract This paper provides a review of permafrost modelling advances, primarily since the 2003 permafrost conference in Zürich, Switzerland, with an emphasis on spatial permafrost models, in both arctic and high mountain environments. Models are categorised according to temporal, thermal and spatial criteria, and their approach to defining the relationship between climate, site surface conditions and permafrost status. The most significant recent advances include the expanding application of permafrost thermal models within spatial models, application of transient numerical thermal models within spatial models and incorporation of permafrost directly within global circulation model (GCM) land surface schemes. Future challenges for permafrost modelling will include establishing the appropriate level of integration required for accurate simulation of permafrost-climate interaction within GCMs, the integration of environmental change such as treeline migration into permafrost response to climate change projections, and parameterising the effects of sub-grid scale variability in surface processes and properties on small-scale (large area) spatial models. Copyright 漏 2008 John Wiley & Sons, Ltd.
|
| [12] |
79-
|
| [13] |
Modeling regional and local-scale permafrost distribution in Qinghai-Tibet Plateau using equivalent-elevation method [J].https://doi.org/10.1007/s11769-012-0520-6 Magsci [本文引用: 1] 摘要
Abstract<br/><p class="a-plus-plus">This study proposes an equivalent-elevation method to evaluate the integrated effects of latitude and elevation on regional and local-scale permafrost distribution in the Qinghai-Tibet Plateau, and to model the general permafrost-distribution patterns in regional and local-scale area. It is found that the Gaussian curve—an empirical model describing the relation between variations of altitudinal permafrost lower limit (PLL) and latitude in the Northern Hemisphere—could be applied in regional- and local-scale areas in the Qinghai-Tibet Plateau in a latitude-sensitive interval of 30°-50°N. The curve was then used to evaluate the latitudinal effect on permafrost distribution through transforming the latitudinal effect into a kind of altitudinal difference of PLL. This study then calculated the local equivalent-elevation value by overlaying the altitudinal difference of PLL onto real elevation at a certain location. The equivalent-elevation method was verified in an experimental subwatershed of the Qinghai-Tibet Plateau. However, feasibility of the method should be further tested in order to extend for future studies. The use of equivalent-elevation values can build a platform for comparing the regional general permafrost distribution in the plateau, and for basing further evaluations of local factors’ effects on regional permafrost distribution.</p><br/>
|
| [14] |
Characteristics of permafrost along Highway G214 in the Eastern Qinghai-Tibet Plateau [J].https://doi.org/10.1007/s11629-014-3207-x URL [本文引用: 2] 摘要
The characteristics of the permafrost along National Highway No. 214 (G214) in Qinghai province (between kilometer markers K310 and K670), including the distribution patterns of permafrost and seasonally frozen ground (SFG), ground ice content and mean annual ground temperature (MAGT), were analyzed using a large quantity of drilling and measured ground temperature data. Three topographic units can be distinguished along the highway: the northern mountains, including Ela Mountain and Longstone Mountain; the medial alluvial plain and the southern Bayan Har Mountains. The horizontal distribution patterns of permafrost can be divided into four sections, from north to south: the northern continuous permafrost zone (K310-K460), the island permafrost zone (K460-K560), the southern continuous permafrost zone (K560-K630), and the discontinuous permafrost zone (K630-K670). Vertically, the permafrost lower limits (PLLs) of the discontinuous zone were 4200/4325 m, 4230/4350 m, and 4350/4450 m on the north-facing/south-facing slopes of Ela Mountain, Longstone Mountain and Bayan Har Mountains, respectively. The permafrost was generally warm, with MAGTs between -1.000°C and 000°C in the northern continuous permafrost zone, approximately -0.500°C in the island permafrost zone, between -1.500°C and 000°C in the southern continuous permafrost zone, and higher than -0.500°C in the discontinuous permafrost zone. In contrast, the spatial variations in ground ice content were mainly controlled by the local soil water content and lithology. The relationships between the mean annual air temperature (MAAT) and the PLLs indicated that the PLLs varied between -3.300°C and -4.100°C for the northern Ela and Longstone Mountains and between -4.100°C and -4.600°C in the southern Bayan Har Mountains.
|
| [15] |
基于分区和多元数据的青藏高原温泉区域多年冻土分布研究 [J].
<p>以野外勘探、室内理论分析与建模为主要研究方法, 以数字高程模型(GDEM)和实测数据为基础进行统计分析, 发现坡向对多年冻土分布具有重要影响。针对青藏高原温泉区域地形的复杂性, 基于分区的方法将研究区分为平原区和山区两个地形区。对于平原区来说, 考虑到苦海湖泊对多年冻土的影响, 将苦海滩地单独划出并采用专家知识完成冻土制图, 其余平原区采用建立的地温模型进行冻土制图;对于山区来说, 通过定量化研究坡向对冻土地温的影响建立了基于坡向调整作用下的地温模型, 应用此模型完成了山区的冻土分布图。以地温作为冻土类型划分的依据, 分析了研究区域冻土的空间分布与特征, 结果表明:多年冻土的分布面积为1 681.4km2, 占整个区域的66.7%, 其中, 过渡型和亚稳定型多年冻土为主要多年冻土类型, 两者占整个研究区域的50.8%, 其次为不稳定型多年冻土(11.4%), 稳定型和极稳定型多年冻土的面积比例相对较小(4.4%和0.2%)。从空间分布格局来看, 冻土分布具有明显的垂直分带特征, 随着海拔高度的升高, 冻土地温逐渐降低, 冻土类型依次经历季节冻土-不稳定型多年冻土-过渡型多年冻土-亚稳定型多年冻土-稳定型多年冻土-极稳定型多年冻土的变化。</p>
Permafrost distribution using sub-region classification and multivariate data in the Wenquan area over the Qinghai-Tibet Plateau.
<p>以野外勘探、室内理论分析与建模为主要研究方法, 以数字高程模型(GDEM)和实测数据为基础进行统计分析, 发现坡向对多年冻土分布具有重要影响。针对青藏高原温泉区域地形的复杂性, 基于分区的方法将研究区分为平原区和山区两个地形区。对于平原区来说, 考虑到苦海湖泊对多年冻土的影响, 将苦海滩地单独划出并采用专家知识完成冻土制图, 其余平原区采用建立的地温模型进行冻土制图;对于山区来说, 通过定量化研究坡向对冻土地温的影响建立了基于坡向调整作用下的地温模型, 应用此模型完成了山区的冻土分布图。以地温作为冻土类型划分的依据, 分析了研究区域冻土的空间分布与特征, 结果表明:多年冻土的分布面积为1 681.4km2, 占整个区域的66.7%, 其中, 过渡型和亚稳定型多年冻土为主要多年冻土类型, 两者占整个研究区域的50.8%, 其次为不稳定型多年冻土(11.4%), 稳定型和极稳定型多年冻土的面积比例相对较小(4.4%和0.2%)。从空间分布格局来看, 冻土分布具有明显的垂直分带特征, 随着海拔高度的升高, 冻土地温逐渐降低, 冻土类型依次经历季节冻土-不稳定型多年冻土-过渡型多年冻土-亚稳定型多年冻土-稳定型多年冻土-极稳定型多年冻土的变化。</p>
|
| [16] |
黄河源区多年冻土温度及厚度研究新进展 [J].
利用新布设的冻土孔及原有冻土资料,分析黄河源区冻土温度和厚度的空间分布。源区实测多年冻土年均地温最低为-1.81℃,冻土最厚74m,均位于巴颜喀拉山北坡的查拉坪。214国道(K445-K604段)沿线多为高温多年冻土(年均地温>-1℃),但巴山北坡海拔4520m、布青山海拔4300m以上,年均地温低于-0.5℃。巴山北坡海拔4610m、布青山海拔4420m以上,年均地温低于-1℃。巴山北坡海拔每升高100m,年均地温减少0.47~0.75℃,冻土厚度增加16~25m;纬度向北增加1°,年均地温减少0.85℃,冻土厚度增加20~30m。
New progress on permafrost temperature and thicknessin the source area of the Huanghe River.
利用新布设的冻土孔及原有冻土资料,分析黄河源区冻土温度和厚度的空间分布。源区实测多年冻土年均地温最低为-1.81℃,冻土最厚74m,均位于巴颜喀拉山北坡的查拉坪。214国道(K445-K604段)沿线多为高温多年冻土(年均地温>-1℃),但巴山北坡海拔4520m、布青山海拔4300m以上,年均地温低于-0.5℃。巴山北坡海拔4610m、布青山海拔4420m以上,年均地温低于-1℃。巴山北坡海拔每升高100m,年均地温减少0.47~0.75℃,冻土厚度增加16~25m;纬度向北增加1°,年均地温减少0.85℃,冻土厚度增加20~30m。
|
| [17] |
黄河源区冻土特征及退化趋势 [J].
<FONT face=Verdana>黄河源区位于青藏高原多年冻土区东北部边缘地带, 是季节冻土、岛状多年冻土和在大片连续多年冻土并存地带. 多年冻土层在垂向分布上有衔接状和不衔接状两大类. 不衔接状又可分为浅埋藏(<8m)、深埋藏(>8m)和双层多年冻土等形式. 从20世纪80年代以来, 源区气温以0.02 ℃<I>.</I>a<SUP>-1</SUP>增温率持续上升, 人类经济活动日益增强, 导致冻土呈区域性退化. 多年冻土下界普遍升高50~80 m, 最大季节冻深平均减少了0.12 m, 浅层地下水温度上升0.5~0.7 ℃. 冻土退化总体趋势是由大片状分布逐渐变为岛状、斑状分布, 多年冻土层变薄, 冻土面积缩小, 融区范围扩大. 部分多年冻土岛完全消失变为季节冻土.</FONT>
Features and degradation of frizen ground in the source area of the Yellow River,China.
<FONT face=Verdana>黄河源区位于青藏高原多年冻土区东北部边缘地带, 是季节冻土、岛状多年冻土和在大片连续多年冻土并存地带. 多年冻土层在垂向分布上有衔接状和不衔接状两大类. 不衔接状又可分为浅埋藏(<8m)、深埋藏(>8m)和双层多年冻土等形式. 从20世纪80年代以来, 源区气温以0.02 ℃<I>.</I>a<SUP>-1</SUP>增温率持续上升, 人类经济活动日益增强, 导致冻土呈区域性退化. 多年冻土下界普遍升高50~80 m, 最大季节冻深平均减少了0.12 m, 浅层地下水温度上升0.5~0.7 ℃. 冻土退化总体趋势是由大片状分布逐渐变为岛状、斑状分布, 多年冻土层变薄, 冻土面积缩小, 融区范围扩大. 部分多年冻土岛完全消失变为季节冻土.</FONT>
|
| [18] |
黄河源区多年冻土退化及其环境反映 [J].
基于黄河源区多年冻土退化引起的生态环境地质问题与效应的实际资料,明确了多年冻土的生态环境功能和多年冻土退化引起的危害.提出多年冻土退化使赋存于高寒草地和维系高寒草地生长发育的多年冻土表部的冻结层地下水水位持续下降或消失,从而引发和加剧了高寒草地的"三化"(草地退化、沙漠化和盐渍化)和水环境变异,是导致黄河源区占主导地位的高寒草甸失水向沙漠化草地和"黑土滩"型次生裸地退化的主要地质原因.
Permafrost drgradation and its environmental sequent in the souece regions of the Yellow River.
基于黄河源区多年冻土退化引起的生态环境地质问题与效应的实际资料,明确了多年冻土的生态环境功能和多年冻土退化引起的危害.提出多年冻土退化使赋存于高寒草地和维系高寒草地生长发育的多年冻土表部的冻结层地下水水位持续下降或消失,从而引发和加剧了高寒草地的"三化"(草地退化、沙漠化和盐渍化)和水环境变异,是导致黄河源区占主导地位的高寒草甸失水向沙漠化草地和"黑土滩"型次生裸地退化的主要地质原因.
|
| [19] |
|
| [20] |
Changes in frozen ground in the Source Area of the Yellow River on the Qinghai-Tibet Plateau, China, and their eco-environmental impacts [J]. |
| [21] |
高精度热敏电阻温度传感器的技术改进及使用特点 [J].
<FONT face=Verdana>详细介绍高精度热敏电阻温度传感器的制作和标定技术改进及使用特点. 该温度传感器使用热敏电阻作为主要元件,利用其电阻值随温度变化而显著变化的特点,直接将温度的变化转为电量的变化. 改进后的热敏电阻温度传感器具有体积小、使用方便、对引线及二次仪表的要求低、标定时间短、测温精度高、稳定可靠、使用范围广、重复性好、能够实现远距离测量等特点,测温精度优于0.05℃.</FONT>
High-precision thermistor temperature sensor:Technological improvement and application.
<FONT face=Verdana>详细介绍高精度热敏电阻温度传感器的制作和标定技术改进及使用特点. 该温度传感器使用热敏电阻作为主要元件,利用其电阻值随温度变化而显著变化的特点,直接将温度的变化转为电量的变化. 改进后的热敏电阻温度传感器具有体积小、使用方便、对引线及二次仪表的要求低、标定时间短、测温精度高、稳定可靠、使用范围广、重复性好、能够实现远距离测量等特点,测温精度优于0.05℃.</FONT>
|
| [22] |
|
| [23] |
中国西部1:100万数字地貌数据集[Z] .Geomorphological map of western China(1:1000000).Institute of Geographic Sciences and Natural Resources Research, |
| [24] |
|

/
| 〈 |
|
〉 |