王成金 , 程佳佳
, 程佳佳
Wang Chengjin, Cheng Jiajia
中图分类号: K902
文献标识码: A
文章编号: 1000-0690(2016)06-0803-10
收稿日期: 2015-05-28
修回日期: 2015-10-23
网络出版日期: 2016-10-20
版权声明: 2016 《地理科学》编辑部 本文是开放获取期刊文献,在以下情况下可以自由使用:学术研究、学术交流、科研教学等,但不允许用于商业目的.
基金资助:
作者简介:
作者简介:王成金(1975–),男,山东沂水人,博士,研究员,主要从事交通地理与区域发展的研究。E-mail: cjwang@igsnrr.ac.cn
展开
摘要
在全国尺度上评价1988~2030年中国高速公路可达性的空间格局及演化。基于交通旅行时间和最短时间路径的可达性模型设计,刻画了中国高速公路网的扩张过程,评价各时段中国高速公路网的通达性及演变,包括连通城镇、交通时间和时间区位系数等,分析各地区可达性的空间差异及变化特征,以及各时段内可达性的变化差异,重点识别可达性与区位受损和收益的突出区域;结合人口和经济等属性指标,评价各城市的综合发展潜能及变化。研究发现,高速公路建设拉近了边缘地区与核心地区的时间距离,西部地区的交通条件得到了很大改善,但并没有改变各城市的区位优劣水平,而且导致城市间发展潜力的差距更加不平衡。
关键词:
Abstract
This article aims to examine how the size, connectivity and accessibility of the expressway network have evolved over time on a national scale and further influence the developing potential for a region during the past 25 years and future 15 years. Travel time and the shortest time path model were applied for this purpose. We describe the growth of the expressway network in China and analyze the development features, and evaluate the evolution of expressway network accessibility in each period including connectivity, travel time and location coefficient, and comparatively analyze their differences over time and space. In particular, we analyze the effect of expressways on spatial accessibility and location conditions, and identify which developments are likely to improve or detract from accessibility and location conditions. Furthermore, the composite developing potential for cities is evaluated by considering the population and regional gross domestic product to investigate the influence of expressways on regional development, and their changes before and after expressway construction is analyzed. The results show that the expressway construction has produced the obvious spatio-temporal convergence by reducing the travel time among the cities and brought the peripheral regions closer to the central regions and greatly improved the transport conditions in the western China which produce a continuously shrinking China. The accessibility of cities shows a spatial pattern of core-peripheral concentric circle configuration, and the Huanghe-Huaihe River Plain, the Guanzhong Plain, the middle and lower reaches of the Changjiang River have been the regions with the best accessibility but the worst conditions of accessibility are recorded in the northwestern and northeastern margins in China. The expressway has produced interference on the original accessibility with a certainly steady status established by traditional highways. In the early period, with the initially continuous construction of expressway, this interference was likely to be more obvious. But with the fully interconnected networking of expressway, it setbacks rapidly and the accessibility difference among the nodes also returns to original level, because expressway network becomes a new transport infrastructure increasingly to replace the existing highway. However, the expressways not only could not change the superior/poor level of locational condition for a city in the whole China but also increased the imbalances in development opportunities among cities.
Keywords:
交通设施是决定区域发展优势的重要手段,是改变区域空间结构的显著力量[1]。中国一直将高速公路作为刺激经济增长的重要途径而大规模建设,现已形成覆盖全国的空间网络且持续建设新线。高速公路网成为大中城市实现高效社会经济联系的重要途径[2],直接影响了传统公路建立起来的空间网络与通达性,促使区域之间的时空距离“塌陷”甚至形成了“不断缩小的国家”[3]。交通网络引发的空间效应成为交通地理的长期研究主题[4],研究表明交通设施导致时空收敛,而可达性变化可反映这点[3]。许多指标可用来测算可达性,其中平均旅行时间、经济潜力、日常可达性,不同指标提供了互补性的信息[2,5~8],但可达性的效应仍存在争议。高速公路网的长期时空效应显著改变了一个地区、国家的经济地理,但这种效应仍未能得到充分关注[9]。但高速铁路的发展却引起了许多学者的关注[10]。此外,交通能力与交通改善如何影响落后地区的经济社会一直存在争议[11,12]。总体来看,多数研究拒绝交通改善与经济发展间因果关系的简单分析,而追求更细节的研究。21世纪之前,中国关于高速公路的研究很少,但Loo对珠江三角洲可达性的研究中简单涉及了高速公路[13]。随着高速公路的持续建设,许多学者开始关注其发展并形成了部分研究。部分学者关注高速公路网的发展过程,凝练网络布局模式 [14~19],但研究对象[12,14]和研究范围都很有限 [3,14,20,21],基本限定在高速公路网大规模扩张之前。近年来,地方政府为了GDP而大规模建设高速公路,这促使中国高速公路呈现积极甚至失控的建设态势,而且2013年修编的国家高速公路网规划将最终目标增长到13.6万km2,对该完整网络的评价是必要的,尤其是分析过去、当前与未来高速公路网可达性的差异。鉴于此,本文在刻画高速公路网拓展与连通性的基础上,分析中国高速公路网可达性的空间格局及演化,探讨其时空收敛效应,考察其区位优势变化,揭示高速公路建设对区域发展的影响。
交通网络、空间节点与时间尺度是可达性评价的基本要素,在评价对象已定的背景下后两者的选择更关键。① 在全国尺度上评价交通网的可达性,地级节点是理想的评价单元,本文选择334个节点为评价单元,包括地级行政节点(包括副省级城市)和直辖市。② 公路网数据分为图形和里程数据。其中,高速公路里程数据源于各年份的《中国交通年鉴》[22],图形数据源于各年份的《中国高速公路及城乡公路网地图集》[23],未来高速公路数据源于国家与省级高速公路网规划。国省道图形数据源于国家基础地理信息中心网站(http://data.sbsm.gov.cn)。人口和GDP数据源于各省统计年鉴和《中国城市统计年鉴》[24]。③ 除港澳台地区外,中国高速公路建设大都始于20世纪80年代中期,国家和省级规划表明中国高速公路网将在2030年彻底完成,因此本研究覆盖1988~2030年40多年的时间尺度。选择1988年、1997年、2003年、2013年和2030年为时间点进行分析,分别反映过去、当前、将来的高速公路发展与可达性[12]。1988年为基准年,因为该年份中国首条高速公路通车;1998年和2008年是中国通过交通投资而刺激经济发展、高速公路建设的转折期,1997年反映亚洲金融危机前的高速公路建设,2003年反映亚洲金融危机影响下的高速公路网快速扩张,2013年反映2008年世界金融危机影响下的高速公路网快速建设;2030年主要反映高速公路网的终极目标。
可达性为利用特定交通系统从某一区位到达特定区位的便捷程度[25]。高速公路主要是缩减节点间的交通时间但非改变物理距离,因此本文采用最短时间距离模型来评价可达性。设M为337个节点间最短时间路径构成的完全联系矩阵:
设tij为矩阵的基本元素,并满足下列条件,① 当i=j时,tij=0;②当节点i与j为相邻节点时,tij=tij0(tij0为两节点间的交通时间)。
其他tij用最短路径方法,设n为节点数量,可得:
评价之前需要假设以下规则。① 高速公路建设始于20世纪80年代中期,早期的高速公路是相互割裂且不连通的,需要借助国道和省道的路网连接。② 计算过程忽略城市和渡口处的时间损耗。③ 各等级路线有不同的车辆行驶速度,依据《公路工程技术标准(JTGB01-2003)》设定各等级公路的行驶速度:高速公路为120 km/h,国道取80 km/h,省道取60 km/h。基于上述假设,采用下述公式计算节点间的最短交通时间。
式中,lij为节点i到j的公路交通距离,lijk为节点i到j的k类公路线距离,vk为第k种公路线的行驶速度,tijk为节点i到j的交通时间。
tij为节点i到j的最短路径所花费的最小时间。在此基础上利用GIS将线路和节点信息进行拓扑计算,建立M矩阵,并将节点i的总交通时间定义为Ti,即节点i到其他节点的交通时间之和即可达性,也是区位指标[2,26]。其值越小,i点的可达性越好,交通区位就越好[27]。
矩阵M的总交通时间T为:
为反映各节点在区域中的区位优劣程度及对比各时间断面的可达性,设计可达性系数,为各节点最短交通时间与网络平均交通时间的比值,如公式(8)所示。
式中,ACi为节点i的可达性系数,其值越小,交通区位越好。ACi>1,节点i的区位劣于平均水平,反之高于全国平均水平,而ACi最小的节点为高速公路网的区位中心[27]。节点属性指标与可达性指标的结合反映了各节点的发展潜力[28,29],潜力计算如公式(9)所示:
式中,Pi表示节点i的潜力值,其值越高,发展潜力越大;Mj为节点j的质量,如人口(POPU)、地区生产总值(GDP);Cij表示节点i到j的交通时间;a为距离摩擦系数;n为节点个数。在全国尺度的可达性研究中,a一般取1[2,30]。对于Mj,采用公式(10)对节点的人口和经济因素进行集成。
交通设施的改善是区域发展的重要条件[31]。20世纪80年代末,中国建成了第一条高速公路,此后建设持续加快。1988~1997年,高速公路处于起步阶段,建设缓慢,规模有限,1997年里程仅为4 771 km;多数省区已有高速公路,但主要布局在华北、东北和华东及西南地区,仅有70个即21%的地级节点被连接(表1)。90年代中期后建设迅速,尤其在亚洲金融危机刺激政策的影响下,里程迅速增长,1999年突破1万km;2000年达1.6万km,2001年达1.9万km而居世界第二;这快速提高了连通性,连接地级节点增加到2003年的211个,辽鲁两省已实现省会到地市全部由高速公路连接。为了应对2008年世界金融危机,中国加大高速公路建设步伐,2013年增长到10.4万km,尤其2010~2013年间高速公路里程有惊人的增速。目前中国形成基本相互贯通而覆盖全国的网络,2013年连通城市达269个而比重为80.5%,比1997年增长17.3个百分点;部分大城市成为高速公路交汇的枢纽,包括哈尔滨、沈阳、北京、太原、郑州、武汉、广州、西安、重庆、成都;北京、天津、河北、上海、江西、海南、重庆、陕西等省已实现了省会至地级城市的高速公路连通,主要是沿海与中部省份;辽宁、山西、湖南、广西、四川的连通率超过90%,西部省区较低。随着高速公路网规划的持续实施,2030年高速公路规模将达18.5万km,连通319个节点,比重为95.5%,未来尚有15%的连接潜力。多数省份实现了省会至地级城市的连接,尚未连通的节点多分布在西北和西南及东北地区。
表1 1997~2030年中国高速公路网的地级城镇连通性
Table 1 Number of Prefecture-level region connected by expressway networks in China in 1997-2030
| 省区 | 1997年 | 2003年 | 2013年 | 2030年 | 省区 | 1997年 | 2003年 | 2013年 | 2030年 | 省区 | 1997年 | 2003年 | 2013年 | 2030年 |
|---|---|---|---|---|---|---|---|---|---|---|---|---|---|---|
| 北京 | 1 | 1 | 1 | 1 | 福建 | - | 6 | 8 | 9 | 重庆 | 1 | 1 | 1 | 1 |
| 天津 | 1 | 1 | 1 | 1 | 安徽 | 3 | 10 | 13 | 15 | 贵州 | 3 | 5 | 6 | 9 |
| 山西 | 2 | 8 | 10 | 11 | 江西 | 2 | 10 | 11 | 11 | 云南 | - | 6 | 10 | 16 |
| 河北 | 4 | 10 | 12 | 11 | 山东 | 5 | 14 | 14 | 17 | 西藏 | - | - | - | 5 |
| 内蒙古 | 2 | 5 | 10 | 12 | 河南 | 5 | 11 | 15 | 16 | 宁夏 | - | 2 | 2 | 3 |
| 辽宁 | 3 | 13 | 13 | 13 | 湖北 | 5 | 9 | 10 | 11 | 青海 | - | 2 | 3 | 8 |
| 吉林 | 3 | 3 | 7 | 8 | 湖南 | - | 11 | 13 | 14 | 陕西 | 4 | 8 | 10 | 10 |
| 黑龙江 | 3 | 6 | 11 | 11 | 广东 | 6 | 16 | 16 | 19 | 甘肃 | - | 6 | 9 | 12 |
| 上海 | 1 | 1 | 1 | 1 | 广西 | 2 | 8 | 13 | 13 | 新疆 | 1 | 3 | 9 | 14 |
| 江苏 | 2 | 11 | 11 | 13 | 海南 | 2 | 2 | 2 | 1 | 全国 | 70 | 211 | 269 | 319 |
| 浙江 | 3 | 8 | 9 | 11 | 四川 | 6 | 14 | 19 | 21 |
时空收敛效应最早由Janelle提出[32],指由于交通改善而带来旅行时间的缩减。高速公路对节点间的时间距离有重要影响[2]。高速公路建设以来,城市间交通时间呈现明显改善而逐年缩短,如表2所示,1988年国省道公路网下的总交通时间为2.7×10⁶h,经过25 a的高速公路建设,2013年缩短为1.7×10⁶h,缩减比例达36.2%,高速公路对时间成本降低的效益明显,形成了显著的时空收敛效应。不同时期,高速公路建设有不同速度,时空收敛效益也明显不同。1997年总交通时间为2.6×10⁶h,缩减幅度达5.1%,年均为0.51%,这是由于该时期高速公路多为断头路,时间效益小。1997~2003年是收敛效益最明显的时期,交通时间缩短幅度达18.3%,年均达2.6%。因此,高速公路快速建设促使城市间产生了持续的时空“塌陷”与“压缩”[29]。须关注的是,2003~2013年高速公路建设尽管更快,但交通时间缩短幅度达12.8%,年均为1.4%,与前期相比收敛效应下降,这同Li等的结论相似[12]。这表明随着高速公路的逐步成网,时间效益逐步下降。2030年总交通时间为1.55×10⁶h,比1988年缩减43.1%,但与2013年相比仅有6.9个百分点的改善空间。这表明如果高速公路网的骨架部分得到建设,随后的改善或新建路线的时空收敛趋于减弱[33]。表2表明其他交通时间指标的变化也反映了类似的发展规律,高速公路网大大缩短了城市间的交通时间[2],促使中国不断“缩小”,成为国土空间结构重组的显著力量。
表2 中国高速公路可达性的指标变化(h)
Table 2 Major indicators on travel time in China`s trunk road network
| 1988年 | 1997年 | 2003年 | 2013年 | 2030年 | ||
|---|---|---|---|---|---|---|
| 总交流时间 | 总规模 | 2726094 | 2587224 | 2086890 | 1740427 | 1552051 |
| 缩减规模 | 138870 | 500334 | 346463 | 51558 | ||
| 年均缩小 | 13887 | 71476 | 38496 | 6445 | ||
| 最大交流时间 | 总规模 | 18846 | 18635 | 17329 | 15854 | 10786 |
| 缩减规模 | 211 | 1306 | 1475 | 1276 | ||
| 年均缩小 | 21.1 | 187 | 164 | 160 | ||
| 最小交流时间 | 总规模 | 5534 | 5187 | 4103 | 3488 | 3198 |
| 缩减规模 | 347 | 1084 | 615 | 146 | ||
| 年均缩小 | 34.7 | 155 | 68 | 18 | ||
| 平均交流时间 | 总规模 | 8162 | 7746 | 6248 | 5210 | 4647 |
| 缩减规模 | 416 | 1498 | 1038 | 154 | ||
| 年均缩小 | 41.6 | 214 | 115 | 19 | ||
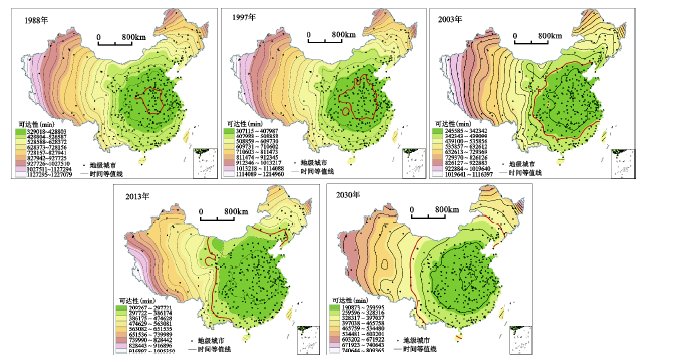
高速公路建设对国省道网建立的可达性体系产生了冲击,各时期时间曲线图产生了明显的空间分异,尤其是“过去”、“当前”和“将来”(本文中,“过去”指1988~2013年, “当前”指2013年,“将来”指2013~2030年)情景产生了明显分异[26](图1)。
图1 1988~2030年中国高速公路网可达性演化
Fig.1 Accessibility of China’s trunk road network during 1988~2030
1) 无论哪个时期,可达性格局均呈现空间非均衡性,由腹心地区向周边地区直到边境地区逐步衰减。在各时期,“核心-边缘”同心圈层结构明显,各城市的可达性存在差异,“核心”地区有很高的可达性而多数边缘节点有较低的可达性。其中,黄淮海平原、关中和长江中下游始终是可达性最高的区域,邻近地区有较高的可达性,并以此为中心向西北、东北和西南方向衰减。而西北和东北地区有最低的可达性,一定程度上造成这些地区的发展落后[28]。须关注的是,高速公路建设并未对国省道网的可达性格局产生颠覆性影响。
2) 时间等值线均呈现“由内向外”依次推移的模式,高速公路减少了交通时间而明显改善可达性,时空收敛效应显著。1988年腹心地区的可达性小于4×10⁵ min,东北地区介于5.5×10⁵~9×10⁵ min,西北地区介于5.5×10⁵~12×105 min而西南地区处于5.5×10⁵~7×10⁵ min,腹心和边缘地区的可达性差异明显。2013年可达性格局发生明显变化,腹心地区已改善为2.5×10⁵ min,缩减了一半,东北地区也缩减至4×10⁵~5.5×10⁵ min,近西部改善为3×10⁵~3.5×10⁵ min,西南区缩减为4×10⁵ min,尤其是乌鲁木齐-格尔木-香格里拉以东明显改善而均达1988年腹心地区的通达水平,但阿勒泰和阿里及喀什的可达性仍较低。因此,高速公路强化了可达性分异。2013~2030年,随着高速公路的持续建设的,腹心地区虽有改善但边缘地区将更容易通达,东北地区缩减至3×10⁵~4.5×10⁵ min,近西部改善为2.5×10⁵~3×10⁵ min,西南也缩减为3×10⁵~3.5×10⁵ min,但西北的阿里、喀什、伊利、阿勒泰及东北的三江平原仍处于5.5×10⁵~6.5×10⁵ min。总体上,高速公路的时空效应对改变可达性的地理模式有积极影响,促使国土不断“缩小”。图1表明,78.7%的城市集中在30×104~55×104 min等值线内。1988~1997年高速公路的快速建设对改变可达性结构影响较小,但集中的时间区段转变为30×104~50×104 min(76.1%)。此后,高速公路快速扩张显著改变了可达性结构,2003年274个城市介于25×104~45×104 min等值线内,而2013年85.6%的城市介于20×104~40×104 min等值线。须关注的是,2013~2030年间可达性结构的变化较小。
3) 持续的高速公路建设促使可达性结构明显变化。各年份的交通时间跨度不断内缩,1988~1997年高速公路对可达性的影响较小,1988年交通时间介于3.5×10⁵~12.5×10⁵ min,1997年仍保持该交通时间;此后交通时间明显缩减,2013年已缩至2.5×10⁵~10.5×10⁵ min,2030年将缩至2×10⁵~8.5×10⁵ min。这充分反映了高速公路建设对时空收效的促进效应。从各时间区段的覆盖面积看,低值时间线圈定的国土明显扩大,而高值时间线圈定的国土明显缩小,高速公路促使越多越多国土的交通时间缩小。覆盖国土最高的时间段从1988年的4×10⁵~4.5×10⁵ min转移到2003年的3.5×10⁵~4×10⁵ min,2013年为2.5×10⁵~3.5×10⁵ min,2030年将转移到2.5×10⁵~3×10⁵ min,越来越多的国土在更少的交通时间内完成社会经济交流。高速公路在可达性上产生了绝对的收益,为边缘地区的发展提供了更多的机遇[26]。
4) 各节点在时空收敛过程中有明显不同的获益水平。1988~2030年期间,腹心地区包括河南、山东、湖北、安徽、黄河中下游和长江中游成为可达性改善最低的地区,从时间收敛效应中获益最小;而位居东北、西北和西南及东南沿海国土边缘的城市却有最高的时间节约,成为时空收敛效应的最大受益者。须关注的是,这种模式同交通时间与区位系数的格局相反,边缘地区的交通时间改善最大但可达性最高的区域仍集中在腹心地区[12]。Gutierrez等在欧洲道路网的研究中也发现了类似的结论[34]。但高速公路在各时间段有不同的建设速度和规模,这对时间缩减幅度的分异产生影响。在1988~1997年高速公路起步阶段,时间收效显著的城市集中在“漠河-腾冲”界线以东,尤其是东北、环渤海、西南和东南沿海地区及京广高速沿线,而以西地区的时间改善较弱,该时期高速公路集中在沿海省份[12]。1997~2003年,东北、西南和东部沿海地区仍是时间收敛的显著区域;具体而言,北部湾、珠江三角洲、湖南、苏北、浙南-闽北、鲁西南的收益明显,河西走廊、湟水谷地和新疆开始受益。2003~2013年期间,时间缩减幅度大的城镇明显向西部转移;甘肃、四川、云南、新疆、宁夏、陕西及贵州为时间收敛最显著的地区,两广和福建也有明显受益。2014~2030年,主要受益者向东部(山东、安徽、河南、冀南、长三角)、中西南(粤西、广西、湖南和贵州)及新疆、青海转移。分析说明,前两个阶段扩大了沿海地区与内陆的差距,后两个阶段产生了相反的趋势[12]。
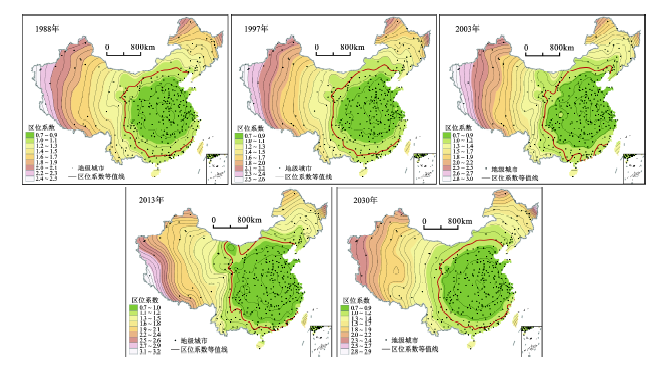
从整个网络看,区位条件是某节点相对于其他节点的比较,相对区位要比绝对区位更重要。交通时间缩短并不意味着区位的改善,而相对区位则常被认为是经济和人口增长的重要决定因素[2]。整个网络交通条件改善所产生的时空收效效应抹煞了单一节点的交通时间缩短。
1) 尽管各图有所不同,但比较发现城市间的时间区位形成基本的空间模式。无论哪个时期,节点的时间区位呈现明显的非均衡性,形成核心-边缘的同心圈层结构。腹心地区始终是区位系数最低的地区,包括河南、安徽、湖北、湖南及部分山东、河北、江西、四川、重庆,具有最优的区位条件;由腹心向外,区位系数断变大,区位优势逐步降低。空间上,边缘区主要分布在西北、西南和东北,但随着高速公路的建设,其范围不断缩小,而核心区不断扩大,尤其云南的区位不断改善并摆脱“边缘”特征。远西部及东北地区始终是区位结构的边缘。因此,尽管交通时间节约的绝对受益,但相对区位仍弱化。
2) 理论上,ACi最小的节点为区位中心,其他节点与该中心的时间距离越大其区位越差。1988年南阳具有最小的ACi而成为区位中心。随着东部和北方高速公路的建设,区位中心逐步东移、北移,1997年东移到信阳,随后北方高速公路的建设促使2003年区位中心北移到郑州。但随着全国高速公路网的完善,国道网建立的区位格局有所恢复,区位中心又转移到南阳,即使随着高速公路的继续完善,2030年区位中心仍为南阳。这表明网络演变保持了公路网建立起来的区位格局。
3) ACi=1等值线反映了全国平均水平的时间区位线。如图2所示,从各时间段看,该曲线的分布及圈定的范围变化较小,保持相对的稳定。1988年该曲线基本环绕在河北、内蒙、近西部及西江和东南沿海地区,该范围内的区位均优于全国平均水平,其他地区均劣于全国平均水平,尤其阿里和喀什等地区的区位最差,其系数高于2.3,东北地区的系数略高于西北地区。这表明高速公路建设虽改善各节点的交通条件,改变了其最短交通时间,但对相对区位的改善未产生明显影响,边缘地区仍保持“边缘”身份。
图2 中国地级城镇的时间区位系数格局及演化
Fig.2 Location coefficient of China`s prefecture-level city and evolution
4) 各节点的区位形成明显的分异结构,但各时期的变化较小。无论哪个时期,区位较差的城市为少数,大体保持在1/3的比例,1988年比重为36.8%,2013年为32.9%,2030年将达到35.9%。多数城市的区位条件高于全国平均水平,约占2/3。从系数区段看,城市主要集中在“0.6~1.4”区段内,其中0.7~1.1区段的节点最多,约占3/4。从区位系数的区段拉伸长度看,1988年较短,介于0.6~2.4间,1997年拓展到2.5,2003年进一步拓展到2.8,2013年拉伸到3.1,但2030年回归到2.4。这同前文分析相吻合。
5) 高速公路虽通过缩减各城市的交通时间而改变了其可达性,但是否改善其区位,需要进一步识别[2]。1988~2013年,高速公路改变了各节点的区位优劣程度,但变化不均衡。沿海地区、中部成为区位改变的受益者,云南、成渝地区、陕西及部分东部城市也是受益者,区位明显改善。区位相对劣化的城市多分布在中西部,尤其西藏、青海的区位不断劣化,甘肃、新疆、宁夏的城镇也呈类似特征,同时黑龙江、蒙东、吉林、雷州半岛及海南、广西、云南、贵州、湖南的部分城市也呈现区位弱化,这些城市是高速公路建设的受损者。这说明交通条件改善不一定能促使边缘地区减少边缘性。2013~2030年,区位恶化的城市将有所改善,尤其西藏和四川西部、青海处于明显改善过程,内蒙东部、云南、贵州和湖南也有明显改善,而中部和东部的区位有所劣化,广东以北、京广高速以东的中东部及东北的腹心区位下降明显。总体上,高速公路改善了西部、边境地区及山区的区位条件,东南沿海地区也得到改善,但中国腹心的区位不断下降,此外东北腹心的区位明显下降。因此,高速公路改善了国土边缘的区位,对这些地区的对外联系产生明显的时空收敛效益,但腹心地区的区位有所弱化,核心与边缘区的差距因高速公路而持续缩小。
变异系数(CV)是反映空间非均衡性的典型指标。高速公路导致的可达性变化是促进节点间交通时间的均衡化还是非均衡化即极化效应,可通过变异系数进行评价。结果显示,CV在研究时期内不断变化,但大致可以分为两个阶段,第一个阶段(1988~2003年)CV不断增长,而第二阶段(2003~2030年)为CV系数不断减小。
1988~1998年,公路网可达性的CV系数不断变化,1988年为0.312,高速公路建设加强了节点间的可达性分异水平,1997年增长至0.324。尤其是,经过1998年金融危机以来的高速公路快速建设,2003年提高到0.369,增长了4.5个百分点。因此,初期的高速公路建设明显改善了区域的通达性,但拉大了可达性结构的非均衡性,节点之间的可达性差异继续扩大,在一定程度上创造了区域发展差距不断扩大的条件。但随着高速公路的网络构筑与连通性增强,高速公路的空间优劣分异功能开始弱化,2013年可达性结构的非均衡性下降,CV系数降为0.355。这同Li等的研究结论类似[12]。而且,2013年以后的高速公路建设将继续推动非均衡性的降低,CV系数达31.3%,并回归到高速公路建设之前即1988年的水平,“未来情景”将回到“过去情景”。最大交通时间和最小交通时间的极差值变化也反映了这种趋势。这表明高速公路对原有并已达到某种稳定状态的可达性结构产生干扰作用,但这种干扰作用由其网络完善程度所决定;高速公路建设初期,干扰作用明显,并随着高速公路建设从局部影响扩展到全面影响,但随着高速公路的连通成网并完善,干扰作用迅速回落,节点间的可达性差异回归到原有水平,因为高速公路已作为新的交通网络取代原有公路,并形成新的可达性结构,但时间效益已有明显变化。
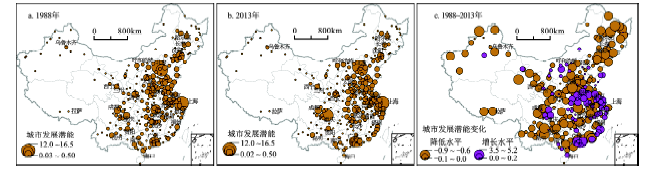
可达性在区域发展中发挥重要作用,因为可达性改善被视为经济活动和人口增长的重要动力并由此而影响城市发展。上述可达性仅是交通设施本身产生的物理可达性,但可达性与节点属性(如人口与经济)相结合的发展潜能更有意义[4]。而且,政府的关注点是沿海地区与内陆地区不断扩大的发展差距[12]。但高速公路是否导致区域差距扩大仍尚未有明确的结论。基于此,作者计算1988年和2013年各节点的综合潜能系数,并绘制图3。叠加人口和经济属性的区域发展潜能的空间分布类似,但同可达性相比发生巨大变化,考虑空间属性的区位优势与纯粹的交通区位有巨大差异。值得关注的是,无论哪个时期,东部各城市的综合潜能明显高于中部,西部城市具有最低的综合潜能,形成从沿海向内陆递减的宏观格局。北方城市的综合潜能明显高于南方城市,尤其杭州湾以北沿海省份的综合潜能很高。其中,环渤海地区、华北、长江三角洲、珠江三角洲、两湖平原、成渝经济区及辽东半岛有较高的综合潜能。广阔的新疆、甘肃、青海、西藏、内蒙古的综合潜能很低,同时黑龙江、吉林、云南的边缘地区,和桂北、粤北、闽西北、浙西南、赣南、湘南的岭南地区及鄂西、湘西、贵州的武陵山区也有较低的综合潜能。这主要由各地的经济、人口基础及可达性倾向于沿海地区所致。
图3 人口-经济-可达性区位系数格局与变化
Fig.3 Population-economic-road location coefficient and its changes
评价发达沿海地区与落后内陆地区尤其边缘地区的潜能变化很重要[12]。从反映离散水平的标准差来看,1988年为1.606,2013年为1.763。高速公路建设促使城市间综合潜能更趋于非均衡化,强化了地区间的发展差异。这将区域发展机会配置在可达性改善明显的区位,但可达性并未改善的地区面临较少的发展机会。这种结论同Li等对高速铁路的研究相吻合[10,12]。
从综合潜能的增长来看,东部和中部较为明显,东南沿海地区尤其长江三角洲和珠江三角洲及闽东南的提高最明显。这是由于高速公路促使交通网质量与容量的提高,促使经济与社会活动更有效。而西部除成渝经济区和大型城市(如昆明、贵阳、兰州、乌鲁木齐等)略有提高外,其他地区的综合潜能变化小。城市节点综合潜能的变化大致形成综合潜能提高(92个城市,31.2%)和下降(203个城市,68.8%)两大团体,两者形成“1∶2”的数量结构。高速公路建设降低了多数城市的发展潜力但提高了少数城市的发展机遇。这符合高速公路的技术经济属性:服务于大中城市。从空间维度看,综合潜能的变化存在规律,提高型城市集中在河南中部、珠江三角洲、长江三角洲及安徽中部、成渝经济区、内蒙中部及山东半岛,多是城市群地区。发展潜力下降的城市虽呈现遍布性分布,但存在相对集中的地域,东北和云南、贵州、广西、甘肃、河北、山西和西北各省区。上述结果表明可达性改善并没有减小区域发展差距,相反产生了更严重的区域发展差距。特别是,可达性改善对提高发达地区或城市群地区的发展潜能更积极有效,但在落后地区或边缘地区其影响是负面的,这同Vickerman等的结论相吻合[33]。
本文采用最短交通时间作为分析指标评价了中国高速公路网的可达性特征,考察高速公路建设对区位优势的影响及各时期的差异,判断高速公路引致收敛效应的获益者与受损者。结果表明,20世纪80年代以来,中国一直实施大规模的、快速地高速公路建设,目前已成为世界最大的高速公路网之一,高速公路连通了大量城市并成为陆路交通网的骨干。高速公路促使城市间的交通时间持续缩短,“时空收敛”效应显现,重塑了国省道网所建立的空间模式。各时期公路可达性均表现为类似的空间模式,呈现由中国腹心地区向边缘地区递减的格局,黄淮海平原、关中和长江中下游始终是可达性最好的区域,但高速公路发展促使可达性较差的边缘区更接近核心区,产生“国土不断萎缩”的时空效应。高速公路网对中国产生了明显效益,边缘地区的绝对可达性得到改善,从时间收敛效应中受益,而腹心地区受益较小。高速公路的初期建设加强了城市间的可达性分异,但持续建设和网络完善促使高速公路作为新的交通网取代原有公路网,对空间优劣的分异功能就弱化,高速公路保持了国省道网建立的可达性格局。高速公路主要是影响绝对交通时间成本,但对区位影响较小。高速公路的主要受益城市随时间推移逐步从东部向西部转移。大约五分之一的城镇成为显著受益的团体且主要分布于国土边缘:西部、边境地区与山区及东南沿海地区。叠加人口和经济等属性的综合潜能与纯粹的交通区位相比发生巨大变化,高速公路扩大了区域发展潜力的不平衡性,加剧了中国原本就存在的区域差距。除上述直接影响外,高速公路建设将不可避免地在全国、区域甚至城市尺度上对经济活动和人口分布的地理格局产生间接的中远期影响,这将是作者继续深入探讨的议题。
The authors have declared that no competing interests exist.
| [1] |
Li X W et al. China’s regional transport dominance: Density, proximity, and accessibility [J]. |
| [2] |
Location, economic potential and daily accessibility: an analysis of the accessibility impact of the high-speed line Madrid-Barcelona-French border [J].https://doi.org/10.1016/S0966-6923(01)00017-5 URL [本文引用: 8] 摘要
This paper evaluates the accessibility impact of the future Madrid–Barcelona–French border high-speed line. Accessibility impact of the new infrastructure is measured by means of three indicators: weighted average travel times, economic potential and daily accessibility. These indicators respond to different conceptualizations and offer complementary information about the issue accessibility. The results are quite different: very concentrated effects in the daily accessibility indicator, less concentrated in the economic potential one and more dispersal in the location indicator. The sign (polarizing/balancing) of these effects depend on the geographic scale: polarizing effects at the national level and balancing effects at both corridor and European levels are identified. A geographic information system (GIS) was used to carry out this study.
|
| [3] |
Transport infrastructure development and changing spatial accessibility in the Greater Pearl River Delta, 1990-2020 [J].https://doi.org/10.1016/j.jtrangeo.2011.07.003 URL [本文引用: 3] 摘要
This paper analyses the accessibility implications of the development of expressways and inter-city railways in the Greater Pearl River Delta (GPRD) over the period 1990-2020. Average travel time was firstly reduced by expressway development; and it will be reduced further by the introduction of the inter-city rail system in 2011. The unevenness in regional accessibility remained relatively high during the initial stage of expressway development, but later expansion brought more balanced accessibility landscapes. The first stage (2010-2020) of inter-city railway development will raise the accessibility inequality. Its later effects, however, remain to be seen. Convenience in transport connections is associated with the spatial pattern of industrialization. In addition, accessibility improvement is tied to the direction of city-region development, as exemplified by Guangzhou's choice of Nansha, the city's outer port, as development focus.
|
| [4] |
Mo H H et al. Spatiotemporal evolution of China’s railway network in the 20th century: An accessibility approach [J].https://doi.org/10.1016/j.tra.2009.07.003 URL [本文引用: 2] 摘要
The interrelatedness of transportation development and economic growth has been a constant theme of geographic inquiries, particularly in economic and transportation geography. This paper analyzes the expansion of China’s railway network, the evolution of its spatial accessibility, and the impacts on economic growth and urban systems over a time span of about one century (1906–2000). First, major historical events and policies and their effects on railway development in China are reviewed and grouped into four major eras: preliminary construction, network skeleton, corridor building, and deep intensification. All four eras followed a path of “inland expansion.” Second, spatial distribution of accessibility and its evolution are analyzed. The spatial structure of China’s railway network is characterized by “concentric rings” with its major axis in North China and the most accessible city gradually migrating from Tianjin to Zhengzhou. Finally, the study indicates that railway network expansion has significantly improved economic development and heavily influenced the formation of urban systems in China.
|
| [5] |
Accessibility, attraction, and potential: A review of some concepts and their use in determining ability [J].https://doi.org/10.1068/a060675 URL [本文引用: 1] 摘要
Some confusion seems to have developed over the relationship between accessibility and travel patterns. Various concepts of attraction, accessibility, and potential are examined with the object of reaching a more satisfactory definition. Multivariate analysis of data relating to an urban area suggests that the influences of conventional accessibility indices are concealed by collinear socioeconomic variations; when these are separated there is a more pronounced relationship. It is shown that such a relationship has important consequences for urban planning. /Author/TRRL/
|
| [6] |
Road transport infrastructure and regional economic development: The regional development effects of the M25 London orbital motorway [J].https://doi.org/10.1016/0966-6923(96)00001-4 URL 摘要
The M25 London Orbital Motorway has affected levels of accessibility in Britain and this has been discussed in an earlier paper. Changes so caused are thought likely to affect regional development and the objective of this research is to evaluate the nature of this relationship. The methodology involves the construction of a series of measures of both regional development, as the impact or dependent variable, and accessibility, as the policy or control variable. The regressions also include a number of other potential explanatory factors. Accessibility is measured using time, distance and cost impedance functions for heavy goods vehicle movements. The results are somewhat different from those found in previous research involving different spatial and temporal circumstances. During the 1980s places with the highest general levels of accessibility (including that arising from the construction of the M25) score poorest on the changing development indicators. However, when the component of accessibility change which is caused by the actual construction of the M25 motorway is isolated, then it can be demonstrated that such changes are positively related to changing levels of economic development, at least for some impedance functions.
|
| [7] |
GIS and model of accessibility: An application in planning [J].https://doi.org/10.1080/02693799508902025 URL 摘要
This paper focuses on the integration of models, especially potential models, in a geographical information system (GIS). This exercise was prompted by the inability of common geographical information systems to deal adequately with the problem of accessibility. Attention is devoted to the technical aspects of integration as well as to the use of GTS—based potential modelling in Dutch physical planning practice.
|
| [8] |
An accessibility analysis of the impact of the M25 London orbital motorway on Britain [J].https://doi.org/10.1080/00343409212331346761 URL [本文引用: 1] 摘要
, 31–47. Es scheint sicher, dass die Londoner Autoumge-hungsstrasse M25 den allgemeinen Grad der Zug01nglich-keit in Grossbritannien beeintr01chtigt hat. Umfang und Natur dieses Wandels der Zug01nglichkeit jedoch sind weniger genau erforscht, und dieser Aufsatz hat sich den Versuch zum Ziel gesetzt, sie genau zu bestimmen. Die Methodik erfordert die Festsetzung der Gr02ssenordnung des Marktpotentials im Falle der Strassenbenutzung und ohne, wobei eine von aussen auferlegte Minimalisierung des Weges von einer Regionalzone zur anderen zu Grunde gelegt wird. Die Funktionen der scheinbaren Behinderungen Zeit, Entfernung und Kosten werden sowohl für Wagen als auch für schwere Gütertransporte berechnet. Die Ergebnisse weisen auf bedeutende, jedoch nicht immer in der zu erwartenden Richtung auftretende Ver01nderungen der Zug01nglichkeit hin. Sie h01ngen stark von der Art der St02rungsfunktion, der Verkehrsweise und dem Standort der Auswirkung ab.
|
| [9] |
Evolution of the motorway network and changing levels of accessibility in Great Britain [J]. |
| [10] |
An accessibility approach to railways and municipal population growth, 1840-1930 [J]. |
| [11] |
Special problems facing underdeveloped countries. Transportation and economic development [J]. |
| [12] |
Impacts of the national truck highway system on accessibility in China [J].https://doi.org/10.1016/S0966-6923(00)00040-5 URL [本文引用: 11] 摘要
Recently, China has launched a major programme of motorway construction 鈥 the National Trunk Highway System (NTHS). The present study analyses the impacts of this highway development programme on the pattern of accessibility gradients, trying to draw implications for regional growth. Obviously, this programme will bring about substantial improvements in accessibility across the nation. There is evidence, however, that highway investment exhibits diminishing returns over time. Greater improvements in the nodal accessibility of the major coastal cities, as compared with cities in interior and periphery provinces, in the initial stage of the highway development programme are found. But as time progresses, the NTHS will bring about more balanced development in the spatial sense.
|
| [13] |
Development of a regional transport infrastructure: Some lessons from the Zhujiang Delta, Guangdong, China [J].https://doi.org/10.1016/S0966-6923(98)00037-4 URL [本文引用: 1] 摘要
No abstract provided.
|
| [14] |
经济发达地区交通网络演化对通达性空间格局的影响——以广东省东莞市为例 [J].https://doi.org/10.3321/j.issn:1000-0585.2003.03.006 URL Magsci [本文引用: 3] 摘要
<p>本文以广东省东莞市为例,分析了改革开放二十余年来经济发达地区交通网络的演化,以及由此引起的通达性空间格局的变化。由于东莞市经济发达地区交通网络结构已趋于成熟,通达性空间格局呈现均质化发展状态,区域的空间收敛显著,明显改变了区位决策的条件,扩大了区位决策的范围和选择余地。这也从一个侧面解释了广东省东莞市城镇发展的区域蔓延现象。</p>
The impact of the evolution of land network on spatial structure of accessibility in the developed areas: the case of Dongguan city in Guangdong province. https://doi.org/10.3321/j.issn:1000-0585.2003.03.006 URL Magsci [本文引用: 3] 摘要
<p>本文以广东省东莞市为例,分析了改革开放二十余年来经济发达地区交通网络的演化,以及由此引起的通达性空间格局的变化。由于东莞市经济发达地区交通网络结构已趋于成熟,通达性空间格局呈现均质化发展状态,区域的空间收敛显著,明显改变了区位决策的条件,扩大了区位决策的范围和选择余地。这也从一个侧面解释了广东省东莞市城镇发展的区域蔓延现象。</p>
|
| [15] |
中国高速公路网发展演化及区域效应研究 [J].https://doi.org/10.3969/j.issn.1007-6301.2006.06.015 URL Magsci 摘要
<p>基于国内研究进展的评述, 本文分析了我国高速公路网络的空间演化过程, 认为以1997 年为界存在缓慢发展和快速发展两个阶段, 并探讨了高速公路网络的组织模式; 作者深入考察了 高速公路发展的区域效应, 分析了高速公路对全国公路交通流格局的演化影响和高速公路建设 对城镇密集区的公路交通流格局和地域系统的影响, 并以省会城市为中心, 探讨了高速公路对 30 分钟和1 小时交通圈的空间效应。</p>
Regional impaction and evolution of express way networks in China. https://doi.org/10.3969/j.issn.1007-6301.2006.06.015 URL Magsci 摘要
<p>基于国内研究进展的评述, 本文分析了我国高速公路网络的空间演化过程, 认为以1997 年为界存在缓慢发展和快速发展两个阶段, 并探讨了高速公路网络的组织模式; 作者深入考察了 高速公路发展的区域效应, 分析了高速公路对全国公路交通流格局的演化影响和高速公路建设 对城镇密集区的公路交通流格局和地域系统的影响, 并以省会城市为中心, 探讨了高速公路对 30 分钟和1 小时交通圈的空间效应。</p>
|
| [16] |
高速公路网络化的时空收敛效应研究——以河南省为例 [J].
The study on effect of time-space astringency of expressway network: a case of Henan province.
|
| [17] |
区域高速公路网布局结构的连通度研究 [J].Magsci 摘要
<p>公路网的连通度评价指标反映了网络中各节点的连通状况,体现了网络的结构特征。本文分析区域高速公路网布局结构的特点,评述现有的公路网连通度评价指标,并指出其存在的局限性。在此基础上提出路网加权模糊连通度的定义和计算方法,有效体现区域高速公路网布局结构评价中存在的节点重要度的差异性和线路连通度的模糊性。最后给出计算示例,说明该方法的有效性。</p>
Research on connectivity of layout structure for regional expressway network. Magsci 摘要
<p>公路网的连通度评价指标反映了网络中各节点的连通状况,体现了网络的结构特征。本文分析区域高速公路网布局结构的特点,评述现有的公路网连通度评价指标,并指出其存在的局限性。在此基础上提出路网加权模糊连通度的定义和计算方法,有效体现区域高速公路网布局结构评价中存在的节点重要度的差异性和线路连通度的模糊性。最后给出计算示例,说明该方法的有效性。</p>
|
| [18] |
区域高速公路网络构建对可达性空间格局的影响——以安徽沿江地区为实证 [J].https://doi.org/10.3969/j.issn.1004-8227.2007.06.007 URL Magsci 摘要
<p>以安徽沿江为实证,采用加权平均旅行时间指标,分析了高速公路网构建对节点区内联系及区外联系可达性格局的影响,并以此为基础,综合分析了节点总体可达性格局的变动;随后对总体可达性的变动幅度及其相对可达性变动格局进行了探讨。结果表明:安徽沿江高速公路网络的构建显著提高了区域整体可达性,且促进了可达性的均衡化;区内联系可达性、区外联系可达性及总体可达性三者格局特征不同,路网构建所形成的影响也各有差别;东部及北部地区可达性变动幅度小于西南部地区;根据可达性系数的变化幅度及方向,可将节点归为相对可达性下降、相对可达性稳定及相对可达性上升3类。</p>
Cao Weidong et al. Impact of regional expressway network on the accessibility pattern: the case of the belt along the Yangtze river in Anhui province. https://doi.org/10.3969/j.issn.1004-8227.2007.06.007 URL Magsci 摘要
<p>以安徽沿江为实证,采用加权平均旅行时间指标,分析了高速公路网构建对节点区内联系及区外联系可达性格局的影响,并以此为基础,综合分析了节点总体可达性格局的变动;随后对总体可达性的变动幅度及其相对可达性变动格局进行了探讨。结果表明:安徽沿江高速公路网络的构建显著提高了区域整体可达性,且促进了可达性的均衡化;区内联系可达性、区外联系可达性及总体可达性三者格局特征不同,路网构建所形成的影响也各有差别;东部及北部地区可达性变动幅度小于西南部地区;根据可达性系数的变化幅度及方向,可将节点归为相对可达性下降、相对可达性稳定及相对可达性上升3类。</p>
|
| [19] |
高等级公路网建设对区域可达性的影响——以江苏省为例 [J].https://doi.org/10.3969/j.issn.1000-8462.2004.06.025 URL [本文引用: 1] 摘要
从可达性的概念、度量方式两方面回顾了近期可达性研究领域的进展,并提出相对可达性的概念。以江苏省为例,分析了自1993年以来经济发达省份高等级公路网络的演化及由此引起的省内通达性空间格局的变化,对各地级市在路网中的地位做出评价,针对高等级公路网络现状中存在的问题提出合理化建议。
Impacts of the trunk highway system on accessibility of the municipalities in Jiangsu. https://doi.org/10.3969/j.issn.1000-8462.2004.06.025 URL [本文引用: 1] 摘要
从可达性的概念、度量方式两方面回顾了近期可达性研究领域的进展,并提出相对可达性的概念。以江苏省为例,分析了自1993年以来经济发达省份高等级公路网络的演化及由此引起的省内通达性空间格局的变化,对各地级市在路网中的地位做出评价,针对高等级公路网络现状中存在的问题提出合理化建议。
|
| [20] |
基于陆路交通网的区域可达性评价——以长江三角洲为例 [J].https://doi.org/10.3321/j.issn:0375-5444.2006.12.001 URL Magsci [本文引用: 1] 摘要
<p>对于给定的区域而言,区内任意一点可达性的评价应当是区内可达性和区外可达性的综合评价。利用MapX控件和Delphi编程工具,开发了基于时间最短的区域可达性计算与分析信息系统,生成了可达性的分值扩散图。基于长江三角洲的陆路交通网,从时间距离的角度对长江三角洲内16个地级市目前和未来的区内可达性和区外可达性进行了评价。结果表明,长江三角洲区域可达性呈现出以上海为中心的扇状辐射,可达性最好的是上海和嘉兴,可达性最差的是台州和南通。随着苏通大桥、杭州湾跨海大桥和舟山大陆连岛工程的建成,长江三角洲地区内所有城市的区内可达性都有了提高,尤其是绍兴、宁波和泰州,区内可达性减少了1h,其余城市区内可达性平均减少了25 min。随着南通洋口港的建成,长江三角洲境内江苏城市以海港为节点的区外可达性都有不同程度的提高,到达海港的平均时间减少了近1h。</p>
Assessment on regional accessibility based on land transportation network: a case study of the Yangtze River Delta. https://doi.org/10.3321/j.issn:0375-5444.2006.12.001 URL Magsci [本文引用: 1] 摘要
<p>对于给定的区域而言,区内任意一点可达性的评价应当是区内可达性和区外可达性的综合评价。利用MapX控件和Delphi编程工具,开发了基于时间最短的区域可达性计算与分析信息系统,生成了可达性的分值扩散图。基于长江三角洲的陆路交通网,从时间距离的角度对长江三角洲内16个地级市目前和未来的区内可达性和区外可达性进行了评价。结果表明,长江三角洲区域可达性呈现出以上海为中心的扇状辐射,可达性最好的是上海和嘉兴,可达性最差的是台州和南通。随着苏通大桥、杭州湾跨海大桥和舟山大陆连岛工程的建成,长江三角洲地区内所有城市的区内可达性都有了提高,尤其是绍兴、宁波和泰州,区内可达性减少了1h,其余城市区内可达性平均减少了25 min。随着南通洋口港的建成,长江三角洲境内江苏城市以海港为节点的区外可达性都有不同程度的提高,到达海港的平均时间减少了近1h。</p>
|
| [21] |
20世纪80年代以来长三角地区综合交通可达性的时空演化 [J].https://doi.org/10.11820/dlkxjz.2010.05.015 URL Magsci [本文引用: 1] 摘要
<p>以1986、1994、2005年为时间断面,加权平均旅行时间为指标,长三角地区20世纪80年代以来综合交通网络及其可达性的时空演化呈现如下特征:①综合交通网络的快速发展带来了综合交通可达性的不断提升,且第二阶段(1994-2005)发展速度明显快于第一阶段(1986-1994);三时间断面上海及环太湖地区均为可达性最优区域,1986及1994年可达性较优区域大致由沪宁沿线和沪杭沿线构成“>”形,而2005则大致由沪宁沿线(含沿江地区)、沪杭沿线及杭甬沿线构成“Z”形;②可达性提升中节点获益具有明显区域差异,加权平均旅行时间初始值越高的节点其值下降幅度越大,加权平均旅行时间的变化率中部地区低于南北边缘地区,但变化值及变化率在不同阶段均呈现不同特征;③从分省市角度,上海可达性最优,江苏板块次之,浙江板块较差,但上海的优势地位逐步下降,浙江板块与江苏板块间的差距正不断缩小;④综合交通可达性系数标准方差逐步下降,表明长三角地区综合交通网络发育日益成熟,但不同交通方式具有不同发展特征.</p>
Temporal and spatial evolution of integrated transport accessibility in the Yangtze River Delta: 1986-2005. https://doi.org/10.11820/dlkxjz.2010.05.015 URL Magsci [本文引用: 1] 摘要
<p>以1986、1994、2005年为时间断面,加权平均旅行时间为指标,长三角地区20世纪80年代以来综合交通网络及其可达性的时空演化呈现如下特征:①综合交通网络的快速发展带来了综合交通可达性的不断提升,且第二阶段(1994-2005)发展速度明显快于第一阶段(1986-1994);三时间断面上海及环太湖地区均为可达性最优区域,1986及1994年可达性较优区域大致由沪宁沿线和沪杭沿线构成“>”形,而2005则大致由沪宁沿线(含沿江地区)、沪杭沿线及杭甬沿线构成“Z”形;②可达性提升中节点获益具有明显区域差异,加权平均旅行时间初始值越高的节点其值下降幅度越大,加权平均旅行时间的变化率中部地区低于南北边缘地区,但变化值及变化率在不同阶段均呈现不同特征;③从分省市角度,上海可达性最优,江苏板块次之,浙江板块较差,但上海的优势地位逐步下降,浙江板块与江苏板块间的差距正不断缩小;④综合交通可达性系数标准方差逐步下降,表明长三角地区综合交通网络发育日益成熟,但不同交通方式具有不同发展特征.</p>
|
| [22] |
中国交通年鉴 [M]. |
| [23] |
|
| [24] |
|
| [25] |
How accessibility shapes land-use [J].https://doi.org/10.1080/01944365908978307 URL [本文引用: 1] 摘要
An empirical examination of the residential development patterns illustrates that accessibility and the availability of vacant developable land can be used as the basis of a residential land use model. The author presents an operational definition and suggests a method for determining accessibility patterns within metropolitan areas. This is a process of distributing forecasted metropolitan population to small areas within the metropolitan region. Although the model presented is not yet sufficiently well refined for estimating purposes, the concept and the approach may be potentially useful tools for metropolitan planning purposes.
|
| [26] |
Accessibility in the European Union: The impact of the trans-European road network [J].https://doi.org/10.1016/0966-6923(95)00042-9 URL [本文引用: 3] 摘要
The aim of this paper is to assess the impact of the future Trans-European Road Network as far as accessibility is concerned. Accessibility analysis and presentation of results is undertaken using a vector geographic information system (GIS). In accordance with the results of the study, the new planned links appreciably modify levels of accessibility to economic activity centres, thus reducing distances and bringing the peripheral regions closer to the central ones. In accordance with the analyses carried out, the benefits of these new infrastructures will affect the whole of the territory of the European Union, albeit particularly so in the peripheral regions.
|
| [27] |
Cities and highway network in Europe [J].https://doi.org/10.1016/0966-6923(96)00004-X URL [本文引用: 2] 摘要
The highway system — a communications network on a national or international scale par excellence — is here examined in light of the relationships which it makes possible between cities (or poles) of European significance. The ‘rank’ of each of these cities, in terms of accessibility to the other poles, can be calculated mathematically and a hierarchy of these cities can thus be established. While the position of a given city within this hierarchy is linked to physical and human geography (natural barriers in the first case; boundary effects, extremely variable density according to country and region in the second), it is also linked to the characterics (especially topological) of the national highway systems.
|
| [28] |
Regional accessibility and economic potential in the European Community [J].https://doi.org/10.1080/09595238200185421 URL [本文引用: 2] 摘要
Keeble D., Owens P. L. and Thompson C. (1982) Regional accessibility and economic potential in the European community, Reg. Studies 16, 419–432. This paper investigates changes in regional accessibility to economic activity within the European Community between 1965 and 1977 as measured by the ‘economic potential' index. Potential measures proximity by road to regional economic activity as that is geographically distributed throughout the Community, allowing for tariff barriers and sea-ferry crossings, as well as successive enlargements to Nine in 1973 and, prospectively, to Twelve. While 1973 enlargement benefited accessibility levels in the ‘new' periphery quite considerably, already severe centre-periphery disparities in regional accessibility in general widened still further during the period, largely because of continuing concentration of economic activity in core EC regions.
|
| [29] |
Accessibility evaluation of land-use and transport strategies: Review and research directions [J].https://doi.org/10.1016/j.jtrangeo.2003.10.005 URL Magsci [本文引用: 2] 摘要
<h2 class="secHeading" id="section_abstract">Abstract</h2><p id="">A review of accessibility measures is presented for assessing the usability of these measures in evaluations of land-use and transport strategies and developments. Accessibility measures are reviewed using a broad range of relevant criteria, including theoretical basis, interpretability and communicability, and data requirements of the measures. Accessibility impacts of land-use and transport strategies are often evaluated using accessibility measures, which researchers and policy makers can easily operationalise and interpret, such as travelling speed, but which generally do not satisfy theoretical criteria. More complex and disaggregated accessibility measures, however, increase complexity and the effort for calculations and the difficulty of interpretation. The current practice can be much improved by operationalising more advanced location-based and utility-based accessibility measures that are still relatively easy to interpret for researchers and policy makers, and can be computed with state-of-the-practice data and/or land-use and transport models. Research directions towards theoretically more advanced accessibility measures point towards the inclusion of individual's spatial–temporal constraints and feedback mechanisms between accessibility, land-use and travel behaviour. Furthermore, there is a need for theoretical and empirical research on relationships between accessibility, option values and non-user benefits, and the measurement of different components of accessibility.</p>
|
| [30] |
Urban agglomerations in European infrastructure networks [J].https://doi.org/10.1080/00420989320080861 URL [本文引用: 1] 摘要
RANKING OF ROAD, RAIL AND AIR INFRASTRUCTURE NETWORKS FOR 42 EUROPEAN CITIES.
|
| [31] |
Accessibility for High Asia: Comparative perspectives on Northern Pakistan’s traffic infrastructure and linkages with its neighbors in the Hindukush-Karakoram-Himalaya [J].https://doi.org/10.1007/BF02919325 URL [本文引用: 1] 摘要
Introduction The birth of Pakistan in particular and theindependence and creation of some other Asiannation states in general coincide with an internationaleffort to overcome colonialization and tostrengthen mutual exchanges of goods andknowledge. The ag
|
| [32] |
Spatial reorganization: a model and concept [J]. |
| [33] |
Accessibility and economic development in Europe [J].https://doi.org/10.1080/00343409950118878 URL [本文引用: 2] 摘要
VICKERMAN R., SPIEKERMANN K. and WEGENER M. (1999) Accessibility and economic development in Europe, , 1-15. There is continuing debate on the role of transport infrastructure and changes in accessibility on regional economic development. The emphasis in recent European Union policy on the development of trans-European Networks (TENs) provides a focus for a re-evaluation. Much of the debate assumes that improvements in accessibility will lead to economic development and, by implication, to greater cohesion. This paper identifies some of the major difficulties in defining a simple measure of accessibility for use in such studies and proceeds to evaluate new measures of time-space and accessibility surfaces which allow for greater disaggregation at a spatial and sectoral level. An assessment of the implications for regional development in the EU is then made. The conclusions cast doubt on the ability of TENs to promote greater convergence in both accessibility and economic development.VICKERMAN R., SPIEKERMANN K. et WEGENER M. (1999) Accessibilite07 et de07veloppement e07conomique en Europe, , 1-15. Le ro le de l'infrastructure de transport et de l'accessibilite07 dans le de07veloppement e07conomique re07gional est toujours un sujet très controverse07. Dans le cadre de l'Union europe07enne, la politique re07cente a mis l'accent sur le de07veloppement des re07seaux transeurope07ens, ce qui permet une re07e07valuation. Dans une large mesure, le de07bat laisse supposer qu'une meilleure accessibilite07 incitera au de07veloppement e07conomique et, par la suite, à plus de cohe07sion. L'article distingue quelques-unes des plus grandes difficulte07s quant à la de07finition d'une mesure simple de l'accessibilite07 qui pourrait e tre employe07e dans de telles e07tudes, et e07value de nouvelles mesures de l'espace-temps et de l'accessibilite07 qui permettraient une division plus importante sur le plan ge07ographique et du point de vue sectoriel. On fait le bilan des conse07quences pour l'ame07nagement du territoire au sein de l'Union europe07enne. La conclusion met en doute la capacite07 des re07seaux transeurope07ens à promouvoir une meilleure convergence quant à l'accessibilite07 et au de07veloppement e07conomique.VICKERMAN R., SPIEKERMANN K. und WEGENER M. (1999) Zug01nglichkeit und wirtschaftliche Entwicklung in Europa, , 1-15. Die Debatte über die Rolle von Verkehrsinfrastruktur und Wandel der Zug01nglichkeit auf regionalwirtschaftliche Entwicklung h01lt weiterhin an. Die Betonung der Entwicklung transeurop01ischer Netzwerke (TEN) in den letzten politischen Diskussionen der EU liefert einen Brennpunkt für eine erneute Einsch01tzung. In der Debatte wird oft vorausgesetzt, da08 verbesserte Zug01nglichkeit zu wirtschaftlicher Entwicklung, und implizite zu st01rkerem Zusammenhalt, führen wird. Dieser Aufsatz identifiziert einige der Hauptschwierigkeiten bei der Definition eines einfachen Ma08stabs der Zug01nglichkeit zur Anwendung bei derartigen Studien, und beurteilt dann neue Ma08st01be der Zeit-Raum und Zug01nglichkeitsoberfl01che, welche gr0208ere Disaggregation auf r01umlicher wie auf Sektorenebene gestatten. Anschlie08end wird eine Einsch01tzung der Implikationen für die Regionalentwicklung in der EU vorgenommen. Sie Schlu08folgerungen lassen Zweifel an der F01higkeit transeurop01ischer Netzwerke aufkommen, gr0208ere Konvergenz von Zug01nglichkeit und wirtschaftlicher Entwicklung herbeizuführen.
|
| [34] |
The impact of orbital motorways on intra-metropolitan accessibility: The case of Madrids M-40 [J].https://doi.org/10.1016/S0966-6923(98)00029-5 URL [本文引用: 1] 摘要
In this paper, we analyze the impact of orbital motorways on intra-metropolitan accessibility, using as an example the Madrid M-40 orbital motorway. The maps of changes in accessibility show that, as one might expect, the nodes situated near the M-40 are those that most benefit from the new infrastructure and that the further their distance from the M-40, the weaker the changes, although the gradient is much steeper towards the city centre than towards the exterior. All the indicators used point to the fact that the new orbital motorway has brought about relevant changes, but the intensity with which such changes are registered depends on the variable used as a mass (changes are higher in accessibility to population indicators than in accessibility to employment indicators), and on the type of operationalization adopted (the most complex ones are those which least noticeably reflect the effect of the new orbital motorway). It has been verified, in the case of the Madrid M-40, that orbital motorways do not necessarily lead to an increase in the equality of intra-metropolitan accessibility, for this will depend on their location within the metropolitan area: the further out they are, the greater equality they bring, even though they attract less traffic.
|

/
| 〈 |
|
〉 |