江亭桂 , 李玉霞
, 李玉霞
Jiang Tinggui, Li Yuxia
中图分类号: P462.4
文献标识码: A
文章编号: 1000-0690(2016)06-0943-08
通讯作者:
收稿日期: 2015-06-18
修回日期: 2015-11-24
网络出版日期: 2016-10-20
版权声明: 2016 《地理科学》编辑部 本文是开放获取期刊文献,在以下情况下可以自由使用:学术研究、学术交流、科研教学等,但不允许用于商业目的.
基金资助:
作者简介:
作者简介:江亭桂(1971-),女,安徽芜湖人,博士研究生,讲师,主要从事环境地理,环境工程等方面研究。E-mail: jiangtinggui@njnu.edu.cn
展开
摘要
通过反演方法,利用已有的影响亚洲季风变化的相应资料,通过动力模型建立了近千年亚洲季风变化的驱动力方程,根据各指标的具体数值反演出方程中各项系数和对应的贡献率。分析方程中各气候代用指标对亚洲季风变化的影响程度,发现近千年亚洲季风并非只受到这些气候要素的线性作用,而是受到较为复杂的非线性驱动力作用,其中大气中CO2含量、印度洋海表温度、前一期季风强度、南方涛动指数、CH4气体含量、格陵兰温度、北大西洋海表温度、北半球温度等在驱动近千年亚洲季风变化中起到较为重要的作用,而在长时间尺度上对季风变化有重要影响的太阳活动,近千年中其直接影响并不十分显著,这也可能是指标精度的原因。
关键词:
Abstract
The Asian monsoon is an important part of the global climatic system. Previous studies have indicated that the formation and change of the Asian monsoon are greatly associated with solar activity, the land-sea thermal difference, global ice volume, the uplift of Qinghai-Tibet Plateau and other climatic and geographic elements. The proxies of the climate records are more abundant during the last millennium than those of the other history periods. The studies on the changes of the Asian monsoon during the last millennium can help us explore the monsoon evolution rules and predict tendency ofthe Asian monsoon in the future. In the paper, based on the inversion method and the currently available information and data, a driving model which probably reveals the dynamic mechanism of the Asian monsoon changes during the last millennium is established. According to the actual quantitative values of all the proxies, we can get the coefficients and the corresponding contribution rates of the equation. Through the analyses of the influencing degree of each climate proxy on the Asian monsoon, the following results are obtained: 1) The Asian monsoon is not only linearly affected by the climate elements, but also drived by a complex nonlinear dynamic system. 2) Some climate factors,including the concentration of carbon dioxide in the atmosphere, the Indian Ocean sea surface temperature, the previous monsoon intensity, southern oscillation index, methane content, the temperature of Greenland, the north Atlantic sea surface temperature and the northern hemisphere temperature, play important roles on the Asian monsoon changes during the last millennium. 3) The solar activity, which exhibits extremely important inpact on the Asian monsoon at long timescales, does not significantly affect the change of the Asian monsoon during the last millennium.
Keywords:
过去1 000 a是气候变化研究中一个极具特殊意义的时间段。这个时段是文字、器测数据与自然档案记录的的环境变化信息并存的时期[1, 2],也是人类活动影响不断加剧的时期,同时,对这一时段气候变化历史的科学认识是预估未来数十至数百年环境变化趋势必须具备的基础。
全球季风正在成为当今气候研究的热点之一[3]。Wang and Ding针对全球定义了6大季风区,分别是亚洲西太平洋季风区、南印度洋季风区、西非季风区、澳大利亚-南太平洋季风区、北美季风区和南美季风区[4]。亚洲季风因其影响人口众多,变化复杂而成为众多学者关注的重点。
对季风历史的重建研究离不开所用的代用指标。目前,洞穴石笋作为记录古气候变化的历史档案,由于沉积连续,分辨率高,定年准确和后期蚀变小等优势[5],在亚洲季风变迁的历史、幅度、驱动因素等研究方面已经取得了非常重要的成果[6~10],在亚洲季风控制区,石笋的δ18O较好地反映了夏季风的强度或季风降雨的变化[7, 11, 12]。
亚洲季风气候演化具有显著的米兰柯维奇周期成分,即地球轨道偏心率的100 ka周期、地轴倾斜的4l ka周期和23 ka 的岁差周期分量[13, 14],清晰地表明亚洲季风气候变迁受到地球轨道变化引起的太阳辐射的影响[15];在千年尺度事件上,亚洲季风与北大西洋气候之间存在强烈的耦合关系[7, 16];而年际到10 a尺度的季风变化上,亚洲季风与赤道太平洋海面温度变化以及该地区气压异常形成的厄尔尼诺-南方涛动(ENSO) 关系非常密切[17, 18]。众多的研究表明火山活动[19~21]、温室气体和气溶胶变化[22, 23]可能也是影响过去千年气候变化的重要驱动因素。Zhou等[24]认为全球大陆季风降水的减少,是因为大气对于海温变化的响应,尤其是中东太平洋和赤道西印度洋海温的变化。但这些驱动因素如何以及在多大程度上影响近千年亚洲季风变化在以往的研究中却很少进行定性和定量的描述。
一般将参数给定后,求现象的问题称为正问题,数学物理方程解决的通常是正问题,而将现象已知后求参数的问题称为反演问题。反演时,在代数方程组中除了待定的物理参数之外所有变量都需要有实际观测的数值。
丑纪范在《长期数值天气预报》中介绍了反演的基本方法[25],黄建平在此基础上提出了利用实际观测资料精确地反演非线性动力模型的过程[26]。林振山据此提出了天津局地气候的动力方程[27],罗虎明和李玉霞利用反演方法分别探求了轨道尺度224 ka东亚季风[28]、董哥洞石笋所指示的印度季风的驱动机制[29],为充分利用观测数据探求系统动力机制研究提供了新的思路。
对于某些实际的非线性系统,尽管不知道描述这些系统的动力模型,但却知道这些模型的一系列特解,这就是多年来积累的实际观测资料。如果把这些观测资料看成是该动力模型的一系列离散值,解与数值求解相反的问题,即可反演出较为理想的非线性动力模型。
设非线性系统的状态变量xj随时间变化的动力方程为:
式中n为状态变量个数,fj(t,x1(t),x2(t),...xn(t))是t,x1(t),x2(t),...xn(t)的一般非线性函数。一开始,我们对系统(1)的具体形式不了解,但能观测到一系列的数据x1(t1),x2(t1),...xn(t1), x1(t2),x2(t2),...xn(t2),…x1(tm),x2(tm),...xn(tm),也可以看作是方程(1)的m个解。tm为资料序列的观测时间点。利用这m个解可以近似方程(1)为:
式中j=1,2,…n; i=2,3,…,m
如果fj(t,x1(t),x2(t),...xn(t))可以分为2部分:
其中bk,j是相应项的系数。公式(1)可以写成矩阵形式:
其中:
在式(4)中,只有B是未知的,也是线性的。要求得矩阵B,可以运用矩阵的最小二乘估计,即用残差的平方和取极小值的方法来求解矩阵B。
得到系数B后,可进一步分析fj中各项的相对贡献率Wkj:
式中Tk=bkgk,m是资料序列长度。
如要精炼方程,可根据各项贡献率大小剔除对系统演变无用或作用很小的项,带入原始数据对剔除无关项后的方程重新进行反演。最后得到所要的反演方程式。
近千年亚洲季风的变化强度由万象洞石笋δ18O的变化趋势表示。Zhang 在2008年发表了万象洞石笋WX42B氧同位素序列[30],时长为192~2003年,平均年分辨率2.5 a。万象洞(33°19′N, 105°00′E,海拔约1 200 m),位于甘肃省陇南市武都县,处于亚洲夏季风降水的边缘,80%的降水出现在夏季风盛行的5~9月,降水受亚洲季风系统影响非常强烈[30,31]。研究表明,万象洞内滴水的氧同位素组成可以很好地反映洞外大气降水的氧同位素组成,而温度对石笋δ18O值的影响可以忽略不计[31]。石笋δ18O的值越低,反映季风带来的降水越多,亚洲季风越强[30,31]。
气候变迁的根本原因在于外界强迫因子的改变[32]。根据研究,亚洲季风的强弱、周期变动与太阳活动、北半球平均温度、北大西洋海表温度、温室气体含量、南极温度等均有着一定程度的关联。文中所采用的相应指标见表1,所有数据资料均来源于http://www.ncdc.noaa.gov/paleo/data.html。
表1 各指标资料
Table 1 The information of the index
| 指标 | 符号 | 备注 |
|---|---|---|
| 石笋δ18O[30] | m | 指代亚洲季风强度 |
| 10Be[1] | s | 表示太阳辐射强度 |
| 北半球平均温度[1] | Tn | |
| 北大西洋SST[33] | Ts | 北大西洋海表温度 |
| 南方涛动指数[34] | si | SOIpr |
| PDO指数[35] | p | 太平洋涛动指数 |
| 格陵兰温度[36] | g | 源自GRIP2 Ice Core |
| 印度洋SST[37] | Ti | 印度洋海表温度 |
| 南极Dome C δ18O[38] | Ta | 表征南极气候变化 |
| CO2浓度[39] | c | 源自Law Dome Ice Core |
| CH4浓度[39] | ch | 源自Law Dome Ice Core |
| SO4盐含量[40] | so | 表征火山活动 |
| Dasuopu冰芯δ18O[41] | d | 表征青藏高原气候变化 |
因为各指标的分辨率不同,数据的时间间隔不等,而进行反演的时候,数据必须是等间距的,因此这些数据使用前先进行等间距化。据转换函数与原信号误差分析经验,通常用3次样条函数进行插值处理结果误差最小,因此本文对所有需要插值的数据先用3次样条函数进行处理,其中印度洋海表温度、南极Dome C δ18O、Dasuopu冰芯δ18O、SO4盐含量(分辨率为0.2 a)用3次样条插值的处理结果与原信号非常逼近。但通过对比分析也发现石笋δ18O、CO2浓度、CH4浓度采用3次样条插值后部分数据与原数据存在较大的差异,改用线性插值后则误差很小。其他数据的分辨率为1 a,不需要进行插值处理。
从反演的方法和以前的研究情况来看[26, 27],三次幂项对结果的影响非常小,所以设定方程时只考虑到二次项的因子,因此设万象洞代表的亚洲季风驱动机制的动力模型如下:
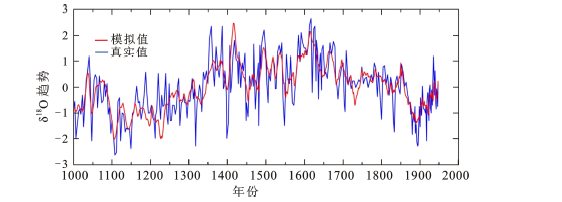
将表1中各项指标在1000~1947年的数据作为方程(6)的一系列数值解,带入公式中,为消除各指标单位和数据大小不同的影响,在带入公式前,先对数据进行标准化处理,然后对数据系列用公式(1)到(5)进行反演,得到a1到a104各项系数值和对应各项的贡献率。根据反演结果,以AD1000石笋δ18O年的数值作为初值,以1 a时间间隔作为步长,用四阶Runge-Kutta定步长算法计算出公式(6)的数值解,即可以得到石笋δ18O计算值与真实值(标准化后)的对比,如图1所示。
为判断上述结果是否受初始值的影响,以1050年石笋δ18O年的值作为初值,以同样的方法计算出δ18O亚洲季风的数值解,模拟效果与图1几乎一样,所以公式(6)较好地反演出了各指标与δ18O代表的亚洲季风强度的对应关系。
在公式(6)中,各项因子的贡献率相差很大,贡献率最大的一项a1m为10.51%,与贡献率最小的项a83p·d(贡献率为9.3×10⁻⁷)相差十几万倍,104项中贡献率小于万分之五的共有25项,其余79项的贡献率达到99.61%,因此我们首先尝试着剔除掉右边多项式中贡献率小于0.0005的项,将各代用指标的原始数据代入剩余项的多项式方程再次进行反演,结果差别很小,说明方程中这79项的作用和104项大致相当。但这时方程依然比较复杂。所以再以贡献率小于千分之一(0.001)为条件,在79项中又剔除掉11项,共剔除36项,剩余68项的累积贡献率总共为98.85%,则公式(6)简化为:
把各代用指标的原始数据代入方程(7)中重新进行反演,得到方程(7)中各项系数值和对应项的贡献率,结果如表2所示。
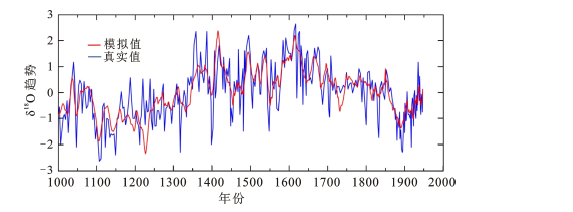
用表2中各项系数对公式(7)进行计算,计算结果与真实值对比如图2所示:
图2模拟效果虽然较图1稍差,但其与真实值的相关性也已达到0.792 5,我们认为可近似表示石笋δ18O的变化趋势,也说明方程(7)中这68项的作用可基本替代方程(6)中104项的作用。
图1 万象洞石笋δ18O 1000~1947年模拟值和真实值变化趋势的对比
Fig.1 Comparision between the simulation value and the real value of the Wanxiang Cave stalagmite δ18O in 1000 -1947
图2 公式(7)石笋δ18O模拟值与真实值变化趋势的对比
Fig.2 Comparision between the simulation value and the real value of the stalagmite δ18O according to equation (7)
另外我们以贡献率小于千分之二为条件,共剔除45项,以剩下的59项组成的方程用同样的方法进行反演,模拟效果则相对较差,所以我们认为方程(7)中右边68项对近千年亚洲季风变化会起到较大的作用。
在方程(7)中,方程右边的前10项为一次项,即线性部分,其它58项是非线性部分,线性部分的累积贡献率为24.3%,而非线性部分的累积贡献率为75.7%,说明近千年亚洲季风的变化主要受复杂的非线性驱动力作用,而非单纯受到各因子线性驱动。
在表2所有68项亚洲季风的影响因子中,从单项上看上一年季风强度的贡献率最大,达到10.2%,另外与季风强度有关的交叉项的贡献率共为10.3%,说明前一时期的季风强度的稳定作用对后一年的季风变化有着不可忽视的影响。
在一次项中,贡献率排在第二位的是大气中CO2含量,贡献率占5.15%,同时CO2含量对近千年季风的影响并不只是体现在线性驱动方面,更主要的是体现在CO2含量和其它因子的交叉项方面,与CO2含量有关因子(包括一次项)的贡献率总共达到23.5%,超过其他所有各项指标,排在第一位,说明在千年亚洲季风气候系统中,CO2含量变化起到极为重要的作用。在本文所采用的代用指标中,CH4含量也同属温室气体指标,CH4有关项(包括CO2与CH4含量交叉项)的贡献率到达16.0%。所以温室气体的含量不只是对全球变暖,对季风系统也可能会起到至关重要的作用。在进行反演的过程中,也曾把另一种温室气体N2O含量作为影响季风强度的因子带入到反演公式中,但发现N2O含量对反演结果几乎没有影响,线性项和非线性项的贡献率都非常小,于是在指标筛选的过程中便把N2O含量作为无关项予以剔除了。其他一些指标如北高纬温度的剔除过程类似。
相关项总贡献率排在第二位的是印度洋海表温度,总贡献率共达到23.3%,印度洋海表温作为一次项贡献率很小,仅为0.36%,它对近千年季风的驱动主要来源于非线性项,它们和一次项一起对亚洲季风在近千年的变化产生较大的影响。根据各指标相关项总贡献率,其他指标中对近千年亚洲季风系统有较大影响的各指标依次是:前一期季风强度,南方涛动指数,CH4气体含量,格陵兰温度,北大西洋海表温度,北半球温度,然后是表征太阳活动强度的铍10。
从长时间尺度来看,太阳活动对于亚洲季风变化有着非常显著的影响[13~15, 28]。但因为本文仅探讨近千年亚洲季风变化的情况,因此从表2来看,与太阳活动有关项的总贡献率仅为8.8%,这主要是时间尺度的选取问题,另外,本文选取的表征近千年太阳活动的10Be指标虽然分辨率为1 a,但因为是合成的指标,在某些时段精度较低,不可避免会影响到反演的效果。太阳活动的影响也可能通过其它指标,如海表温度、北半球温度等对亚洲季风强度的变化产生多方面间接的影响,但这些影响从我们的反演过程中无法直接地反应出来。
表2 公式(7)反演得到的各项系数和对应的贡献率
Table 2 The cofficients and the corresponding contribution rates by the inversion according to equation (7)
| b1(m) | b2(s) | b3(Tn) | b4(Ts) | b5(si) | b6(p) | b7(g) | b8(Ti) | |
|---|---|---|---|---|---|---|---|---|
| 系数反演值 | -0.1682 | 0.0656 | 0.0321 | -0.112 | 0.0514 | 0.0155 | 0.0389 | 0.0369 |
| 相应项贡献率 | 0.1022 | 0.022 | 0.0033 | 0.0422 | 0.0097 | 0.0013 | 0.0061 | 0.0036 |
| b9(c) | b10(so) | b11(s2) | b12(Tn2) | b13(Ts2) | b14(si2) | b15(p2) | b16(g2) | |
| 系数反演值 | -0.2682 | 0.0135 | -0.011 | -0.0833 | -0.0253 | -0.1042 | 0.0231 | 0.0226 |
| 相应项贡献率 | 0.0515 | 0.0007 | 0.0014 | 0.031 | 0.0035 | 0.0553 | 0.007 | 0.0035 |
| b17(Ti2) | b18(Ta2) | b19(c2) | b20(ch2) | b21(so2) | b22(m·s) | b23(m·Ts) | b24(m·p) | |
| 系数反演值 | -0.1059 | 0.0164 | 0.1693 | 0.1195 | 0.0027 | 0.0432 | 0.0164 | -0.0473 |
| 相应项贡献率 | 0.0478 | 0.0034 | 0.0229 | 0.0123 | 0.0008 | 0.0059 | 0.0006 | 0.0078 |
| b25(m·Ti) | b26(m·Ta) | b27(m·c) | b28(m·ch) | b29(s·Tn) | b30(s·p) | b31(s·g) | b32(s·Ti) | |
| 系数反演值 | -0.0988 | 0.0266 | 0.1823 | -0.261 | -0.0634 | -0.026 | -0.0473 | 0.0307 |
| 相应项贡献率 | 0.0173 | 0.002 | 0.0221 | 0.0484 | 0.0094 | 0.0035 | 0.0089 | 0.0024 |
| b33(s·Ta) | b34(s·c) | b35(s·ch) | b36(s·so) | b37(Tn·si) | b38(Tn·p) | b39(Tn·g) | b40(Tn·Ti) | |
| 系数反演值 | 0.0371 | 0.1988 | -0.1031 | 0.0193 | 0.0766 | -0.0484 | 0.0361 | 0.0793 |
| 相应项贡献率 | 0.0087 | 0.0171 | 0.0073 | 0.0013 | 0.0121 | 0.0062 | 0.0032 | 0.0155 |
| b41(Tn·Ta) | b42(Tn·c) | b43(Ts·si) | b44(Ts·p) | b45(Ts·g) | b46(Ts·Ti) | b47(Ts·so) | b48(Ts·d) | |
| 系数反演值 | -0.0566 | 0.1285 | -0.0739 | 0.0282 | -0.0989 | 0.0619 | 0.022 | 0.0114 |
| 相应项贡献率 | 0.0087 | 0.0121 | 0.0168 | 0.0024 | 0.0243 | 0.012 | 0.0011 | 0.0003 |
| b49(si·p) | b50(si·Ti) | b51(si·d) | b52(p·Ti) | b53(p·c) | b54(p·ch) | b55(p·so) | b56(g·Ti) | |
| 系数反演值 | 0.0782 | -0.1362 | 0.0552 | 0.0374 | 0.0605 | -0.0981 | 0.0268 | 0.1162 |
| 相应项贡献率 | 0.0191 | 0.0586 | 0.005 | 0.0039 | 0.0019 | 0.0093 | 0.002 | 0.0323 |
| b57(g·Ta) | b58(g·c) | b59(g·ch) | b60(g·so) | b61(Ti·Ta) | b62(Ti·c) | b63(Ti·so) | b64(Ti·d) | |
| 系数反演值 | -0.0117 | -0.1941 | 0.1755 | 0.0291 | -0.0456 | -0.2443 | -0.0389 | 0.0505 |
| 相应项贡献率 | 0.0006 | 0.0234 | 0.023 | 0.0014 | 0.0052 | 0.0248 | 0.0035 | 0.0056 |
| b65(Ta·c) | b66(Ta·ch) | b67(c·ch) | b68(c·d) | |||||
| 系数反演值 | 0.1394 | -0.1162 | -0.2893 | 0.0022 | ||||
| 相应项贡献率 | 0.0118 | 0.0119 | 0.0474 | 4.3×10⁻⁶ |
太平洋涛动指数PDO,南极气候两项指标,虽然从表2中看不出其一次项对季风变化的影响,但相关项总贡献率分别达到6.45%和5.23%,它们主要通过与其它因子的交叉作用来驱动亚洲季风的变化。从反演结果来看,达索普冰芯δ18O,大气中SO4盐含量,无论是一次项贡献率还是总贡献率(1.1%)均相对较小,然而这两项指标对近千年亚洲季风强度的波动仍然有着无法忽略的驱动能力。在试算的过程中,不管去掉任何一项指标,用剩余的12项指标重新进行反演,得到的模拟效果均会和真实值变化趋势存在较大的差异,这说明这两项指标在细节上对近千年亚洲季风变化都会起到不同程度的调节作用。
季风的形成和变迁随着太阳辐射变化、海陆温度变化、全球冰量变化、青藏高原的隆升等发生着不停的变化[3, 15],近千年季风变化虽然对季风历史变化是极为短暂的时期,但这一时期的季风变化对全球气候,人类的生产生活均会产生极为重要的影响,同时,反过来,全球气候变化和人类活动对季风变化也有着非常明显的驱动力。
本文通过反演的方法,根据已有的观测资料,来反推对季风有影响的各项因子和季风强度变化之间的变化规律,即反演公式,根据反演结果得到这些因子对季风的影响程度,得到以下结论:
1) 近千年亚洲季风变化受到各项气候代用指标之间复杂的非线性驱动力作用,而非单纯受到线性驱动。
2) 前一年的亚洲季风强度对后一年的季风变化有着不可忽视的影响,并且线性负反馈稳定作用较为明显。
3) 温室气体中CO2气体含量对亚洲季风系统起到非常重要的作用,同时CH4气体的含量也起到较为关键的作用。但单从反演结果来看,N2O气体含量对亚洲季风变化几乎没有什么影响。
4) 印度洋海表温度、南方涛动指数、格陵兰温度、北大西洋海表温度、北半球温度,都对亚洲季风有较大的驱动作用。
5) 太阳活动变化是长时间尺度季风波动的主要驱动力,但由于指标精度的原因,在近千年的短时间尺度上,太阳活动对亚洲季风变化的影响在我们的反演过程中很难直接体现出来,但从其他因素如海表温度、北半球温度等影响上也间接显示出太阳活动对亚洲季风强度变化有着极为重要的作用。
6) 太平洋涛动指数,南极温度与其他因子一起共同驱动近千年亚洲季风变化。
7) 西藏地区气候变化,火山活动产生的大气中SO4盐含量对近千年亚洲季风强度的波动也具有无法忽略的驱动能力,它们在细节上对季风变化起着一定的调节作用。
本文主要的不足之处在于代用指标的选取,有些对亚洲季风变化的可能存在较大影响的指标,如西太平洋海表温度,西伯利亚地区温度等没有查找到公开的资料,因此非常遗憾数据的缺失会造成反演的结果无法更为精确而真实地反映实际情况。另外有些指标如南极冰芯δ18O其分辨率较低,在必须采用的数据插值过程中,不可避免地会造成部分数据的失真。
The authors have declared that no competing interests exist.
| [1] |
Causes of climate change over the past 1000 years [J].https://doi.org/10.1126/science.289.5477.270 URL PMID: 10894770 [本文引用: 3] 摘要
Recent reconstructions of Northern Hemisphere temperatures and climate forcing over the past 1000 years allow the warming of the 20th century to be placed within a historical context and various mechanisms of climate change to be tested. Comparisons of observations with simulations from an energy balance climate model indicate that as much as 41 to 64% of pre-anthropogenic (pre-1850) decadal-sc...
|
| [2] |
The evolution of climate over the last millennium [J].https://doi.org/10.1126/science.1059126 URL PMID: 11326088 [本文引用: 1] 摘要
Knowledge of past climate variability is crucial for understanding and modeling current and future climate trends. This article reviews present knowledge of changes in temperatures and two major circulation features-El Ni帽o-Southern Oscillation (ENSO) and the North Atlantic Oscillation (NAO)-over much of the last 1000 years, mainly on the basis of high-resolution paleoclimate records. Average temperatures during the last three decades were likely the warmest of the last millennium, about 0.2 degrees C warmer than during warm periods in the 11th and 12th centuries. The 20th century experienced the strongest warming trend of the millennium (about 0.6 degrees C per century). Some recent changes in ENSO may have been unique since 1800, whereas the recent trend to more positive NAO values may have occurred several times since 1500. Uncertainties will only be reduced through more extensive spatial sampling of diverse proxy climatic records.
|
| [3] |
全球季风和季风边缘研究 [J].
<p>全球卫星探测和观测资料的积累,使以南海季风、亚洲季风为代表的季风研究兴起了一波研究热潮。区域季风认识的深入,推动了全球季风认识的发展,全球季风概念在20世纪末被提出来,并在21世纪初成为热点研究方向。季风边缘是与全球季风密切相关的概念,东亚夏季风北边缘的近期演变与全球季风过去几十年的减弱有关。全球季风的演变表现为分布全球的大气活动中心和季风槽的活动,[JP2]这些成员组成了一个完整的全球季风系统。按照上述季风研究的发展脉络,系统地总结全球季风和季风边缘研究的进展,并提出未来季风研究的方向会把全球大气活动中心与全球气候槽,包括全球季风槽联系起来,即从季风系统着手研究全球季风的年代际和世纪尺度变率。</p>
Review of the global monsoon and monsoon marginal zones.
<p>全球卫星探测和观测资料的积累,使以南海季风、亚洲季风为代表的季风研究兴起了一波研究热潮。区域季风认识的深入,推动了全球季风认识的发展,全球季风概念在20世纪末被提出来,并在21世纪初成为热点研究方向。季风边缘是与全球季风密切相关的概念,东亚夏季风北边缘的近期演变与全球季风过去几十年的减弱有关。全球季风的演变表现为分布全球的大气活动中心和季风槽的活动,[JP2]这些成员组成了一个完整的全球季风系统。按照上述季风研究的发展脉络,系统地总结全球季风和季风边缘研究的进展,并提出未来季风研究的方向会把全球大气活动中心与全球气候槽,包括全球季风槽联系起来,即从季风系统着手研究全球季风的年代际和世纪尺度变率。</p>
|
| [4] |
Global monsoon:dominant mode of annual variation in the tropics [J].https://doi.org/10.1016/j.dynatmoce.2007.05.002 URL [本文引用: 1] 摘要
The three-parameter precipitation climatology metrics and global monsoon domain proposed in the present paper provides a valuable objective tool for gauging the climate models’ performance on simulation and prediction of the mean climate and annual cycle. The metrics are used to evaluate the precipitation climatology in three global reanalysis products (ERA40, NCEP2, and JRA25) in terms of their pattern correlation coefficients and root mean square errors with reference to observations. The ensemble mean of the three analysis datasets is considerably superior to any of the individual reanalysis data in representing annual mean, annual cycle, and the global monsoon domain. A major common deficiency is found over the Southeast Asia-Philippine Sea and southeast North America-Caribbean Sea where the east–west land–ocean thermal contrast and meridional hemispheric thermal contrast coexist. It is speculated that the weakness is caused by models’ unrealistic representation of Subtropical High and under-represented tropical storm activity, as well as by neglecting atmosphere–ocean interaction in the reanalysis. It is recommended that ensemble mean of reanalysis datasets be used for improving global precipitation climatology and water cycle budget. This paper also explains why the latitudinal asymmetry in the tropical circulation decreases with altitude.
|
| [5] |
石笋氧碳同位素古气候代用指标研究进展 [J].https://doi.org/10.3969/j.issn.1006-7493.2009.02.004 URL [本文引用: 1] 摘要
洞穴石笋以其独立的绝对年龄和稳定的古气候代用指标而成为很好的陆地古气候研究材料。应用U系定年,可以获得独立精确的日历年时间序列,结合年纹层统计,可以获得年际甚至是季节性变化古气候记录。作为古气候代用指标,石笋氧同位素具有全球可对比性,现已建立了氧同位素的全球气候变化曲线,显示了比深海氧同位素及极地冰芯氧同位素记录更多的优势。石笋δ18O的影响因素很多,在东亚季风控制区和其它季风控制区,石笋的δ18O反映了夏季风的强度或者是季风降雨的变化。这些全球可对比的具有高精度绝对定年的石笋δ18O记录,突破了早期的单一温度控制机理,不仅为古气候学家提供了坚实的古气候变化时间序列,而且使古气候研究能从机理上探讨其变化规律。δ13C不如δ18O具有全球可对比性,在同位素平衡的开放体系,石笋δ13C主要反映了洞穴上覆土壤CO2的同位素特征。因此,一般认为石笋δ13C可直接反映当地植被的特征,包括植被类型C3/C4比率的变化及植被的茂盛与衰退,在一些地区也可作为大气降水和温度变化的指标。石笋δ13C很易受到蒸发作用、滴水的快速去气、动力分馏、碳酸盐的先期沉积等影响而使得其数值偏正,应该予以重视。通过介绍石笋氧碳同位素的研究现状,使得读者对石笋的稳定同位素指标有一个初步认识。同时,对今后的研究方向给与一定的探讨。
Advance in study of Oxygen and Carbon isotope variations in cave stalagmites as Palaeo-Climate proxies. https://doi.org/10.3969/j.issn.1006-7493.2009.02.004 URL [本文引用: 1] 摘要
洞穴石笋以其独立的绝对年龄和稳定的古气候代用指标而成为很好的陆地古气候研究材料。应用U系定年,可以获得独立精确的日历年时间序列,结合年纹层统计,可以获得年际甚至是季节性变化古气候记录。作为古气候代用指标,石笋氧同位素具有全球可对比性,现已建立了氧同位素的全球气候变化曲线,显示了比深海氧同位素及极地冰芯氧同位素记录更多的优势。石笋δ18O的影响因素很多,在东亚季风控制区和其它季风控制区,石笋的δ18O反映了夏季风的强度或者是季风降雨的变化。这些全球可对比的具有高精度绝对定年的石笋δ18O记录,突破了早期的单一温度控制机理,不仅为古气候学家提供了坚实的古气候变化时间序列,而且使古气候研究能从机理上探讨其变化规律。δ13C不如δ18O具有全球可对比性,在同位素平衡的开放体系,石笋δ13C主要反映了洞穴上覆土壤CO2的同位素特征。因此,一般认为石笋δ13C可直接反映当地植被的特征,包括植被类型C3/C4比率的变化及植被的茂盛与衰退,在一些地区也可作为大气降水和温度变化的指标。石笋δ13C很易受到蒸发作用、滴水的快速去气、动力分馏、碳酸盐的先期沉积等影响而使得其数值偏正,应该予以重视。通过介绍石笋氧碳同位素的研究现状,使得读者对石笋的稳定同位素指标有一个初步认识。同时,对今后的研究方向给与一定的探讨。
|
| [6] |
Edwards R L et al. Millennial- and orbital-scale changes in the East Asian monsoon over the past 224,000 years [J].https://doi.org/10.1038/nature06692 URL PMID: 18305541 [本文引用: 1] 摘要
High-resolution speleothem records from China have provided insights into the factors that control the strength of the East Asian monsoon. Our understanding of these factors remains incomplete,however,owing to gaps in the record of monsoon history over the past two interglacial-glacial cycles. In particular,missing sections have hampered our ability to test ideas about orbital-scale controls on the monsoon,the causes of millennial-scale events and relationships between changes in the monsoon and climate in other regions. Here we presented an absolute-dated oxygen isotope record from Sanbao cave,central China,that completes a Chinese-cave-based record of the strength of the East Asian monsoon that covers the past 224,000 years. The record is dominated by 23,000-year-long cycles that are synchronous within dating errors with summer insolation at 65掳 N,supporting the idea that tropical/subtropical monsoons respond dominantly and directly to changes in Northern Hemisphere summer insolation on orbital timescales. The cycles are punctuated by millennial-scale strong-summer-monsoon events (Chinese interstadials),and the new record allows us to identify the complete series of these events over the past two interglacial-glacial cycles. Their duration decreases and their frequency increases during glacial build-up in both the last and penultimate glacial periods,indicating that ice sheet size affects their character and pacing. The ages of the events are exceptionally well constrained and may thus serve as benchmarks for correlating and calibrating climate records.
|
| [7] |
Edwards R L et al. A high-resolution absolute-dated late Pleistocene Monsoon record from Hulu Cave, China [J].URL PMID: 32860656053592475467236292223222211743199817142016923407011471 [本文引用: 2] |
| [8] |
石笋密度蕴含的过去气候变化信息:以末次冰消期黄土高原西部武都万象洞石笋为例 [J].Magsci 摘要
<p>亚洲季风区边缘甘肃武都万象洞一根石笋(WX42A)在末次冰消期不同生长时期密度变化表现出有规律的波动. 高精度<sup>230</sup>Th测年和高分辨率的石笋密度结果表明, 生长于17644~12758 a BP之间石笋密度变化时间序列在长时间尺度上与反映亚洲季风强度变化的石笋<em>δ</em><sup>18</sup>O记录变化趋势非常一致, 显示出季风强度增强/减弱(<em>δ</em><sup>18</sup>O值偏轻/偏重), 石笋密度随之增大/减小的特征; 在短时间尺度上石笋密度的降低也对应于一些季风减弱事件如Inter-Allerød Cold Period (IACP)、Older Dryas (OD)和Inter-Bølling Cold Period (IBCP). 总体上, 石笋密度的降低是对季风减弱、降水量减少造成洞穴滴水速率降低、结晶核减少和晶体增大、生物活动强度减弱和土壤CO<sub>2</sub>分压降低、碎屑杂质物质增多的反映. 然而在季风极端减弱、降水量大幅度减少和生物活动强度减弱时期, 温度的变化将主导石笋密度的变化, 如在北大西洋H-1事件温度突然降低时, 石笋密度却突然增大, 这是由环境温度的突然降低使得少量下渗水在低温下溶解的碳酸氢钙浓度升高、溶液过饱和度升高而形成晶体规则紧密排列且密度较大的石笋矿物所造成的. 这种灵敏记录石笋生长历史和外界环境变化的过去石笋密度随着时间波动, 说明石笋密度在过去气候变化研究中具有极大的潜力.</p>
Sang Wencui et al. Implications of stalagmite density for past climate change: An example from stalagmitegrowth during the last deglaciation from Wanxiang Cave,western Loess Plateau. Magsci 摘要
<p>亚洲季风区边缘甘肃武都万象洞一根石笋(WX42A)在末次冰消期不同生长时期密度变化表现出有规律的波动. 高精度<sup>230</sup>Th测年和高分辨率的石笋密度结果表明, 生长于17644~12758 a BP之间石笋密度变化时间序列在长时间尺度上与反映亚洲季风强度变化的石笋<em>δ</em><sup>18</sup>O记录变化趋势非常一致, 显示出季风强度增强/减弱(<em>δ</em><sup>18</sup>O值偏轻/偏重), 石笋密度随之增大/减小的特征; 在短时间尺度上石笋密度的降低也对应于一些季风减弱事件如Inter-Allerød Cold Period (IACP)、Older Dryas (OD)和Inter-Bølling Cold Period (IBCP). 总体上, 石笋密度的降低是对季风减弱、降水量减少造成洞穴滴水速率降低、结晶核减少和晶体增大、生物活动强度减弱和土壤CO<sub>2</sub>分压降低、碎屑杂质物质增多的反映. 然而在季风极端减弱、降水量大幅度减少和生物活动强度减弱时期, 温度的变化将主导石笋密度的变化, 如在北大西洋H-1事件温度突然降低时, 石笋密度却突然增大, 这是由环境温度的突然降低使得少量下渗水在低温下溶解的碳酸氢钙浓度升高、溶液过饱和度升高而形成晶体规则紧密排列且密度较大的石笋矿物所造成的. 这种灵敏记录石笋生长历史和外界环境变化的过去石笋密度随着时间波动, 说明石笋密度在过去气候变化研究中具有极大的潜力.</p>
|
| [9] |
Asynchronous evolution of the Indian and East Asian Summer Monsoon indicated by Holocene moisture patterns in monsoonal central Asia [J].https://doi.org/10.1016/j.earscirev.2010.09.004 URL 摘要
中国科学院机构知识库(中国科学院机构知识库网格(CAS IR GRID))以发展机构知识能力和知识管理能力为目标,快速实现对本机构知识资产的收集、长期保存、合理传播利用,积极建设对知识内容进行捕获、转化、传播、利用和审计的能力,逐步建设包括知识内容分析、关系分析和能力审计在内的知识服务能力,开展综合知识管理。
|
| [10] |
近千年中国东部夏季气候百年尺度变化的模拟分析 [J].
<p>利用全球海气耦合模式ECHO-G 近千年积分模拟试验结果, 通过Lanczos 滤波器滤去100 年以下的年际-年代际变化信号, 保留百年尺度的气候变化信息, 分析了近千年来中国东部夏季气候在百年尺度上的时空变化特征并探讨了影响其变化的主要原因. 结果表明: (1) 近千年中国东部经历了暖-冷-暖3 个阶段, 由暖期进入冷期相对由冷期进入暖期缓慢, 暖期降水多冷期降水少, 降水的峰谷变化滞后于温度. 有效太阳辐射和太阳辐照度分别是影响温度和降水变化最显著的因子, 现代暖期之前火山活动的增强对极端低温的出现有明显影响, 火山活动与降水在1400 AD之前为正相关, 在1400 AD 之后为负相关, 温室气体浓度与现代暖期温度和降水有一致的变化趋势. (2) 温度的百年尺度与年际-年代际尺度的第一特征向量的空间分布型都为全区一致分布, 高纬的变率大于低纬, 这一分布型主要受有效太阳辐射和温室气体的共同影响. 降水第一特征向量的空间分布型在百年尺度与年际-年代际尺度上存在着显著差别, 百年尺度为全区一致的分布, 而在年际-年代际尺度上长江和黄河中下游与其两侧的区域呈反相分布, 太阳辐照度和温室气体共同影响了降水百年尺度上的这一空间分布型.</p>
Wang Zhiyuan et al. Simulated analysis of summer climate on centennial time scale in eastern China during the last millennium.
<p>利用全球海气耦合模式ECHO-G 近千年积分模拟试验结果, 通过Lanczos 滤波器滤去100 年以下的年际-年代际变化信号, 保留百年尺度的气候变化信息, 分析了近千年来中国东部夏季气候在百年尺度上的时空变化特征并探讨了影响其变化的主要原因. 结果表明: (1) 近千年中国东部经历了暖-冷-暖3 个阶段, 由暖期进入冷期相对由冷期进入暖期缓慢, 暖期降水多冷期降水少, 降水的峰谷变化滞后于温度. 有效太阳辐射和太阳辐照度分别是影响温度和降水变化最显著的因子, 现代暖期之前火山活动的增强对极端低温的出现有明显影响, 火山活动与降水在1400 AD之前为正相关, 在1400 AD 之后为负相关, 温室气体浓度与现代暖期温度和降水有一致的变化趋势. (2) 温度的百年尺度与年际-年代际尺度的第一特征向量的空间分布型都为全区一致分布, 高纬的变率大于低纬, 这一分布型主要受有效太阳辐射和温室气体的共同影响. 降水第一特征向量的空间分布型在百年尺度与年际-年代际尺度上存在着显著差别, 百年尺度为全区一致的分布, 而在年际-年代际尺度上长江和黄河中下游与其两侧的区域呈反相分布, 太阳辐照度和温室气体共同影响了降水百年尺度上的这一空间分布型.</p>
|
| [11] |
The holocene Asian monsoon: links to solar changes and North Atlantic climate [J].URL PMID: 328303595889520224284972922232222158792168558233884069261937 [本文引用: 1] |
| [12] |
Yi Liang et al. Precipitation variations of Longxi,Northeast margin of Tibetan [J]. |
| [13] |
Rutter N W et al. Towards an orbital time scale for Chinese loess deposits [J]. |
| [14] |
Melice J L et al. Magnetic susceptibility record of Chinese loess [J]. |
| [15] |
东亚季风气候的历史与变率 [J].https://doi.org/10.3321/j.issn:0023-074X.2000.03.002 URL Magsci [本文引用: 3] 摘要
<p>东亚季风的变迁可视为太阳辐射条件下, 全球大气海洋陆地和冰系统相互作用在东亚地区的表现. 干冷冬季风和暖湿夏季风优势期的相互交替反映了东亚季风的历史. 高分辨率的黄土高原风尘序列研究揭示了东亚季风至少自7.2 Ma 前开始建立. 青藏高原的脉动对东亚季风变迁有重要影响, 数值模拟实验说明, 高原隆升对东亚冬季风的影响远大于对夏季风的影响. 末次冰期旋回气候记录显示了东亚季风气候千年或更短时间尺度的变率和不稳定性的特征. 北半球高纬冷空气活动穿越赤道的气流和ENSO 活动影响着东亚季风气候的变率. 有必要加强高分辨率季风气候记录的年代学和古气候替代性指标的研究,将东亚季风环境整体系统置于全球变化框架中, 研究各因子相互作用或相互耦合的过程, 以深入认识东亚古季风变迁的规律和变化机制.</p>
The history and variability of East Asian Monsoon. https://doi.org/10.3321/j.issn:0023-074X.2000.03.002 URL Magsci [本文引用: 3] 摘要
<p>东亚季风的变迁可视为太阳辐射条件下, 全球大气海洋陆地和冰系统相互作用在东亚地区的表现. 干冷冬季风和暖湿夏季风优势期的相互交替反映了东亚季风的历史. 高分辨率的黄土高原风尘序列研究揭示了东亚季风至少自7.2 Ma 前开始建立. 青藏高原的脉动对东亚季风变迁有重要影响, 数值模拟实验说明, 高原隆升对东亚冬季风的影响远大于对夏季风的影响. 末次冰期旋回气候记录显示了东亚季风气候千年或更短时间尺度的变率和不稳定性的特征. 北半球高纬冷空气活动穿越赤道的气流和ENSO 活动影响着东亚季风气候的变率. 有必要加强高分辨率季风气候记录的年代学和古气候替代性指标的研究,将东亚季风环境整体系统置于全球变化框架中, 研究各因子相互作用或相互耦合的过程, 以深入认识东亚古季风变迁的规律和变化机制.</p>
|
| [16] |
-year pacing of Dansgaard-Oeschger warm events [J].https://doi.org/10.1029/2000PA000571 URL [本文引用: 1] 摘要
Abstract Top of page Abstract 1.Introduction 2.Origin of the 1470-year Spectral Peak 3.A Template for the Onset of Dansgaard-Oeschger Events 4.Testing the Pacing of Dansgaard-Oeschger Events 5.Inferences About the Pacing Mechanism 6.Conclusions AppendixA Acknowledgments References [1] The oxygen isotope record from the Greenland Ice Sheet Project 2 (GISP2) ice core was reanalyzed in the frequency and time domains. The prominent 1470-year spectral peak, which has been associated with the occurrence of Dansgaard-Oeschger interstadial events, is solely caused by Dansgaard-Oeschger events 5, 6, and 7. This result emphasizes the nonstationary character of the oxygen isotope time series. Nevertheless, a fundamental pacing period of 651470 years seems to control the timing of the onset of the Dansgaard-Oeschger events. A trapezoidal time series model is introduced which provides a template for the pacing of the Dansgaard-Oeschger events. Statistical analysis indicates only a ≤3% probability that the number of matches between observed and template-derived onsets of Dansgaard-Oeschger events between 13 and 46 kyr B.P. resulted by chance. During this interval the spacing of the Dansgaard-Oeschger onsets varied by ±20% around the fundamental 1470-year period and multiples thereof. The pacing seems unaffected by variations in the strength of North Atlantic Deep Water formation, suggesting that the thermohaline circulation was not the primary controlling factor of the pacing period.
|
| [17] |
关于季风动力学以及季风与ENSO循环相互作用的研究 [J].https://doi.org/10.3878/j.issn.1006-9895.2003.04.05 URL [本文引用: 1] 摘要
季风和ENSO是影响亚洲和中国气候变化的两大系统,随着气候动力学研究的深入,国内外学者对季风及其与ENSO循环相互作用的研究取得了很大进展.作者回顾了近年来国内外关于季风动力学以及季风与ENSO循环相互作用的研究进展,主要综述了中国学者关于亚洲季风的认识与表述的深化,特别是对于季风的特征、系统性和年循环现象的认识.还回顾了中国关于亚洲季风的季内、年际和年代际变化、亚洲季风与ENSO循环相互作用等方面的研究进展.此外,还提出在季风动力学以及季风与ENSO循环相互作用方面需进一步研究的问题.
Ding Yihui et al. Studies on the monsoon dynamics and the interaction between monsoon and ENSO cycle. https://doi.org/10.3878/j.issn.1006-9895.2003.04.05 URL [本文引用: 1] 摘要
季风和ENSO是影响亚洲和中国气候变化的两大系统,随着气候动力学研究的深入,国内外学者对季风及其与ENSO循环相互作用的研究取得了很大进展.作者回顾了近年来国内外关于季风动力学以及季风与ENSO循环相互作用的研究进展,主要综述了中国学者关于亚洲季风的认识与表述的深化,特别是对于季风的特征、系统性和年循环现象的认识.还回顾了中国关于亚洲季风的季内、年际和年代际变化、亚洲季风与ENSO循环相互作用等方面的研究进展.此外,还提出在季风动力学以及季风与ENSO循环相互作用方面需进一步研究的问题.
|
| [18] |
东亚季风和南亚季风的反相位关系及其与ENSO的联系:年际尺度和轨道尺度 [J].
近年来,众多研究表明东亚夏季风和南亚夏季风在年际尺度上存在着一定的反相关系。通过对 NCEP/NCAR资料以及GCM长期瞬变模拟结果的分析,进一步揭示除了年际尺度,在轨道尺度上东亚季风同南亚季风依然可能存在类似的反相位关系,而这 种反相关系同太平洋热状况的演化及古ENSO状态变化联系密切。在热带太平洋处于类ElNio态时,东亚夏季风变强,南亚夏季风减弱,而处于类LaNia 态时,东亚夏季风则减弱,同时南亚夏季风增强。这种不同时间尺度上季风响应的一致性为已发现的地质证据提供了更好的理解。
Inverse phase between South Asian and East Asian summer monsoons and its relation with ENSO:from interannual to orbital scale.
近年来,众多研究表明东亚夏季风和南亚夏季风在年际尺度上存在着一定的反相关系。通过对 NCEP/NCAR资料以及GCM长期瞬变模拟结果的分析,进一步揭示除了年际尺度,在轨道尺度上东亚季风同南亚季风依然可能存在类似的反相位关系,而这 种反相关系同太平洋热状况的演化及古ENSO状态变化联系密切。在热带太平洋处于类ElNio态时,东亚夏季风变强,南亚夏季风减弱,而处于类LaNia 态时,东亚夏季风则减弱,同时南亚夏季风增强。这种不同时间尺度上季风响应的一致性为已发现的地质证据提供了更好的理解。
|
| [19] |
Influence of volcanic eruptions on northen hemisphere summer temperature over the Past 600 years [J].https://doi.org/10.1038/30943 URL [本文引用: 1] 摘要
Presents research which concluded that large explosive volcanic eruptions produced different extents of Northern Hemisphere cooling during the past 600 years. Use of temperature-sensitive tree-ring-density chronologies; Large effect of some eruptions; Most severe cooling in 1601 due to the eruption of Huaynaputina, Peru, in 1600; Other strong cooling events.
|
| [20] |
Global-scale temperature patterns and climate forcing over the past six centuries [J].https://doi.org/10.1038/33859 URL 摘要
Spatially resolved global reconstructions of annual surface temperature patterns over the past six centuries are based on the multivariate calibration of widely distributed high-resolution proxy climate indicators. Time-dependent correlations of the reconstructions with time-series records representing changes in greenhouse-gas concentrations, solar irradiance, and volcanic aerosols suggest that each of these factors has contributed to the climate variability of the past 400 years, with greenhouse gases emerging as the dominant forcing during the twentieth century. Northern Hemisphere mean annual temperatures for three of the past eight years are warmer than any other year since (at least) AD 1400.
|
| [21] |
The global monsoon variability simulated by CMIP3 coupled climate models [J].https://doi.org/10.1175/2008JCLI2041.1 URL [本文引用: 1] 摘要
The trend in the Northern Hemisphere land monsoon index (NHMI) detected in the CMIP3 models is generally consistent with the observations, albeit with much weaker magnitude. The significant decreasing NHMI trend during 1951–85 and 1951–99 occurs mainly in the models with volcanic aerosols (VOL models). This volcanic signal is detectable by comparison of the forced and free runs. It is estimated that from about one-quarter to one-third of the drying trend in the Northern Hemisphere land monsoon precipitation over the latter half of the twentieth century was likely due to the effects of the external volcanic forcings. On the other hand, the significant increasing trend in the global ocean monsoon index (GOMI) during 1980–99 appears chiefly in those models that are free of volcanic aerosols (No-VOL models). The exclusion of the volcanic aerosols is significant in simulating the positive GOMI trend against the internal variability of each model. These results suggest the climatic importance of the volcanic forcings in the global monsoon precipitation variability.
|
| [22] |
Hegerl G C et al. Simulation of the influence of solar radiation variations on the global climate with an ocean-atmosphere general circulation model [J].https://doi.org/10.1007/s003820050196 URL [本文引用: 1] 摘要
Two simulations with a global coupled ocean-atmosphere circulation model have been carried out to study the potential impact of solar variability on climate. The Hoyt and Schatten estimate of solar variability from 1700 to 1992 has been used to force the model. Results indicate that the near-surface temperature simulated by the model is dominated by the long periodic solar fluctuations (Gleissberg cycle), with global mean temperatures varying by about 0.5 K. Further results indicate that solar variability and an increase in greenhouse gases both induce to a first approximation a comparable pattern of surface temperature change, i.e., an increase of the land-sea contrast. However, the solar-induced warming pattern in annual means and summer is more centered over the subtropics, compared to a more uniform warming associated with the increase in greenhouse gases. The observed temperature rise over the most recent 30 and 100 years is larger than the trend in the solar forcing simulation during the same period, indicating a strong likelihood that, if the model forcing and response is realistic, other factors have contributed to the observed warming. Since the pattern of the recent observed warming agrees better with the greenhouse warming pattern than with the solar variability response, it is likely that one of these factors is the increase of the atmospheric greenhouse gas concentration.
|
| [23] |
Miller R L et al. Northern hemisphere winter climate response to green house gas,ozone,solar,and volcanic forcing [J].https://doi.org/10.1029/2000JD900547 URL [本文引用: 1] 摘要
The Goddard Institute for Space Studies (GISS) climate-middle atmosphere model has been used to study the impacts of increasing greenhouse gases, polar ozone depletion, volcanic eruptions, and solar cycle variability. We focus on the projection of the induced responses onto Northern Hemisphere winter surface climate. Changes in the model's surface climate take place largely through enhancement of existing variability patterns, with greenhouse gases, polar ozone depletion, and volcanic eruptions primarily affecting the Arctic Oscillation (AO) pattern. Perturbations descend from the stratosphere to the surface in the model by altering the propagation of planetary waves coming up from the surface, in accord with observational evidence. Models lacking realistic stratospheric dynamics fail to capture these wave flux changes. The results support the conclusion that the stratosphere plays a crucial role in recent AO trends. We show that in our climate model, while ozone depletion has a significant effect, greenhouse gas forcing is the only one capable of causing the large, sustained increase in the AO observed over recent decades. This suggests that the AO trend, and a concurrent strengthening of the stratospheric vortex over the Arctic, are very likely anthropogenic in origin.
|
| [24] |
Li Hongmei et al. Ocean forcing to changes in global monsoon precipitation over the recent half-century [J].https://doi.org/10.1175/2008JCLI2067.1 URL [本文引用: 1] 摘要
Previous examination of changes in global monsoon precipitation over land reveals an overall weakening over the recent half-century (195009“2000). The present study suggests that this significant change in global land monsoon precipitation is deducible from the atmosphere0964s response to the observed SST variations. When forced by historical sea surface temperatures covering the same period, the ensemble simulation with the NCAR Community Atmosphere Model, version 2 (CAM2) model successfully reproduced the weakening tendency of global land monsoon precipitation. This decreasing tendency was mainly caused by the warming trend over the central-eastern Pacific and the western tropical Indian Ocean. At the interannual time scale, the global land monsoon precipitation is closely correlated with ENSO. The simulated interannual variation of the global land monsoon index matches well with the observation, indicating that most monsoon precipitation variations arise from the ocean forcing. There are uncertainties between the GPCP and the CMAP data in describing the evolution of global ocean monsoon precipitation. There is very little correspondence between the simulated and the observed global monsoon index over the ocean area. Uncertainties in the satellite data and model deficiencies in describing the ocean monsoon domain are partly to blame. Among the components of global monsoon systems, the Asian09“Australian monsoon system has the lowest reproducibility with prescribed SST forcing due to the neglect of air09“sea feedback.
|
| [25] |
|
| [26] |
利用观测资料反演非线性动力模型 [J].https://doi.org/10.1360/zb1991-21-3-331 URL [本文引用: 2] 摘要
本文提出了一种利用实际观测资料反演非线性动力模型的方法,并用Lorenz系统进行了检验.计算结果表明Lorenz系统可以用观测资料很精确地反演出来.用这种方法建立非线性动力模型具有广阔的应用前景.
https://doi.org/10.1360/zb1991-21-3-331 URL [本文引用: 2] 摘要
本文提出了一种利用实际观测资料反演非线性动力模型的方法,并用Lorenz系统进行了检验.计算结果表明Lorenz系统可以用观测资料很精确地反演出来.用这种方法建立非线性动力模型具有广阔的应用前景.
|
| [27] |
天津局地气候的反演建模及其研究 [J].https://doi.org/10.11676/qxxb1995.013 Magsci [本文引用: 2] 摘要
利用天津月平均温度<i>T</i>、气压<i>P</i>和雨量<i>R</i>的时间序列反演出一组近似描写天津(<i>T-P-R</i>)局地气候的动力方程,并对其演化特性及内部相互作用机制进行了研究。
The retrieved model of Tianjin local climate. https://doi.org/10.11676/qxxb1995.013 Magsci [本文引用: 2] 摘要
利用天津月平均温度<i>T</i>、气压<i>P</i>和雨量<i>R</i>的时间序列反演出一组近似描写天津(<i>T-P-R</i>)局地气候的动力方程,并对其演化特性及内部相互作用机制进行了研究。
|
| [28] |
轨道尺度东亚夏季风的动力反演 [J].https://doi.org/10.3969/j.issn.1001-7410.2013.03.21 Magsci [本文引用: 2] 摘要
为了探求太阳辐射和高纬地区温度对东亚夏季风的驱动机理,用动力反演的方法建立了东亚夏季风的动力方程,为东亚夏季风的驱动机制研究提供了一种新的方法。在轨道尺度上得到如下结论: 东亚夏季风是由南极温度和太阳辐射量共同驱动的复杂非线性动力系统; 太阳辐射是驱动东亚夏季风的最重要驱动力,驱动贡献至少达到67.57%,南极温度次之,其驱动贡献达到21.58%,格陵兰温度对东亚夏季风的驱动不起作用; 太阳辐射量的增加,会驱使东亚夏季风增强; 南极温度存在一个阈值,在阈值两侧,对东亚夏季风具有不同的驱动机制; 东亚夏季风对太阳辐射驱动的响应,还部分地依赖于季风强度的背景值。
The dynamic inversion of orbital-scale East Asian summer monsoon. https://doi.org/10.3969/j.issn.1001-7410.2013.03.21 Magsci [本文引用: 2] 摘要
为了探求太阳辐射和高纬地区温度对东亚夏季风的驱动机理,用动力反演的方法建立了东亚夏季风的动力方程,为东亚夏季风的驱动机制研究提供了一种新的方法。在轨道尺度上得到如下结论: 东亚夏季风是由南极温度和太阳辐射量共同驱动的复杂非线性动力系统; 太阳辐射是驱动东亚夏季风的最重要驱动力,驱动贡献至少达到67.57%,南极温度次之,其驱动贡献达到21.58%,格陵兰温度对东亚夏季风的驱动不起作用; 太阳辐射量的增加,会驱使东亚夏季风增强; 南极温度存在一个阈值,在阈值两侧,对东亚夏季风具有不同的驱动机制; 东亚夏季风对太阳辐射驱动的响应,还部分地依赖于季风强度的背景值。
|
| [29] |
基于动力反演方法的亚洲季风机制探讨 [J].
<p>为探求董哥洞石笋δ<sup>18</sup>O值所指示的亚洲季风的驱动机制,用非线性动力反演的方法建立亚洲季风的动力方程。研究发现:董哥洞石笋δ<sup>18</sup>O值所指示的季风为印度季风,印度季风系统是由南极温度和其他驱动因子共同驱动的复杂非线性动力系统;太阳活动、北极温度和青藏高原温度对印度季风起稳定作用,太阳活动越强烈,稳定作用越弱;北极温度和青藏高原温度越高,稳定作用越弱;印度季风背景值对下一刻印度季风起稳定作用,且强度越大,稳定作用也就越强。</p>
The exploring of the Asian monsoon driving mechanism based on dynamical inversion method.
<p>为探求董哥洞石笋δ<sup>18</sup>O值所指示的亚洲季风的驱动机制,用非线性动力反演的方法建立亚洲季风的动力方程。研究发现:董哥洞石笋δ<sup>18</sup>O值所指示的季风为印度季风,印度季风系统是由南极温度和其他驱动因子共同驱动的复杂非线性动力系统;太阳活动、北极温度和青藏高原温度对印度季风起稳定作用,太阳活动越强烈,稳定作用越弱;北极温度和青藏高原温度越高,稳定作用越弱;印度季风背景值对下一刻印度季风起稳定作用,且强度越大,稳定作用也就越强。</p>
|
| [30] |
Edwards R L et al. A test of climate, sun, and culture relationships from an 1810-year Chinese cave record [J].https://doi.org/10.1126/science.1163965 URL PMID: 18988851 [本文引用: 4] 摘要
A record from Wanxiang Cave, China, characterizes Asian Monsoon (AM) history over the past 1810 years. The summer monsoon correlates with solar variability, Northern Hemisphere and Chinese temperature, Alpine glacial retreat, and Chinese cultural changes. It was generally strong during Europe's Medieval Warm Period and weak during Europe's Little Ice Age, as well as during the final decades of the Tang, Yuan, and Ming Dynasties, all times that were characterized by popular unrest. It was strong during the first several decades of the Northern Song Dynasty, a period of increased rice cultivation and dramatic population increase. The sign of the correlation between the AM and temperature switches around 1960, suggesting that anthropogenic forcing superseded natural forcing as the major driver of AM changes in the late 20th century.
|
| [31] |
中国黄土高原西缘甘肃万象洞MIS5石笋δ18O记录与南方地区石笋记录的对比研究 [J].Comparison of δ18O record during MIS5 in Wanxiang cave stalagmite Gansu Province of western Loess Plateau and those of southern China stalagmites. |
| [32] |
近千年来三个气候特征时期东亚夏季风的模拟对比 [J].
<p>利用全球海气耦合气候模式ECHO-G的近千年连续积分资料,选取与降水关系较好的东亚夏季风指数,对不同气候特征时期的东亚环流及季风影响因子进行了探讨。结果表明用海陆热力差异定义的东亚夏季风指数Isun在年际尺度上较好地体现了长江流域及华北地区降水的变化,而利用850 hPa纬向风场定义的指数Iwang在年代际尺度上较好地体现了长江流域的降水变化。从不同气候特征时期的环流来看,中世纪暖期夏季风最强,东亚大陆降水明显偏多,现代暖期夏季风较之有所减弱,而小冰期则是夏季风最弱的时期,东亚大陆的降水明显偏少。不同气候特征时期夏季风指数与海温的相关表明,ENSO事件对东亚夏季风的影响在现代暖期有所增强,而与外部强迫因子的相关揭示出中世纪暖期有效太阳辐射变化是影响东亚夏季风变化的主要因子,现代暖期则是温室气体对夏季风的影响更重要。</p>
Lin Huijuan et al. Comparison of East Asian summer monsoon in three climate typical periods during last millennium based on ECHO-G simulation.
<p>利用全球海气耦合气候模式ECHO-G的近千年连续积分资料,选取与降水关系较好的东亚夏季风指数,对不同气候特征时期的东亚环流及季风影响因子进行了探讨。结果表明用海陆热力差异定义的东亚夏季风指数Isun在年际尺度上较好地体现了长江流域及华北地区降水的变化,而利用850 hPa纬向风场定义的指数Iwang在年代际尺度上较好地体现了长江流域的降水变化。从不同气候特征时期的环流来看,中世纪暖期夏季风最强,东亚大陆降水明显偏多,现代暖期夏季风较之有所减弱,而小冰期则是夏季风最弱的时期,东亚大陆的降水明显偏少。不同气候特征时期夏季风指数与海温的相关表明,ENSO事件对东亚夏季风的影响在现代暖期有所增强,而与外部强迫因子的相关揭示出中世纪暖期有效太阳辐射变化是影响东亚夏季风变化的主要因子,现代暖期则是温室气体对夏季风的影响更重要。</p>
|
| [33] |
Knudsen K L et al. Reconstructions of surface ocean conditions from the Northeast Atlantic and Nordic seas during the last millennium [J].https://doi.org/10.1177/0959683613479677 Magsci [本文引用: 1] 摘要
We undertake the first comprehensive effort to integrate North Atlantic marine climate records for the last millennium, highlighting some key components common within this system at a range of temporal and spatial scales. In such an approach, careful consideration needs to be given to the complexities inherent to the marine system. Composites therefore need to be hydrographically constrained and sensitive to both surface water mass variability and three-dimensional ocean dynamics. This study focuses on the northeast (NE) North Atlantic Ocean, particularly sites influenced by the North Atlantic Current. A composite plus regression approach is used to create an inter-regional NE North Atlantic reconstruction of sea surface temperature (SST) for the last 1000 years. We highlight the loss of spatial information associated with large-scale composite reconstructions of the marine environment. Regional reconstructions of SSTs off the Norwegian and Icelandic margins are presented, along with a larger-scale reconstruction spanning the NE North Atlantic. The latter indicates that the Medieval Climate Anomaly' warming was most pronounced before ad 1200, with a long-term cooling trend apparent after ad 1250. This trend persisted until the early 20th century, while in recent decades temperatures have been similar to those inferred for the Medieval Climate Anomaly'. The reconstructions are consistent with other independent records of sea-surface and surface air temperatures from the region, indicating that they are adequately capturing the climate dynamics of the last millennium. Consequently, this method could potentially be used to develop large-scale reconstructions of SSTs for other hydrographically constrained regions.
|
| [34] |
Wang Yuhong et al. A record of the Southern Oscillation Index for thepast 2,000 years from precipitation proxies [J]. |
| [35] |
Variations in the pacific decadal oscillation over the past millennium [J].https://doi.org/10.1029/2005GL022478 URL [本文引用: 1] 摘要
Hydrologically sensitive tree-ring chronologies from Pinus flexilis in California and Alberta were used to produce an AD 993-1996 reconstruction of the Pacific Decadal Oscillation (PDO) and to assess long-term variability in the PDO's strength and periodicity. The reconstruction indicates that a ~50 to 70 year periodicity in the PDO is typical for the past 200 years but, was only intermittently a strong mode of variability prior to that. Between AD 1600 and 1800 there is a general absence of significant variability within the 50 to 100 year frequency range. Significant variability within in the frequency range of 50 to 100 years reemerges between AD 1500 and 1300 and AD 1200 to 1000. A prolonged period of strongly negative PDO values between AD 993 and 1300 is contemporaneous with a severe medieval megadrought that is apparent in many proxy hydrologic records for the western United States and Canada.
|
| [36] |
Severinghaus J P et al. High variability of Greenland surface temperature over the past 4000 years estimated from trapped air in an ice core [J].https://doi.org/10.1029/2011gl049444 URL [本文引用: 1] 摘要
Greenland recently incurred record high temperatures and ice loss by melting, adding to concerns that anthropogenic warming is impacting the Greenland ice sheet and in turn accelerating global sea-level rise. Yet, it remains imprecisely known for Greenland how much warming is caused by increasing atmospheric greenhouse gases versus natural variability. To address this need, we reconstruct Greenland surface snow temperature variability over the past 4000 years at the GISP2 site (near the Summit of the Greenland ice sheet; hereafter referred to as Greenland temperature) with a new method that utilises argon and nitrogen isotopic ratios from occluded air bubbles. The estimated average Greenland snow temperature over the past 4000 years was -30.7掳C with a standard deviation of 1.0掳C and exhibited a long-term decrease of roughly 1.5掳C, which is consistent with earlier studies. The current decadal average surface temperature (2001-2010) at the GISP2 site is -29.9掳C. The record indicates that warmer temperatures were the norm in the earlier part of the past 4000 years, including century-long intervals nearly 1掳C warmer than the present decade (2001-2010). Therefore, we conclude that the current decadal mean temperature in Greenland has not exceeded the envelope of natural variability over the past 4000 years, a period that seems to include part of the Holocene Thermal Maximum. Notwithstanding this conclusion, climate models project that if anthropogenic greenhouse gas emissions continue, the Greenland temperature would exceed the natural variability of the past 4000 years sometime before the year 2100.
|
| [37] |
2,000-year-long temperature and hydrology reconstructions from the Indo-Pacific warm pool [J].https://doi.org/10.1038/nature08233 URL PMID: 19713927 [本文引用: 1] 摘要
Northern Hemisphere surface temperature reconstructions suggest that the late twentieth century was warmer than any other time during the past 500 years and possibly any time during the past 1,300 years (refs 1, 2). These temperature reconstructions are based largely on terrestrial records from extra-tropical or high-elevation sites; however, global average surface temperature changes closely follow those of the global tropics, which are 75% ocean. In particular, the tropical -Pacific warm pool (IPWP) represents a major heat reservoir that both influences global atmospheric circulation and responds to remote northern high-latitude forcings. Here we present a decadally resolved continuous sea surface temperature () reconstruction from the IPWP that spans the past two millennia and overlaps the instrumental record, enabling both a direct comparison of proxy data to the instrumental record and an evaluation of past changes in the context of twentieth century trends. Our record from the Makassar Strait, Indonesia, exhibits trends that are similar to a recent Northern Hemisphere temperature reconstruction. Reconstructed was, however, within error of modern values from about ad 1000 to ad 1250, towards the end of the Medieval Warm Period. during the Little Ice Age (approximately ad 1550-1850) were variable, and approximately 0.5 to 1 degrees C colder than modern values during the coldest intervals. A companion reconstruction of (18)O of sea -a sea surface salinity and hydrology indicator-indicates a tight coupling with the East Asian monsoon system and remote control of IPWP hydrology on centennial-millennial timescales, rather than a dominant influence from local variation.
|
| [38] |
Jouzel J et al. A 30,000-yr isotope climatic record from Antarctic ice [J]. |
| [39] |
Trudinger C et al. The law dome CO2,CH4 and N2O ice core records extended to 2000 years BP [J]. |
| [40] |
Fischer H et al. Spatio-temporal variability in volcanic sulphate deposition over the past 2 kyr in snow pits and firn cores from Amundsenisen, Antarctica [J].https://doi.org/10.3189/172756504781830222 URL [本文引用: 1] 摘要
In the framework of the European Project for Ice Coring in Antarctica (EPICA), a comprehensive glaciological pre-site survey has been carried out on Amundsenisen, Dronning Maud Land, East Antarctica, in the past decade. Within this survey, four intermediate-depth ice cores and 13 snow pits were analyzed for their ionic composition and interpreted with respect to the spatial and temporal variability of volcanic sulphate deposition. The comparison of the non-sea-salt (nss)-sulphate peaks that are related to the well-known eruptions of Pinatubo and Cerro Hudson in AD 1991 revealed sulphate depositions of comparable size (15.8 卤 3.4 kg km) in 11 snow pits. There is a tendency to higher annual concentrations for smaller snow-accumulation rates. The combination of seasonal sodium and annually resolved nss-sulphate records allowed the establishment of a time-scale derived by annual-layer counting over the last 2000 years and thus a detailed chronology of annual volcanic sulphate deposition. Using a robust outlier detection algorithm, 49 volcanic eruptions were identified between AD 165 and 1997. The dating uncertainty is 卤3 years between AD 1997 and 1601, around 卤5 years between AD 1601 and 1257, and increasing to 卤24 years at AD 165, improving the accuracy of the volcanic chronology during the penultimate millennium considerably.
|
| [41] |
A High-Resolution Millennial Record of the South Asian Monsoon from Himalayan Ice Cores. https://doi.org/10.1126/science.289.5486.1916 URL PMID: 10988068 [本文引用: 1] 摘要
A high-resolution ice core record from Dasuopu, Tibet, reveals that this site is sensitive to fluctuations in the intensity of the South Asian Monsoon. Reductions in monsoonal intensity are recorded by dust and concentrations. The deeper, older sections of the Dasuopu cores suggest many other periods of drought in this region, but none have been of greater intensity than the greatest recorded drought, during 1790 to 1796 A.D. of the last millennium. The 20th century increase in anthropogenic activity in India and Nepal, upwind from this site, is recorded by a doubling of concentrations and a fourfold increase in dust. Like other ice cores from the Tibetan Plateau, Dasuopu suggests a large-scale, plateau-wide 20th-century warming trend that appears to be amplified at higher elevations.
|

/
| 〈 |
|
〉 |