李国庆 , 张春华
, 张春华
Li Guoqing, Zhang Chunhua
中图分类号: P951
文献标识码: A
文章编号: 1000-0690(2016)06-0959-06
收稿日期: 2015-08-15
修回日期: 2015-11-4
网络出版日期: 2016-10-20
版权声明: 2016 《地理科学》编辑部 本文是开放获取期刊文献,在以下情况下可以自由使用:学术研究、学术交流、科研教学等,但不允许用于商业目的.
基金资助:
作者简介:
作者简介:李国庆(1982-),男,黑龙江巴彦人,讲师,博士,主要从事草原生态遥感、湿地环境遥感方面的研究。E-mail:ligqing@foxmail.com
展开
摘要
利用2000~2014年的MOD13Q1-NDVI数据,对内蒙古灰腾梁风电场及该电厂50 km缓冲区内的植被生长情况进行了分析。结合气象数据,重点探讨了风向对植被生长的影响。与2000~2008年风电场建设完成前植被生长相比,2008年后风电场运行对植被的生长产生了明显的影响,但影响范围和强度是不均匀的,结果表明:① 风电场运行对风电场区域内/外植被的影响机制是不同的,风电场区域内不利于植被的生长,而上/下风区域却有利于植被的生长;② 相对于风电场建成前,风电场建成后的2008 ~2014年缓冲区和风电场区域植被恢复比例分别上升了26.66%和13.14%,但上风区域却上升了51.83%,下风区域上升了41.07%。可见风电场上/下风区植被恢复比例,尤其是上风区植被的恢复比例要远高于其它区域;③ 距离风电场中心30~40 km的上风区很可能是受风电场影响最为明显的区域。
关键词:
Abstract
With increasing environmental problems and a growing shortage of energy resources, wind as a renewable energy source is increasing in attention from various sectors. Currently, China′s energy policies are gradually turning to utilizing wind energy. Although there are many positive environmental benefits that wind energy provides, researchers around the world have recently begun to investigate environmental negative effects of wind energy development, and they are identifying the pros and cons of wind energy. Current investigations largely focus on vegetation, soil and animal disturbance due to wind farm construction, as well as focusing on possible impacts to the surrounding land surface temperature and local climate change. Existing research indicates that in wind farm areas both near-surface air humidity and surface sensible heat flux decrease. These changes can indirectly change meteorological elements, for example cloud cover and precipitation. The construction and operation of wind farms significantly reduces wind speed in the leeward direction which affects local air temperatures (both increasing and decreasing temperatures). These elements could have an impact on the growth state of local vegetation. In this article, remote sensing techniques are used to investigate the scope and impact intensity of the Huitengliang wind farm, Inner Mongolia, on local vegetation. This investigation will provide a reference for wind farm construction, conservation and restoration of vegetation and environmental improvement. Utilizing MOD13Q1-NDVI data in 2000-2014, vegetation change in a 50 km buffer area around the Huitengliang wind farm, Inner Mongolia, was analyzed. Combining meteorological data in this analysis, the impact of wind direction on vegetation growth was discussed. Compared with the construction phase (2000-2008), the operation phase (2008-2014) has a more obvious impact on the growth of vegetation. However, the results showed that vegetation impact was uneven: 1) The influencing mechanisms of a wind farm on vegetation differ within and outside of the farm area. Within the wind farm area, the wind farm is not conducive to vegetation growth, while it is helpful to vegetation growth in windward/leeward area; 2) Compared with the wind farm construction stage, the proportion of vegetation restoration in the buffer area and the farm area during the operational phase of the wind farm increased by 26.66% and 13.14%, respectively. The proportion of vegetation restoration in the windward and leeward areas, however, increased by 51.83% and 41.07%, respectively, over the same time period. This indicates that the proportion of vegetation restoration in the windward/leeward areas, especially in the windward area, is much higher than in the buffer or farm areas; 3) A zone 30-40 km from the center of the wind farm, on the windward side, is likely to be the area of greatest vegetation impact from the wind farm.
Keywords:
随着环境问题的加剧和资源的日益短缺,风能作为一项清洁能源,越来越受到各行业的重视,目前中国的能源政策也逐步向风能方向倾斜[1]。目前国内外很多学者开始思考风电开发过程对环境的负面作用,并试图衡量风电开发的利弊[2~5]。目前的研究多关注于风电场建设本身对风电场区域内植被、土壤、动物的扰动,或关注于风电场对周边地表温度、气候变化的可能影响[3, 5~7]。现有研究表明,风电场区域内近地表的空气湿度以及表面感热通量均会减小,对云和降水等其他气象要素也能起到间接改变作用。同时,风电场的建设运行导致下风向的风速明显减小,造成了下风向处的气温发生较明显的上升或下降变化[8],上述要素均会明显的改变植被生长状态。以内蒙古灰腾梁风电场为例,以遥感技术为主要手段,从区域尺度探讨风电场对植被生长影响的范围及强度,期待为风电场的建设、植被保护与恢复、生态环境改善等方面提供借鉴。
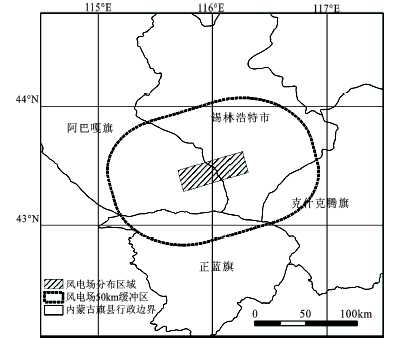
研究区位于内蒙古灰腾梁百万千瓦级风力发电基地,是亚洲最大的风电场, 2008年底形成现有规模[9]。研究区地处阴山山脉东段,位于锡林浩特市南部、锡林浩特市和阿巴嘎旗交界处(图1),北距锡林浩特市约55 km,东北部为锡林郭勒自然保护区,北部为火山喷发形成的平顶山地貌,南部为浑善达克沙地自然保护区[10],植被类型以大针茅(Stipa grandis)、克氏针茅(Stipa krylovii)、羊草(Leymus chinensis )和糙隐子草(Cleistogenes squarrosa)为优势种。用手持GPS-62SC实地调查风电场分布的外边界,该边界是狭长的条形区域。为便于分析,做外切矩形获得风电场分布的矩形区(以下简称“电场区”)。同时做该矩形的50 km缓冲区(以下简称“缓冲区”),选择50 km缓冲区作为研究区的理由如下:
1) 从已有研究看,风电场主要通过影响风速的形式对地表过程进行扰动,风电场影响风速衰减的距离为30~60 km[8]。
2) 若选择50 km以上区域将包含锡林浩特市区及浑善达克沙地的大片区域,土地利用类型及植被类型和50 km以内区域有很大差异,导致分析结果和50 km以内的相比较不具一致的代表性。
① 气象数据:2000~2014年内蒙古锡林浩特市气象站的风向、温度及降水数据来源于中国气象科学数据共享服务网(网址:http://new-cdc.cma.gov.cn);② 遥感数据:2000~2014年MOD13Q1-NDVI数据来源于美国国家航空航天局(网址:http://ladsweb.nascom.nasa.gov/data/search.html)③ 土地利用图:2000年土地利用图来源于中国西部环境与生态科学数据中心(网址:http://westdc.westgis.ac.cn),2005年、2010年的30 m土地利用图通过下载来自国际科学数据服务平台的Landsat5-TM数据由作者通过目视解译分类得到,经野外验证分类精度为88%(网址:http://datamirror.csdb.cn)[11]。
为避免下垫面差异对研究结果产生明显的影响,研究重点集中在土地利用类型中的“草地”类型。利用2000年、2005年和2010年的土地利用图,计算出3个时间段的高、中、低度覆盖草地的公共区域,将公共区域作为本研究的草地范围。
所使用的NDVI数据虽然采用了最大值合成方法(Maximum Value Composite,MVC)对数据进行了去噪和除云处理,但是MVC方法仍然无法保证每旬图像的所有像元在该旬内都是无云、无噪声的[12],因此需要对上述NDVI数据进行进一步处理。时间序列谐波分析法(Harmonic Analysis of Time Series,HANTS)结合了平滑和滤波2种方法,通过HANTS滤波最终实现图像的重构,进一步去除云量和噪声的影响[13]。另外,NDVI当年生长季和值相对于当年最大值来说更能代表植被当年生长状态[14],所以将HANTS滤波后,各年生长季4~9月的NDVI求和,代表当年的植被生长状况。
为监测植被各年的变化状况,本文通过线性趋势斜率(LTA)方法,分别计算各像元2000 ~2008年,2008 ~2014年的各指标的总体变化情况,如下式所示[15]。
式中,x是时间,y是变化指标(各年生长季4~9月NDVI的和,以下用NDVI_SUM表示),a是趋势斜率,b是截距。a通过最小二乘法计算得到,来表示各指标的变化趋势。
式中,N表示参与计算的年份数量,2000~2008年N=9,2008~2014年N=7,xi中的i=1时,则是研究时间段的第一年(分别指2000年、2008年),以此类推。yi是每个像元的当年生长季4~9月NDVI之和(NDVI_SUM)。当a<0时表示该像元所代表的植被生长状态处于下降的状态,反之,a>0则表示该像元所代表的植被生长状态处于上升的状态。
目前尚无对NDVI_SUM变化进行分级的统一标准,因此参考草地退化的国家标准[16],对NDVI_SUM变化等级进行划分,并对缓冲区、矩形风电场区、上风区域、下风区域的各等级所占草地面积的百分比进行统计,表1所示。
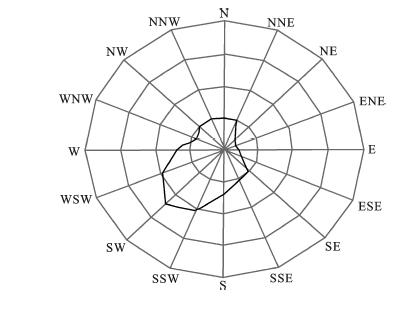
利用2000 ~2014年风向数据中以研究区矩形中心为圆心,分别向风向频率最高的WSW和SSW所夹方向(以下简称“上风区”)、风向频率最低的NNE和ENE所夹方向(以下简称“下风区”)分别做半径为30 km,40 km,50 km的扇形(图2),因0~30 km半径的扇形在风电场矩形区域内,以0~30 km作为风电场区对植被进行统一分析,最终分析上/下风向对植被影响的范围和强度。
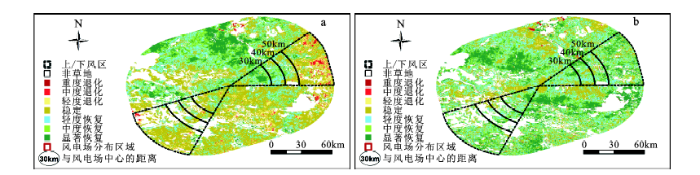
利用上述方法分别得到2000~2008年、2008~2014年研究区及上下风处植被生长变化的空间分布图(图3)。
图3 2000 ~2008年(a)和2008 ~2014年(b)植被变化趋势
Fig.3 The change tendency of vegetation in 2000-2008(a) and in 2008-2014(b)
为进一步定量分析图3中各区域内植被变化情况,计算并归纳得到表1。由表1可以看出,从退化比例上看,2000~2008年,风电场区域内植被退化比例最小,为3.27%。下风区域退化区域所占比例最大,为19.68%。上/下风区植被退化比例均高于风电场区域及风电场缓冲区,可见2000~2008年上/下风区植被相对于其它区域来说,退化是比较明显的。而2008~2014年,随着植被整体恢复,各区域内植被退化比例基本持平,均在0.97%~2.01%范围之间变化,可见2008 ~2014年上/下风区植被恢复加快。
从恢复比例上看,2000~2008年风电场区域植被恢复比例为49.98%,是上述4个区域恢复比例最高的。2008~2014年植被存在整体恢复现象,风电场区域的植被的恢复比例也上升到63.12%,但我们发现此时该数值已经变成上述4个区域内最低的,可见风电场的运行确实对植被生长产生了影响,减慢了植被的恢复趋势。值得注意的是相对于2000~2008年,2008~2014年缓冲区和风电场区域恢复比例分别上升了26.66%和13.14%,但上风区域却上升了51.83%,下风区域上升了41.07%。可见风电场上/下风区植被恢复比例,尤其是上风区的恢复比例要远高于其它区域。
为了进一步分析上/下风区,距离风电场中心不同范围内植被的变化情况,按照3.4的方法,得到表2。从上表可以看出,相对于2000 ~2008年,2008 ~2014年0~30 km、30~40 km、40~50 km上风区植被恢复的比例均显著高于下风区。值得注意的是:① 0~30 km的扇形区在风电场区域内,风电场建设过程中对植被的干扰应是相似的。通过笔者实地调查,0~30 km之内上/下风区同时存在相似的放牧情形,可见食草动物对上述区域的干扰也是相似的,但下风区植被的恢复面积却是上风区恢复面积的近4倍,所以与下风区相比,风电场对上风区的植被产生更为显著的影响;②30~40 km范围内,上风区植被恢复面积是下风区植被恢复面积的20余倍,40~50 km,50 km以上这种比例开始下降。所以距离风电场中心30~40 km的上风区很可能是本研究区受风电场影响最为明显的区域,这与目前微观尺度的生态学调查结论是有差异的[4]。
综合表1和表2进行分析。总的来说,同风电场建成前相比,风电场建成后的2008~2014年缓冲区、风电场区、上/下风区的植被是处于恢复状态的,与缓冲区相比,风电场区植被恢复比例减少,而风电场上/下风区植被会加速恢复,尤其是上风区。
表1 NDVI_SUM变化等级的划分
Table 1 Grading of NDVI_SUM change
| 级别 | NDVI_SUM范围 (上升/下降) | 2000~2008年 所占草地面积百分比%(A) 缓冲区内/风电场区域内/ 下风区/上风区 | 2008~2014年 所占草地面积百分比%(B) 缓冲区内/风电场区域内/ 下风区/上风区 | B-A 缓冲区内/风电场区域内/ 下风区/上风区 |
|---|---|---|---|---|
| 重度退化 | >30%(下降) | 0.31/0.03/0.80/0.20 | 0.35/0.07/0.10/0.26 | 0.04/0.04/-0.70/0.06 |
| 中度退化 | 21%~30%(下降) | 1.48/0.20/4.72/1.46 | 0.38/0.12/0.20/0.40 | -1.10/-0.08/-4.52/-1.06 |
| 轻度退化 | 11%~20%(下降) | 6.72/3.04/14.15/8.11 | 1.28/1.20/0.67/1.31 | -5.44/-1.84/-13.48/-6.80 |
| 退化总计 | - | 8.51/3.27/19.68/9.77 | 2.01/1.39/0.97/1.98 | -6.50/-1.88/-18.71/-7.79 |
| 稳定 | 10%(下降)~10%(上升) | 46.11/46.75/44.66/67.09 | 25.95/35.49/22.28/23.05 | -20.16/-11.26/-22.38/-44.04 |
| 轻度恢复 | 11%~20%(上升) | 21.42/27.14/18.96/17.15 | 29.25/33.02/33.58/32.17 | 7.83/5.88/14.62/15.02 |
| 中度恢复 | 21%~30%(上升) | 13.74/14.44/10.86/4.42 | 22.30/20.30/25.05/25.71 | 8.56/5.86/14.19/21.29 |
| 显著恢复 | >30%(上升) | 10.18/8.40/5.85/1.57 | 20.45/9.80/18.11/17.09 | 10.27/1.40/12.26/15.52 |
| 恢复总计 | - | 45.34/49.98/35.67/23.14 | 72.00/63.12/76.74/74.97 | 26.66/13.14/41.07/51.83 |
表2 上/下风区不同距离下植被生长情况
Table 2 Vegetation changes upwind and downwind area in different distances
| 下风区 | 上风区 | ||||||
|---|---|---|---|---|---|---|---|
| 年份 | 2000~2008年 | 2008~2014年 | - | 2000~2008年 | 2008~2014年 | - | |
| 类型 距离 | 退化/稳定/变好 A | 退化/稳定/变好 B | 退化/稳定/变好 B-A | 退化/稳定/变好 A | 退化/稳定/变好 B | 退化/稳定/变好 B-A | |
| 0~30 km | 2.06/36.59/61.35 | 0.24/27.40/72.37 | -1.82/-9.19/11.01 | 6.19/64.48/29.33 | 1.27/27.84/70.89 | -4.92/-36.64/41.56 | |
| 30~40 km | 0.13/27.08/72.79 | 0.44/24.90/74.66 | 0.31/-2.18/1.87 | 5.96/64.41/29.63 | 1.63/27.66/70.71 | -4.33/-36.75/41.08 | |
| 40~50 km | 3.88/48.39/47.73 | 1.37/24.68/73.95 | -2.51/-23.71/26.22 | 2.38/64.31/33.31 | 1.99/24.16/73.85 | -0.39/-40.15/40.54 | |
| 50 km以上 | 34.01/54.23/11.77 | 1.22/20.65/78.14 | -32.79/-33.58/66.37 | 13.38/68.83/17.78 | 2.16/20.47/77.36 | -11.22/-48.36/59.58 | |
从上述的分析可知,灰腾梁风电场运行对矩形电场区及50 km缓冲区内植被的生长产生了明显的影响,但影响范围和强度是不均匀的,主要表现在:① 相对于风电场建成前的2000~2008年,风电场建成后的2008~2014年缓冲区和风电场区域植被恢复比例分别上升了26.66%和13.14%,但上风区域却上升了51.83%,下风区域上升了41.07%。可见风电场上/下风区植被恢复比例,尤其是下风区的恢复比例要远高于其它区域,可见风电场运行的上/下风处更有利于植被的恢复;②风电场运行对风电场区域内/外植被的影响机制是不同的,电场运行后研究区植被是以恢复趋势为主,而风电场区域内植被恢复趋势减慢,而上/下风区域植被恢复趋势加快;③ 距离风电场中心30~40 km的上风区很可能是受风电场影响最为明显的区域,由于与目前微观尺度的生态学调查结论存在差异,这一结论还需要进一步分析确定。
下面几个因素会使本文的研究结果产生不确定性:① 缓冲区范围不同会对植被生长比例产生影响;② 风电场规模不同,对下垫面植被的影响强度和范围是不同的;③ 从区域尺度对地表真实放牧强度的衡量是一个复杂的过程,但真实放牧强度在研究区内是否严格一致,还需进一步分析。另外,本文结论的推广还需慎重,这和当地的植被及气候特点可能有很大的关系。温度和降水是决定植被生长的两个重要因素,笔者研究发现2000~2014年研究区年平均温度和年降水总量均是呈上升趋势的,该区域植被生长又是和温度及降水正相关的区域[11]。风电场对区域降水量的影响是有限的[17],那么上/下风区植被的恢复很可能是温度上升加快引起的,在降水不足或下降区域,建设大规模的风力发电场,很可能形成或加快该区域气候性干旱。上述因素对植被生长过程影响是复杂的,本文没有逐个分析和实地验证各影响因素的变化情况,作者将在以后的工作中继续上述几方面的研究。
随着环境问题的加剧和资源的日益短缺,风能作为一项清洁能源,越来越受到各行业的重视,目前中国的能源政策也逐步向风能方向倾斜。风能带来积极的环境效应的同时,我们需要认真思考风电开发过程中对环境的负面作用,风电场对环境的影响是一个长期渐变的过程,这是一个不能忽视、但却难以衡量的过程。风电场到底对环境产生何种影响,利弊如何,急需进行深入系统的研究。
The authors have declared that no competing interests exist.
| [1] |
Nielsen C P et al. Potential for wind-generated electricity in China [J]. |
| [2] |
风电场对气候变化影响研究进展 [J].
综述了国际评估风电场对局地和全球气候变化的短期和较长期的可能影响,并且将其影响与人类排放的影响作简单的对比。大量的观测和数值模拟研究表明,风电场的运行明显减小下游风速,同时随局地近地层稳定度的不同也造成下游温度明显上升或下降。一些数值模拟研究表明,如果全球建立大量大型风电场,例如假定全球使用风能占总能源10%以上,即全球陆地的30%~40%和全球海洋浅水区均建有风电场,这些风电场的运行将可能造成全球变暖和风速减小。目前风电场对全球气候的影响尚具有很大的不确定性。
Advances in assessment on impacts of wind farms upon climate change.
综述了国际评估风电场对局地和全球气候变化的短期和较长期的可能影响,并且将其影响与人类排放的影响作简单的对比。大量的观测和数值模拟研究表明,风电场的运行明显减小下游风速,同时随局地近地层稳定度的不同也造成下游温度明显上升或下降。一些数值模拟研究表明,如果全球建立大量大型风电场,例如假定全球使用风能占总能源10%以上,即全球陆地的30%~40%和全球海洋浅水区均建有风电场,这些风电场的运行将可能造成全球变暖和风速减小。目前风电场对全球气候的影响尚具有很大的不确定性。
|
| [3] |
A quantitative-based evaluation of the environmental impact and sustainability of a proposed onshore wind farm in the United Kingdom [J].https://doi.org/10.1016/j.rser.2015.04.179 URL [本文引用: 1] 摘要
In this paper, a quantitative-based evaluation of the environmental impact of a proposed wind farm is presented using the Rapid Impact Assessment Matrix (RIAM). The paper uses the revised Environmental Statement of the Grove Farm Wind Energy Project, which was rejected during the planning decision consent stage initially and upheld on appeal. The paper evaluates quantitatively the potential impact of an onshore wind farm at the construction and operation stages. Based on the RIAM evaluation conducted, the paper then goes on to apply a mathematical model to the results to determine the indicated potential level and nature of sustainability of the proposed wind farm. The results indicate that the Grove Farm project was deemed, as a whole, detrimental to the environment鈥揾uman system, particularly in respect to impacts to visual amenity and cultural heritage. The application of the model to the RIAM indicated that in both the construction and operation stages, the project was considered as unsustainable. The results obtained raised legitimate questions as to the benefits of such projects as a major contributor to the UK壮s renewable and sustainable energy mix.
|
| [4] |
风电场建设对周边扰动区域土壤养分和植被的影响 [J].
研究了风电场的建设对周边扰动区域土壤养分和植被的影响。结果表明:风电场的建设增加了扰动区域土壤容重、pH和总孔隙度,降低了土壤电导率、含水量和全盐,同时也降低了植被生长各指标和土壤养分(除了土壤全磷)等;在扰动区域(0~3km),植被生长各指标和土壤养分均随远离风电场距离的增加而增加,距离风电场4km时,植被生长各指标和土壤养分基本与未扰动区域达到一致,初步表明了风电场对于植被和土壤养分的影响范围均在方圆3km以内;风电场扰动区域土壤微生物量的变化幅度和变异系数最大,说明风电场对土壤微生物量的空间变异影响较大;风电场扰动区域和非扰动区域土壤养分均随土层深度的增加而逐渐降低趋势,表现出明显的"表聚性",而土壤深层(40—60cm)未扰动区和扰动区土壤养分基本一致,表明了风电场的建设并没有改变土壤养分的垂直分布特征,也并未影响深层土壤养分含量;风电场未扰动区域植被与土壤因子相关性基本与扰动区域相一致,表明风电场对周边区域植被和土壤均有影响,而此影响具有同等的重要性,也即同等程度下影响了植被和土壤因子,同时也体现了植被和土壤因子的互作效应。
Effect of wind power site construction on soil nutrients and vegetation of the surrounding disturbed region.
研究了风电场的建设对周边扰动区域土壤养分和植被的影响。结果表明:风电场的建设增加了扰动区域土壤容重、pH和总孔隙度,降低了土壤电导率、含水量和全盐,同时也降低了植被生长各指标和土壤养分(除了土壤全磷)等;在扰动区域(0~3km),植被生长各指标和土壤养分均随远离风电场距离的增加而增加,距离风电场4km时,植被生长各指标和土壤养分基本与未扰动区域达到一致,初步表明了风电场对于植被和土壤养分的影响范围均在方圆3km以内;风电场扰动区域土壤微生物量的变化幅度和变异系数最大,说明风电场对土壤微生物量的空间变异影响较大;风电场扰动区域和非扰动区域土壤养分均随土层深度的增加而逐渐降低趋势,表现出明显的"表聚性",而土壤深层(40—60cm)未扰动区和扰动区土壤养分基本一致,表明了风电场的建设并没有改变土壤养分的垂直分布特征,也并未影响深层土壤养分含量;风电场未扰动区域植被与土壤因子相关性基本与扰动区域相一致,表明风电场对周边区域植被和土壤均有影响,而此影响具有同等的重要性,也即同等程度下影响了植被和土壤因子,同时也体现了植被和土壤因子的互作效应。
|
| [5] |
Roy S B et al. Impacts of wind farms on land surface temperature [J].https://doi.org/10.1038/NCLIMATE1505 Magsci [本文引用: 2] 摘要
The wind industry in the United States has experienced a remarkably rapid expansion of capacity in recent years and this fast growth is expected to continue in the future(1-3). While converting wind's kinetic energy into electricity, wind turbines modify surface-atmosphere exchanges and the transfer of energy, momentum, mass and moisture within the atmosphere(4-6). These changes, if spatially large enough, may have noticeable impacts on local to regional weather and climate. Here we present observational evidence for such impacts based on analyses of satellite data for the period of 2003-2011 over a region in west-central Texas, where four of the world's largest wind farms are located(7). Our results show a significant warming trend of up to 0.72 degrees C per decade, particularly at night-time, over wind farms relative to nearby non-wind-farm regions. We attribute this warming primarily to wind farms as its spatial pattern and magnitude couples very well with the geographic distribution of wind turbines.
|
| [6] |
Potential climatic impacts and reliability of very large-scale wind farms [J].https://doi.org/10.5194/acp-10-2053-2010 URL 摘要
Meeting future world energy needs while addressing climate change requires large-scale deployment of low or zero greenhouse gas (GHG) emission technologies such as wind energy. The widespread availability of wind power has fueled legitimate interest in this renewable energy source as one of the needed technologies. For very large-scale utilization of this resource, there are however potential e...
|
| [7] |
Further evidence of impacts of large-scale wind farms on land surface temperature [J].https://doi.org/10.1016/j.rser.2012.07.004 URL [本文引用: 1] 摘要
Large wind farms are power plants that generate clean energy from a renewable source. They are increasingly being installed and operated to replace and complement fossil fuel power plants in an effort to help reduce greenhouse and other pollutant emissions (American Wind Energy Association, 2012 [1]; American Wind Energy Association, 2011 [2]; Global Wind Energy Council, 2011 [3]; US Department of Energy, 2008 [4]; Wiser et al., 2007 [5]). Wind energy can have a positive economic impact and numerous locations on the planet are good candidates for wind energy production. Any direct environmental impact of large-scale wind farms needs to be investigated because it could impact agriculture, economics, health, society, and technology. A recent study showed that surface temperature is observed to increase directly downwind of large wind farms [6]. This research, performed concurrently, shows that similar and complementary results are obtained for a different location, and using remotely sensed temperature data obtained from a different satellite, at higher resolution and for a longer time span. Satellite remote sensing observations from Landsat 5 Thematic Mapper are used to study temperature changes over the San Gorgonio Pass Wind Farm from 1984 to 2011, with a pixel resolution of 120m. A warming trend is consistently observed downwind of the wind farm.
|
| [8] |
Barthelmie R A et al. The making of a second-generation wind farm efficiency model complex [J]. |
| [9] |
- |
| [10] |
风电场建设对生态环境影响的研究——以锡林郭勒盟灰腾梁风电场为例[D] .Study on the influence of the construction of wind power plants on the ecological environment-Taking Huitengliang Wind Farm as an Example Hohhot: |
| [11] |
内蒙古典型草原碳储量动态变化研究[D] . |
| [12] |
Huang Chunlin et al. A simplified data assimilation method for reconstructing time-series MODIS NDVI data [J].https://doi.org/10.1016/j.asr.2009.05.009 Magsci [本文引用: 1] 摘要
<h2 class="secHeading" id="section_abstract">Abstract</h2><p id="">The Normalized Difference Vegetation Index (NDVI) is an important vegetation index, widely applied in research on global environmental and climatic change. However, noise induced by cloud contamination and atmospheric variability impedes the analysis and application of NDVI data. In this work, a simplified data assimilation method is proposed to reconstruct high-quality time-series MODIS NDVI data. We extracted 16-Day L3 Global 1 km SIN Grid NDVI data sets for western China from MODIS vegetation index (VI) products (MOD13A2) for the period 2003–2006. NDVI data in the first three years (2003–2005) were used to generate the background field of NDVI based on a simple three-point smoothing technique, which captures annual features of vegetation change. NDVI data for 2006 were used to test our method. For every time step, the quality assurance (QA) flags of the MODIS VI products were adopted to empirically determine the weight between the background field and NDVI observations. Ultimately, more reliable NDVI data can be produced. The results indicate that the newly developed method is robust and effective in reconstructing high-quality MODIS NDVI time-series.</p>
|
| [13] |
Reconstruction of global MODIS NDVI time series: Performance of harmonic analysis of time series (HANTS) [J].https://doi.org/10.1016/j.rse.2015.03.018 URL [本文引用: 1] 摘要
The harmonic analysis of time series (HANTS) algorithm has been widely used to reconstruct time series of normalized difference vegetation index (NDVI), Leaf area index (LAI), and land surface temperature (LST) as well as the polarization difference brightness temperature (PDBT) during the past 20 years to remove random noise or eliminate cloud/snow contamination. So far no systematic study on the accuracy of such reconstruction has been done. This study aims at taking the global MODIS vegetation index as an example to develop a generic method to evaluate the reconstruction performance of HANTS. The overall reconstruction error was divided into gap related error and fitting-method related error. Firstly, ten annual NDVI time series for a pixel were used to extract reference series and gap statistics. Then the gap and fitting-method related errors were quantified independently. The results suggest that the gap related error for most of the high latitude forest area (between 50 degrees N and 70 degrees N) was rather large (the mean root mean squared deviation (RMSD) reached to 0.15), which may be attributed to the fact that large gaps appear in the NDVI profiles between snow melting and vegetation regreening season. The gap related error was found negligible for the other areas of the globe except the North China Plain, the North India and several mountainous areas where the mean RMSD is around 0.1. The inadequate capability of low frequency harmonics to capture the rapid transition during snowmelt in spring at the high latitude region of the North Hemisphere makes the fitting-method related error in this region rather large (RMSD can reach 0.1). The method developed in this study was applied to map globally the spatial pattern of HANTS performance in the reconstruction of NDVI time series and it can also be applied to evaluate the reconstruction performance of time series of other land surface variables or the performance of other time series reconstruction algorithms. (C) 2015 Elsevier Inc. All rights reserved.
|
| [14] |
Mysterud A et al. Using the satellite-derived NDVI to assess ecological responses to environmental change [J].https://doi.org/10.1016/j.tree.2005.05.011 URL PMID: 16701427 [本文引用: 1] 摘要
Assessing how environmental changes affect the distribution and dynamics of vegetation and animal populations is becoming increasingly important for terrestrial ecologists to enable better predictions of the effects of global warming, biodiversity reduction or habitat degradation. The ability to predict ecological responses has often been hampered by our rather limited understanding of trophic interactions. Indeed, it has proven difficult to discern direct and indirect effects of environmental change on animal populations owing to limited information about vegetation at large temporal and spatial scales. The rapidly increasing use of the Normalized Difference Vegetation Index (NDVI) in ecological studies has recently changed this situation. Here, we review the use of the NDVI in recent ecological studies and outline its possible key role in future research of environmental change in an ecosystem context.
|
| [15] |
Wang Hong et al. Influence of meadow changes on net primary productivity: a case study in a typical steppe area of XilinGol of Inner Mongolia in China [J].https://doi.org/10.1007/s12303-014-0057-z URL [本文引用: 1] 摘要
In this research, we monitored the change (degeneration or improvement) in meadow vegetation over an approximately 12-year timespan in the typical steppe area of Inner Mongolia in China. Linear trend analysis (LTA) and the MOD13Q1-NDVI time series data were used to evaluate the changes in the net primary productivity (NPP) during the vegetation growing seasons between 2000 and 2011. The Carnegie Ames Stanford Approach (CASA) model was used, and the relationship between the vegetation change and meadow NPP was analyzed and validated with field data collected in 2011. The results indicate the following: (1) the growth status and NPP of the meadow vegetation in the typical steppe area of Inner Mongolia varied greatly for each year without an obvious linear trend between the change of meadow vegetation and NPP; (2) additional analysis with field measured data, collected in 2011, revealed that the average dry weight of the above-ground biomass in the area where the NPP had increased was less than that in the area where it had decreased; the dry weight of the above-ground biomass of the meadow vegetation that showed degeneration was greater than that of the meadow vegetation that showed improvement; (3) a possible reason for the phenomenon mentioned in (2) was that the government protected the degenerated meadows with less biomass, which led to vegetation growth and increased NPP, whereas the meadows that had not been degenerated or showed only minor degeneration and still received rich biomass were over-grazed, causing the NPP to decline.
|
| [16] |
天然草地退化、沙化、盐渍化的分级指标 [S]. |
| [17] |
Wind energy development and its environmental impact: A review [J]. |

/
| 〈 |
|
〉 |