王美雅 , 徐涵秋, 付伟
Wang Meiya, Xu Hanqiu, Fu Wei
中图分类号: TP79/X87
文献标识码: A
文章编号: 1000-0690(2016)07-1099-07
通讯作者:
收稿日期: 2015-11-4
修回日期: 2016-01-8
网络出版日期: 2016-07-20
版权声明: 2016 《地理科学》编辑部 本文是开放获取期刊文献,在以下情况下可以自由使用:学术研究、学术交流、科研教学等,但不允许用于商业目的.
基金资助:
作者简介:
作者简介:王美雅(1991-),女,福建泉州人,博士研究生,主要从事环境与资源遥感研究。E-mail:286097145@qq.com
展开
摘要
以福州市建成区为例,基于Landsat遥感影像对水体类型进行分类,并提取出1989、1996、2006和2014年的地表水体信息,然后与不透水面、植被和地表温度信息结合,运用回归模型定量分析了1989~2014年间福州城市地表水体的时空变化及其对城市热环境的影响。结果表明:① 1989~2014年间,福州建成区各类地表水体均呈不断减少趋势,25 a间水体总面积减少了1 490.67 hm2,其中有70.0%转变成不透水面;② 1989~2014年减少的1 490.67 hm2水体对福州建成区温度上升的贡献达1.03℃,而在水体减少的具体区域,其升温效应可达3.6℃。
关键词:
Abstract
Shrinkage of urban surface water bodies has caused a series of problems, such as degeneration of urban ecological quality and the intensification of urban heat island phenomenon, which severely affect human living quality. Fuzhou City, as the capital city of Fujian Province in southeastern China, has witnessed a rapid urban expansion process during the last three decades. The rapid urban growth of Fuzhou City has led to the shrinkage of urban surface water bodies and induced a series of urban environmental problems. To reveal the relationship between the change of surface water area and urban heat environment, remote sensing technique was employed using multi-temporal Landsat TM/OLI/TIRS images of 1989, 1996, 2006 and 2014. The use of the modified normalized different water index (MNDWI) has successfully extracted the information of the city’s surface water bodies from the images. The selected thresholds for the extraction of water bodies of the four study years (1989, 1996, 2006, 2014) were 0.1, 0.1, -0.05 and -0.05, respectively. Because the water area of both Min River and Wulong River, which flow through the study area, were basically unchanged in the four-study years, they were masked out in this study. The assessment of the accuracy shows that the overall accuracies of the water extraction of the four years are all greater than 90.0%, which met accuracy requirements. The extracted urban surface water bodies were classified into three types: river, lake and pond by using shape index. Furthermore, the impervious surfaces and vegetation were extracted by two remote sensing indices, i.e., normalized difference impervious surface index (NDISI), and normalized difference vegetation index (NDVI), respectively. While, the land surface temperature (LST) was retrieved using the single channel algorithm (SC). Combined with LST, impervious surfaces, and vegetation information, the extracted water images were used to analyze the spatiotemporal variation of Fuzhou’s surface water in 1989-2014. Regression analysis was carried out to investigate the quantitative relationship between water and LST. The result shows that all three types of surface waters in Fuzhou urban built-up area have decreased substantially in 1989-2014. Water area decreased by 1 490.67 hm2 in 25 years and 70% of the decreased waters converted into impervious surfaces. Of the reduced water, river area decreased by 1 490.67 hm2, pond area decreased by 951.21 hm2, and lake area decreased by 408.15 hm2 during the period. The calculation shows that difference in LST between water and impervious surface is 11.12℃, while the difference between water and vegetation was 4.38℃. A significant negative correlation between the proportion of urban surface water and LST has been detected. According to the regression model, the decrease of surface waters in Fuzhou built-up area in 1989-2014 has contributed to the temperature rise by 1.03℃. However, in the local area where water area has reduced substantially, the warming effect is more obvious. Taking Puxia wetland as an example, the decrease of the surface water area of the wetland in 1989-2014 has contributed to the temperature rise by 3.6℃. Obviously, the reduction of urban surface waters has significantly intensified the urban heat island phenomenon of the city.
Keywords:
城市中的内河、湖泊和池塘构成了城市的主要地表水体,它们是城市生态系统中的重要组成部分,它们同时也是受人类活动与自然过程交互影响最为强烈的地带[1~3]。改革开放以来的快速城市化,已导致大量的城市地表水体在城市扩展中消失,从而对城市的生态环境造成了明显的影响[4,5]。
当前,遥感空间信息技术以其宏观、实时、快速等优势在各种水体的研究中得到广泛应用[6~14]。
福州市作为福建省的省会城市,自改革开放以来经历了大规模的城市扩展[15],在城市地表水体急剧减少,并诱发了一系列城市问题,如严重的城市热岛效应。福州也因此多次被评为中国新三大火炉之首和最热省会城市。为了定量查明福州城市水体减少对城市热环境的影响,本文利用遥感和GIS技术对福州1989~2014年各类地表水体的时空变化及其温度效应进行系统分析,这一研究将为福州城市热岛效应的治理和宜居城市的建设提供科学的决策依据。
福州位于中国东部沿海,与台湾省隔海相望,地理位置为25°15′~26°39′N,118°08′~120°31′E。福州为典型的亚热带季风气候,年平均降水量为900~2 100 mm;年平均气温为16~20℃。福州境内最大的河流为闽江和乌龙江,除此之外,还有大量的城市内河、湖泊和坑塘,它们构成了纵横交错的城市地表水体系。由于本文主要研究的是城市建成区中的地表水体变化,因此,以最新的2014年福州城市建成区为研究范围,总面积为215.97 km2(图1d)。
考虑到遥感卫星数据源的一致性,本文从美国USGS网站下载1989年6月15日、1996年9月6日、2006年9月18日和2014年9月8日的Landsat影像,其中,除了2014年的为Landsat 8影像外,其余的均为Landsat 5影像。其它辅助数据有2014年福州建成区边界矢量图。
以1989年影像为基准,采用二次多项式和最邻近像元法对1996、2006和2014年的影像进行几何校正,RMSE误差控制在0.5个像元以内。采用Chander和Chavez的模型和参数以及Landsat 8网站提供的公式和参数对Landsat 5和Landsat 8影像进行辐射校正,将影像的DN值转换为传感器处反射率[16~18]。
1) 水体信息提取。本文水体信息提取采用的是徐涵秋提出的归一化差异水体指数(MNDWI,文中值为MMNDWI)[19],其表达式为:
MMNDWI=(GGreen-MMIR)/(GGreen+MMIR) (1)
式中,GGreen、MMIR分别代表影像的绿光和中红外1波段的反射率。
在MNDWI增强的4个年份的水体影像上,通过目视判别和人工调试设定最佳阈值将水体信息提取出来(图1)。4个研究年份(1989、1996、2006、2014年)选用的阈值分别为:0.1、0.1、-0.05和-0.05。由于本文主要研究的是福州建成区地表水体的时空变化,而流经城区的闽江和乌龙江在这4个年份间的水体形态和面积基本不变,因此,本次研究将其掩膜掉,以突出其它城市地表水体的变化信息。
图1 研究区各年份的标准假彩色(RGB:近红、红、绿波段)遥感影像(a~d)及其对应的水体提取影像(e~h)
Fig.1 Remote sensing images (RGB: NIR, Red, Green) (a-d) and the extracted water images (e-h) in Fuzhou of the four years
对所提取的各年份水体信息分别与同期的Google Earth高分辨率影像进行对比,采用随机抽样的方法在每幅水体影像中取点,然后进行人机交互验证(由于1989年的影像没有同期的Google Earth高分辨率影像,所以只能将提取结果与原影像进行对比)。验证结果表明,4个年份的水体提取总精度都超过90.0%,满足精度要求。
2) 水体分类。为了进一步分析研究区内不同水体类型的变化,根据国家2007年颁布的《土地利用现状分类》中的二级分类体系和研究区的水体特征,进一步将所提取的水体信息分成河流、湖泊、坑塘三大类。由于这3类水体的光谱特征差异较小,因此,本文主要利用面积、周长、形状等几何形态特征来区分它们[20]。湖泊和面状河流的周长较长、面积较大,而坑塘的周长较短,面积也较小。此外,湖泊、坑塘及大的河流呈面状,而小的河流为线状。对面状水体而言,不同类型的水体其形状又各不一致:湖泊的边界一般较平坦光滑,河流呈弯曲的长条状,池塘形状较圆滑,近似椭圆,而鱼塘则呈规则的四边形。
借助ArcGIS软件,将4个年份提取的水体栅格数据转换为矢量多边形数据,计算出每个多边形的面积、周长及形状指数,并将计算结果与目视判读相结合来对提取的水体进行分类,选用的形状指数公式为[21]:
K=A1/2 / P (2)
式中,K为形状指数,A为面积,P为周长。圆的形状指数最大 (K>0.25),正方形次之 (K=0.25)。一般情形下,形状越不规则,其形状指数越小。因此,河流的形状指数较湖泊、池塘要小。本文先根据目视判读选择阈值,取K≤0.08为河流,K≥0.08为湖泊和坑塘,湖泊和坑塘进一步依据面积来区分,面积大于等于7.5 hm2为湖泊,小于7.5 hm2为坑塘。然后通过目视进一步修改误判的水体类型。
3) 其他相关地表覆盖物信息提取。为了揭示城市地表水体变化对城市热环境的影响,除了水体信息外,本文还需要反演出最新的2014年研究区的地表温度(LST,文中值为LLST)、不透水面(ISA)和植被信息。不透水面信息提取采用的是归一化不透水面指数(NDISI,文中值为NNDISI)[22],植被信息提取选用归一化植被指数(NDVI文中值为NNDVI),地表温度反演选用的是Jiménez-Muñoz等提出的单通道算法(SC)[23~25]。限于篇幅,本文只列出这些算法的主要公式,反演的结果如图2所示。
不透水面:
植被: NNDVI=(NNIR-RRed)/(NNIR+RRed) (4)
地表温度:
式中,RRed、NNIR、MMIR和TTIR分别表示影像的红光、近红外、中红外1波段和热红外波段的反射率,LLST是地表温度,γ和δ是基于Planck函数的2个参数,Lsensor为热红外波段的辐射值,ε为地表比辐射率,ψ1、ψ2、ψ3是大气水汽含量w的函数。
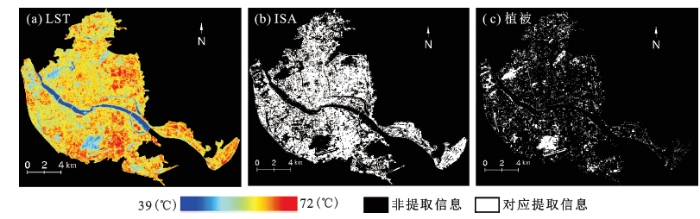
图2 2014年的地表温度(a.LST)、不透水面(b.ISA)和植被影像(c)
Fig.2 Land surface temperature (a.LST) , impervious surface(b.ISA), and vegetation images(c) in 2014
采用与水体信息验证一样的方法对不透水面和植被信息进行精度验证,其提取总精度分别为86.47%和95.14%,满足精度要求。对反演的地表温度则采用福州乌山国家基准气候站实测地表温度来验证,误差为0.80℃。
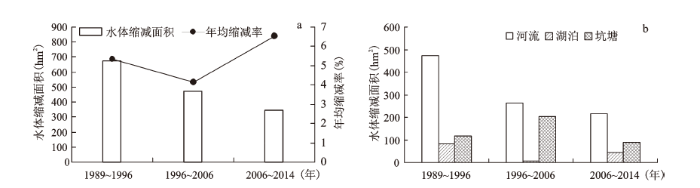
分别对1989、1996、2006和2014年福州市建成区的水体面积进行统计,计算其1989~2014年的水体面积变化和变化速率。结果表明(表1,图3a),1989~2014年福州城市地表水体发生了很大变化,水体面积呈大幅下降趋势,从1989年的1 806.57 hm2减少到2014年的315.90 hm2,共减少1 490.67 hm2,年均减少3.30%。其中,1989~1996年减少673.74 hm2,1996~2006年减少470.97 hm2,2006~2014年减少345.96 hm2,3个时段的年均减少速率分别为5.33%,4.16%和6.53%,表明2006~2014年的减少速率最大。
分别统计4个年份福州建成区中的河流、湖泊和坑塘的面积发现(表1,图3b),1989~2014年间,河流面积减少了951.21 hm2,坑塘减少408.15 hm2,湖泊减少131.31 hm2;分别占减少水体的63.81%,27.38%和8.81%。1989~2014年间,随着主城区的不断扩展,福州河流减少的面积最多,许多细小河汊相继消失。到了2014年,福州市建成区仅剩下若干主干河流。湖泊的变化主要分布在鼓楼区和台江区。城市中心的小湖泊纷纷被填埋造地。到了2014年,建成区内存留的湖泊仅为一些园林水体域,如西湖、左海和观音湖等。坑塘的面积也大幅缩减,原有建成区内的大量坑塘因被改造成建筑用地而相继消失。到2014年,坑塘只能见诸于城郊结合部,而城区中心已很少见。
表1 各年份水体变化信息
Table 1 Change information of different water types in different years
| 水体 类型 | 1989年 (hm2) | 1996年 (hm2) | 2006年 (hm2) | 2014年 (hm2) | 1989~1996年 | 1996~2006年 | 2006~2014年 | 1989~2014年 | ||||
|---|---|---|---|---|---|---|---|---|---|---|---|---|
| 变化 (hm2) | 变化速率(%) | 变化 (hm2) | 变化速率(%) | 变化 (hm2) | 变化速率(%) | 变化 (hm2) | 变化速率(%) | |||||
| 河流 | 1206.00 | 733.59 | 469.44 | 254.79 | -472.41 | -70.12 | -264.15 | -56.09 | -214.65 | -62.04 | -951.21 | -63.81 |
| 湖泊 | 158.22 | 75.60 | 70.65 | 26.91 | -82.62 | -12.26 | -4.95 | -1.05 | -43.74 | -12.64 | -131.31 | -8.81 |
| 坑塘 | 442.35 | 323.64 | 121.77 | 34.20 | -118.71 | -17.62 | -201.87 | -42.86 | -87.57 | -25.31 | -408.15 | -27.38 |
| 总水体 | 1806.57 | 1132.83 | 661.86 | 315.90 | -673.74 | -5.33 | -470.97 | -4.16 | -345.96 | -6.53 | -1490.67 | -3.30 |
图3 不同时段(a)、不同类型(b)的水体变化
Fig.3 Water changes in different periods (a) and types (b)
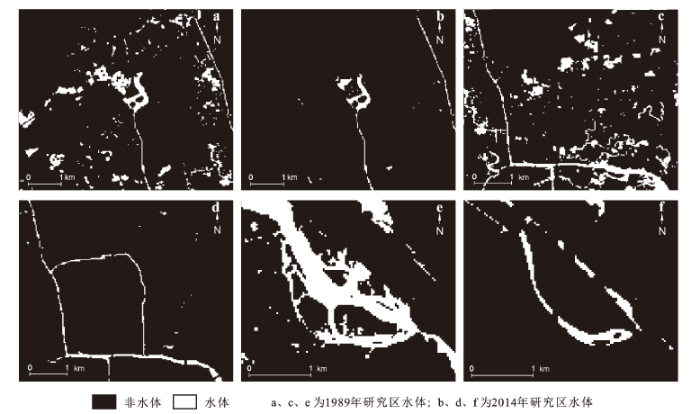
图4列出了福州建成区内3个典型的水体变化区。图4a显示了1989年鼓楼区内湖塘众多,但到了2014年(图4b),区内的湖塘除西湖以外,已基本消失殆尽;图4c同样显示了晋安区在1989年有大量的湖塘,但到2014年(图4d),它们也基本消失;图4e显示了仓山浦下洲在1989年河网遍布,到了2014年(图4f),这些河网已不复存在。
为了分析水体的减少对城市热环境的影响,本文将1989和2014年的水体专题图叠加,得到水体变化区域。然后将水体减少的区域分别与2014年的不透水面和植被专题图叠加,找出水体向两者转换的图斑。结果表明,从1989~2014年共有1 043.80 hm2的水体转化成不透水面,占2014年建成区的4.83%;有269.15 hm2的水体转化成植被,占2014年建成区的1.25%。进一步统计出2014年三大地类的平均地表温度:水体为48.86℃,不透水面为59.98℃,植被为53.24℃。由于水体与不透水面的温差达到了11.12℃,与植被的温差达4.38℃,因此当有1 043.80 hm2的水体转换成不透水面,269.15 hm2的水体转换成植被时,无疑会导致这些区域的温度大幅上升,从而加剧福州的城市热岛效应。
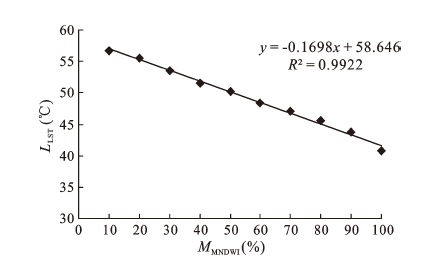
本文进一步采用回归分析来定量刻画水体消减造成的升温效应。首先将2014年研究区水体的MNDWI影像归一化到0~1之间,并转换成百分率,使其数值分布在0~100之间[26],然后将其等分为10等级,统计出对应等级的地表温度LST均值,获得10组样本数据,并对其进行线性回归分析,得到以下回归关系模型(图5)。
LLST=-0.169 8 MMNDWI + 58.646 (r2=0.992 2) (6)
回归分析表明,水体比例和地表温度呈显著的线性负相关关系。水体比例每增加10%,地表温度会减少1.70℃。表1表明,1989~2014年研究区城市地表水体面积共减少了1 490.67 hm2,占福州城市建成区的比例为6.08%。因此,如果将该比例代入以上回归模型,即可计算出水体比例变化前后的温差:
ΔLLST = | (-0.169 8×100+58.646)-[-0.169 8×
(100-6.08)+58.646] | = 1.03℃ (7)
据此推算,福州建成区1989~2014年所减少的水体面积对整个建成区温度上升的贡献为1.03℃。这表明,虽然水体减少的面积仅占建成区面积的6.08%,还不到一成,但已使整个建成区的温度上升了1.03℃,升幅相当可观。而在水体减少的具体区域,其升温贡献恐怕还远不止于此。为此,本文选取浦下洲(图4e~f)为例来进一步分析局部水体减少的升温效应。
浦下洲的河流面积在1989~2014年间减少了99 hm2,假设这99 hm2水体在2014年仍为水体,则可以将2014年研究区河流水体的平均温度(49.62℃)回代给这99 hm2图斑的像元,作为这些像元的温度,然后重新统计其地表平均温度,得到该区新的平均温度,为51.57℃,而2014年该区实际平均温度为55.13℃,二者的温差ΔLLST =55.13- 51.57=3.6℃。可见,局部水体减少对其所在区域具有极为显著的升温效应。
福州市建成区地表水体的空间格局发生了很大的变化,基于遥感信息提取技术揭示了1989~2014年间福州建成区的水体面积呈不断下降趋势,地表水体总面积减少了1 490.67 hm2,而在河流、湖泊、坑塘这三大类水体中,河流的面积减少最多,达951.21 hm2,占水体减少总面积的63.8%。
定量分析表明,1989~2014年研究区所减少的1 490.67 hm2地表水体对福州建成区温度上升的平均贡献为1.03℃。而在水体减少的具体区域,其升温效应更为明显。浦下洲实例证明局部水体的消失可对该区产生3.6℃的升温效应。
地表水体的时空演变会对城市热环境产生明显的影响,城市地表水体的大面积减少会加剧城市的升温并引发热岛效应。因此,城市规划与建设必须尽量保存地表水体,使城市建设为真正生态优美的宜居城市。
The authors have declared that no competing interests exist.
| [1] |
城市中水体的微气候效应研究 [J].https://doi.org/10.3878/j.issn.1006-9895.2008.03.12 Magsci [本文引用: 1] 摘要
应用观测资料分析和数值模拟的方法来研究城市中水体的微气候效应, 结果表明, 城市中的水体对其周边的小气候有着明显的调节作用。城市中商业区温度最高、湿度最小; 交通区次之; 水体附近温度最低、湿度最大, 平均湿度比商业区高出约10%。水体区的月平均温度日较差比其他功能区明显大。水体区的月平均温度比其他功能区低0.37~1.15℃。水体对环境的影响主要发生在上风岸2 km以内和下风岸9 km以内, 以2.5 km以内最为明显。水体的面积和布局是影响小气候效应的重要因素。水体面积越大对环境影响越大, 单块的小于0.25 km2的水体对环境的影响不明显, 但是多块、密集分布的小面积水体会对环境的降温增湿效果更显著。在本文个例中, 与其他湖泊邻近的面积为1.25 km2的水体, 可以使2.5 km之内温差达到0.2~1.0℃, 水汽比湿增加0.1~0.7 g/kg。相对孤立的面积为2 km2的水体, 可以使1.0 km范围内降温幅度0.6℃, 水汽比湿增加0.1~0.4 g/kg。水体可以使地面风速增加, 一般能使风速增加0.1~0.2 m/s。
Li Wei et al. Analysis of microclimate effects of water body in a city. https://doi.org/10.3878/j.issn.1006-9895.2008.03.12 Magsci [本文引用: 1] 摘要
应用观测资料分析和数值模拟的方法来研究城市中水体的微气候效应, 结果表明, 城市中的水体对其周边的小气候有着明显的调节作用。城市中商业区温度最高、湿度最小; 交通区次之; 水体附近温度最低、湿度最大, 平均湿度比商业区高出约10%。水体区的月平均温度日较差比其他功能区明显大。水体区的月平均温度比其他功能区低0.37~1.15℃。水体对环境的影响主要发生在上风岸2 km以内和下风岸9 km以内, 以2.5 km以内最为明显。水体的面积和布局是影响小气候效应的重要因素。水体面积越大对环境影响越大, 单块的小于0.25 km2的水体对环境的影响不明显, 但是多块、密集分布的小面积水体会对环境的降温增湿效果更显著。在本文个例中, 与其他湖泊邻近的面积为1.25 km2的水体, 可以使2.5 km之内温差达到0.2~1.0℃, 水汽比湿增加0.1~0.7 g/kg。相对孤立的面积为2 km2的水体, 可以使1.0 km范围内降温幅度0.6℃, 水汽比湿增加0.1~0.4 g/kg。水体可以使地面风速增加, 一般能使风速增加0.1~0.2 m/s。
|
| [2] |
Predicting river water temperatures using the equilibrium temperature concept with application on Miramichi river catchments(New Brunswick, Canada) [J].https://doi.org/10.1002/hyp.5684 URL 摘要
Abstract Water temperature influences most of the physical, chemical and biological properties of rivers. It plays an important role in the distribution of fish and the growth rates of many aquatic organisms. Therefore, a better understanding of the thermal regime of rivers is essential for the management of important fisheries resources. This study deals with the modelling of river water temperature using a new and simplified model based on the equilibrium temperature concept. The equilibrium temperature concept is an approach where the net heat flux at the water surface can be expressed by a simple equation with fewer meteorological parameters than required with traditional models. This new water temperature model was applied on two watercourses of different size and thermal characteristics, but within a similar meteorological region, i.e., the Little Southwest Miramichi River and Catamaran Brook (New Brunswick, Canada). A study of the long-term thermal characteristics of these two rivers revealed that the greatest differences in water temperatures occurred during mid-summer peak temperatures. Data from 1992 to 1994 were used for the model calibration, while data from 1995 to 1999 were used for the model validation. Results showed a slightly better agreement between observed and predicted water temperatures for Catamaran Brook during the calibration period, with a root-mean-square error (RMSE) of 1·10 °C (Nash coefficient, NTD = 0·95) compared to 1·45 °C for the Little Southwest Miramichi River (NTD = 0·94). During the validation period, RMSEs were calculated at 1·31 °C for Catamaran Brook and 1·55 °C for the Little Southwest Miramichi River. Poorer model performances were generally observed early in the season (e.g., spring) for both rivers due to the influence of snowmelt conditions, while late summer to autumn modelling performances showed better results. Copyright 08 2005 John Wiley & Sons, Ltd.
|
| [3] |
我国地表水系的变化及其对地图修编的影响 [J].
从地理学的角度看待地球,人类赖以生存的地球实际是一个“水球”,陆地面积仅占表面的28%,较大时空范围内的水循环是万物生长的源泉。因此,地表水系是自然地理要素中最活跃最有生命力的要素。在我国,500毫米年降水量等值线大致划分了干旱、半干旱区和湿润、半湿润区,近几十年来,随着气候条件的变化和社会的发展,我国地表水系发生了较大变化,尤其是湖泊、河流变化更明显,在进行大范围的地图修编以及
Change of surface water and its impact on the revision of the map.
从地理学的角度看待地球,人类赖以生存的地球实际是一个“水球”,陆地面积仅占表面的28%,较大时空范围内的水循环是万物生长的源泉。因此,地表水系是自然地理要素中最活跃最有生命力的要素。在我国,500毫米年降水量等值线大致划分了干旱、半干旱区和湿润、半湿润区,近几十年来,随着气候条件的变化和社会的发展,我国地表水系发生了较大变化,尤其是湖泊、河流变化更明显,在进行大范围的地图修编以及
|
| [4] |
Spatial-temporal changes of landscape pattern in response to urbanization [J].https://doi.org/10.1016/j.landurbplan.2007.01.009 URL Magsci [本文引用: 1] 摘要
<h2 class="secHeading" id="section_abstract">Abstract</h2><p id="">The combined method of urban gradient analysis and landscape metrics in analyzing the changes of landscape pattern has been widely applied since its introduction by <span id="bbib30"><a href="#bib30" id="ancbbib30" class="intra_ref">Luck and Wu (2002)</a></span>. In order to address the temporal dynamics of landscape change, this study integrated transect analysis with temporal trend analysis and specifically discussed how changes of residential pattern are related to forms of urban growth. Using Dane County, Wisconsin, USA as an example, a 60 km transect passing through the City of Madison was set up to represent a continuum of rural-urban-rural landscapes. Changes of landscape pattern from 1968 to 2000 were analyzed by FRAGSTATS with four metrics—percentage of landscape (PLAND), Shannon's evenness index (SHEI), patch density (PD), and mean patch size (MPS). Findings from metric analyses revealed that the degree of land-use diversity and landscape fragmentation is positively related to the degree of urbanization.</p><p id="">Specifically, at the class-level, residential land-use type shows the strongest positive relationship to the degree of urbanization in all of the class-level metrics adopted. Changes in residential land-use pattern were further analyzed with the number of housing units. The analyses revealed that there are different patterns of residential development along the transect in the study area—with the core urban area expanding outward in a contiguous manner while the rural areas have scattered development. This study demonstrated the additional insights into landscape change by integrating the spatial and the temporal perspectives and by targeting the forms of residential developments.</p>
|
| [5] |
Spatial impact of urban expansion on surface water bodies-A case study of Wuhan, China [J].https://doi.org/10.1016/j.landurbplan.2009.10.002 URL [本文引用: 1] 摘要
This study aims to raise the level of attention paid to surface water management issues in spatial planning and urban development processes. In the case of cities located in alluvial river plains, surface water bodies may occupy large areas but severe ecological and environmental consequences can arise if they are given insufficient weight in the planning and development processes. After discus...
|
| [6] |
Multimodel assessment of water scarcity under climate change [J].https://doi.org/10.1073/pnas.1222460110 URL PMID: 24344289 [本文引用: 1] 摘要
Water scarcity severely impairs food security and economic prosperity in many countries today. Expected future population changes will, in many countries as well as globally, increase the pressure on available water resources. On the supply side, renewable water resources will be affected by projected changes in precipitation patterns, temperature, and other climate variables. Here we use a large ensemble of global hydrological models (GHMs) forced by five global climate models and the latest greenhouse-gas concentration scenarios (Representative Concentration Pathways) to synthesize the current knowledge about climate change impacts on water resources. We show that climate change is likely to exacerbate regional and global water scarcity considerably. In particular, the ensemble average projects that a global warming of 2 degrees C above present (approximately 2.7 degrees C above preindustrial) will confront an additional approximate 15% of the global population with a severe decrease in water resources and will increase the number of people living under absolute water scarcity (< 500 m(3) per capita per year) by another 40% (according to some models, more than 100%) compared with the effect of population growth alone. For some indicators of moderate impacts, the steepest increase is seen between the present day and 2 degrees C, whereas indicators of very severe impacts increase unabated beyond 2 degrees C. At the same time, the study highlights large uncertainties associated with these estimates, with both global climate models and GHMs contributing to the spread. GHM uncertainty is particularly dominant in many regions affected by declining water resources, suggesting a high potential for improved water resource projections through hydrological model development.
|
| [7] |
Spatiotemporal dynamic of surface water bodies using Landsat time-series data from 1999 to 2011 [J].https://doi.org/10.1016/j.isprsjprs.2013.01.010 Magsci 摘要
Detailed information on the spatiotemporal dynamic in surface water bodies is important for quantifying the effects of a drying climate, increased water abstraction and rapid urbanization on wetlands. The Swan Coastal Plain (SCP) with over 1500 wetlands is a global biodiversity hotspot located in the southwest of Western Australia, where more than 70% of the wetlands have been lost since European settlement. SCP is located in an area affected by recent climate change that also experiences rapid urban development and ground water abstraction. Landsat TM and ETM+ imagery from 1999 to 2011 has been used to automatically derive a spatially and temporally explicit time-series of surface water body extent on the SCP. A mapping method based on the Landsat data and a decision tree classification algorithm is described. Two generic classifiers were derived for the Landsat 5 and Landsat 7 data. Several landscape metrics were computed to summarize the intra and interannual patterns of surface water dynamic. Top of the atmosphere (TOA) reflectance of band 5 followed by TOA reflectance of bands 4 and 3 were the explanatory variables most important for mapping surface water bodies. Accuracy assessment yielded an overall classification accuracy of 96%, with 89% producer's accuracy and 93% user's accuracy of surface water bodies. The number, mean size, and total area of water bodies showed high seasonal variability with highest numbers in winter and lowest numbers in summer. The number of water bodies in winter increased until 2005 after which a decline can be noted. The lowest numbers occurred in 2010 which coincided with one of the years with the lowest rainfall in the area. Understanding the spatiotemporal dynamic of surface water bodies on the SCP constitutes the basis for understanding the effect of rainfall, water abstraction and urban development on water bodies in a spatially explicit way. (C) 2013 International Society for Photogrammetry and Remote Sensing, Inc. (ISPRS) Published by Elsevier B.V. All rights reserved.
|
| [8] |
Water feature extraction and change detection using multitemporal Landsat imagery [J].
|
| [9] |
Detecting changes in surface water area of Lake Kyoga sub-basin using remotely sensed imagery in a changing climate [J].URL 摘要
Detection of changes in Earth surface features, for example lakes, is important for understanding the relationships between human and natural phenomena in order to manage better the increasingly scarc
|
| [10] |
Long-term land cover dynamics by multi-temporal classification across the Landsat-5 record [J].https://doi.org/10.1016/j.rse.2012.10.010 Magsci 摘要
Supervised classification of land cover across space and time is a long-standing goal of the Earth Science community. Although most past and current analyses focus on detecting changes between two or more times, the opening of the USGS Landsat archive in 2009 has enabled exploration of methods for higher-frequency, time-serial monitoring of land cover dynamics. Modifying the protocols used to develop the 2001 National Land Cover Database (NLCD 2001), we fit a single classifier to a spatio-temporally distributed reference sample and applied the model to 55 Landsat-5 images covering a section of the North Carolina Piedmont Plateau from 1984 to 2007. A generalized classification scheme, multi-temporal sampling design, supervised classification based on intra-annual spectral indices, and design-based accuracy assessment yielded a time-series of 16 land cover maps from 1985 to 2006 with a spatial extent of 1.7x 10(6) ha, minimum mapping unit of 1 ha, and mean temporal interval of <2 years. Comparable to accuracy of the NLCD 2001 Land Cover Layer for the region, overall accuracy for a spatio-temporally independent test sample was 75%, with K=0.7. When weighted by class proportions, percent correctly classified and kappa rose to 88% and 0.84, respectively. The resulting map series shows spatially and temporally complex changes in water, urban, forest, and herbaceous cover resulting from natural and anthropogenic processes that would not be observable in either unior bi-temporal maps. Agricultural crop area dropped from similar to 45% in the 1980s to similar to 36% in the 1990s and then rose slightly to similar to 38% at the end of the period. Forest area increased to a maximum of similar to 55% in the 1990s and then dropped to similar to 53% in 2005. Urban growth appeared to be most rapid in the 1980s and 1990s and slowed thereafter. With continued focus on the semantics, causation, sampling, and uncertainty underlying spectral land cover classification, long-term series of Landsat images will provide increasingly robust, reliable records for a growing scientific user community. These multi-temporal datasets will be indispensable for understanding past land cover dynamics and predicting the implications of future change on the provision and management of ecosystem services. (C) 2012 Elsevier Inc. All rights reserved.
|
| [11] |
武汉市湖泊景观动态遥感分析 (1973~2013年) [J].https://doi.org/10.18307/2015.0424 URL 摘要
城市湖泊是城市湿地的重要组成部分,其演变受到人类活动的严重干扰,也影响城市的可持续发展.利用19732013年40年间Landsat MSS(3景)、Landsat 5 TM(5景)和Landsat 8(1景)共9景遥感影像,从景观角度分析武汉市主要湖泊的变化.首先借助遥感和地理信息系统技术提取湖泊信息,然后通过主成分分析法选取平均斑块面积(MPS)、斑块面积标准差(PSSD)、边界密度(ED)和斑块平均分维数(MPDF)4个景观指数用于湖泊景观分析.结果表明,武汉市湖泊变化经历了4大阶段:(1)1970s,由于"围湖造田"政策的推行,湖泊总面积、MPS和PSSD急剧减小,湖泊斑块数量(尤其是小型湖泊)急剧增加,大湖破碎、小湖增加;(2)1980s,推行"退田还湖"政策,湖泊总面积有较大回升,但小型湖泊消亡现象较为严重;(3)1990s,由于经济发展和人口增长等原因,湖泊水面面积仍缓慢波动减小;(4)21世纪后,湖泊斑块数量持续缓慢增加,但湖泊总面积呈减少趋势,故又可能进入一轮大湖萎缩或破碎、小湖增加的阶段.总体而言,武汉城市湖泊受到人为干扰和政策导向影响明显,应大力加强湖泊的科学管理,合理地开发利用,保护好湖泊自然资源.
The dynamic analysis of lake landscape of Wuhan City in recent 40 years. https://doi.org/10.18307/2015.0424 URL 摘要
城市湖泊是城市湿地的重要组成部分,其演变受到人类活动的严重干扰,也影响城市的可持续发展.利用19732013年40年间Landsat MSS(3景)、Landsat 5 TM(5景)和Landsat 8(1景)共9景遥感影像,从景观角度分析武汉市主要湖泊的变化.首先借助遥感和地理信息系统技术提取湖泊信息,然后通过主成分分析法选取平均斑块面积(MPS)、斑块面积标准差(PSSD)、边界密度(ED)和斑块平均分维数(MPDF)4个景观指数用于湖泊景观分析.结果表明,武汉市湖泊变化经历了4大阶段:(1)1970s,由于"围湖造田"政策的推行,湖泊总面积、MPS和PSSD急剧减小,湖泊斑块数量(尤其是小型湖泊)急剧增加,大湖破碎、小湖增加;(2)1980s,推行"退田还湖"政策,湖泊总面积有较大回升,但小型湖泊消亡现象较为严重;(3)1990s,由于经济发展和人口增长等原因,湖泊水面面积仍缓慢波动减小;(4)21世纪后,湖泊斑块数量持续缓慢增加,但湖泊总面积呈减少趋势,故又可能进入一轮大湖萎缩或破碎、小湖增加的阶段.总体而言,武汉城市湖泊受到人为干扰和政策导向影响明显,应大力加强湖泊的科学管理,合理地开发利用,保护好湖泊自然资源.
|
| [12] |
近百年来北京市地表水体时空变化特征及驱动力分析 [J].URL 摘要
基于遥感和GIS技术,利用1910年代、1950年代、1980年代的地形图和2000年代的航空遥感影像数据,通过数字化和人工解译,获取了北京市地表水体时空数据集,并在此基础上分析了近百年来北京市地表水体时空变化特征及驱动力。研究结果表明,近百年来北京市地表水体面积总体呈现增长趋势,从1910年代的125.25km2增长到2000年代的456.88km2,净增长331.63km2,增长率为264.77%。不同时段地表水体的变化特征各不相同。1910—1950年代,地表水体面积的增加以河流为主,河流面积增加了41.14km2,占水体增加面积的83.7%;1950—1980年代,水库和坑塘的面积增长最为显著,分别增长了152.98km2和101.88km2;线状水系密度的增长主要依赖于沟渠密度的增加。1980—2000年代,北京市地表水体的面积增加了76.32km2,但是水库面积缩减了24.2%。北京市地表水体变化的主要驱动因子包括降雨、地表水资源开发、用水以及水环境治理工程。
Spatial-temporal variation and driving forces of surface water in Beijing over one hundred years. URL 摘要
基于遥感和GIS技术,利用1910年代、1950年代、1980年代的地形图和2000年代的航空遥感影像数据,通过数字化和人工解译,获取了北京市地表水体时空数据集,并在此基础上分析了近百年来北京市地表水体时空变化特征及驱动力。研究结果表明,近百年来北京市地表水体面积总体呈现增长趋势,从1910年代的125.25km2增长到2000年代的456.88km2,净增长331.63km2,增长率为264.77%。不同时段地表水体的变化特征各不相同。1910—1950年代,地表水体面积的增加以河流为主,河流面积增加了41.14km2,占水体增加面积的83.7%;1950—1980年代,水库和坑塘的面积增长最为显著,分别增长了152.98km2和101.88km2;线状水系密度的增长主要依赖于沟渠密度的增加。1980—2000年代,北京市地表水体的面积增加了76.32km2,但是水库面积缩减了24.2%。北京市地表水体变化的主要驱动因子包括降雨、地表水资源开发、用水以及水环境治理工程。
|
| [13] |
近30年来深圳河网变化及其生态效应分析 [J].Magsci 摘要
<p>在地形图、河道普查数据、遥感影像等多源数据支持下, 分析了深圳近30 年河网的时空变化规律及其与城市化水平的关系, 在此基础上通过分析植被盖度、生产有机物质的价值、生态系统服务价值、生态资产等指标的变化规律探讨了深圳观澜河流域河网变化的生态效应。 结果表明: (1) 近30 年深圳市河网结构趋于简单化、主干化, 河流支流发展受到较大限制; 河网总长度减少355.4 km, 总条数减少378 条, 河网密度从0.84 km/km<sup>2</sup> 降低到0.65 km/km<sup>2</sup>; 以区/ 街道办驻地为圆心, 半径为1-2 km 的圆环区成为河网萎缩、河网消失的主要 区域; 依据流域城市化水平和河流主干是否直接入海等2 个指标可将深圳市9 大流域/ 水系 分为4 种不同的河网变化类型; (2) 当城市化水平低于30%时, 城镇用地扩展与河网萎缩, 尤其是河网支流的萎缩存在显著相关; 当城市化水平大于30%时, 城镇用地扩展对河网的影响较小; (3) 2000-2005 年观澜河流域生态系统功能显著降低, 以生产有机物质价值降低幅度最 大(41%), 植被盖度次之(24%), 单位面积生态资产从2.79 元/m<sup>2</sup> 降低到2.34 元/m<sup>2</sup>, 总生态 资产减少3136 万元; (4) 河网变化和城市化成为影响生态系统功能的主要因素, 其中河网变化因素和城市化因素对植被盖度降低的贡献率分别为23.1%和35.8%, 对生产有机物质价值减少的贡献率分别为25.1%和32.7%, 对生态系统服务价值减少的贡献率分别为7.7%和 56.2%, 对生态资产减少的贡献率分别为10.6%和52.2%。</p>
River network change and its ecological effects in Shenzhen region in recent 30 years. Magsci 摘要
<p>在地形图、河道普查数据、遥感影像等多源数据支持下, 分析了深圳近30 年河网的时空变化规律及其与城市化水平的关系, 在此基础上通过分析植被盖度、生产有机物质的价值、生态系统服务价值、生态资产等指标的变化规律探讨了深圳观澜河流域河网变化的生态效应。 结果表明: (1) 近30 年深圳市河网结构趋于简单化、主干化, 河流支流发展受到较大限制; 河网总长度减少355.4 km, 总条数减少378 条, 河网密度从0.84 km/km<sup>2</sup> 降低到0.65 km/km<sup>2</sup>; 以区/ 街道办驻地为圆心, 半径为1-2 km 的圆环区成为河网萎缩、河网消失的主要 区域; 依据流域城市化水平和河流主干是否直接入海等2 个指标可将深圳市9 大流域/ 水系 分为4 种不同的河网变化类型; (2) 当城市化水平低于30%时, 城镇用地扩展与河网萎缩, 尤其是河网支流的萎缩存在显著相关; 当城市化水平大于30%时, 城镇用地扩展对河网的影响较小; (3) 2000-2005 年观澜河流域生态系统功能显著降低, 以生产有机物质价值降低幅度最 大(41%), 植被盖度次之(24%), 单位面积生态资产从2.79 元/m<sup>2</sup> 降低到2.34 元/m<sup>2</sup>, 总生态 资产减少3136 万元; (4) 河网变化和城市化成为影响生态系统功能的主要因素, 其中河网变化因素和城市化因素对植被盖度降低的贡献率分别为23.1%和35.8%, 对生产有机物质价值减少的贡献率分别为25.1%和32.7%, 对生态系统服务价值减少的贡献率分别为7.7%和 56.2%, 对生态资产减少的贡献率分别为10.6%和52.2%。</p>
|
| [14] |
城市典型水域景观的热环境效应 [J].https://doi.org/10.5846/stxb201112141915 Magsci [本文引用: 1] 摘要
城市热岛效应是当前快速城市化进程中最具代表性的生态环境问题之一。热岛效应进一步影响着城市气候变化与城市可持续发展。现存大量研究证明了土地覆被改变导致的热辐射变化及人为热释放共同作用产生了城市热岛。然而,当前对缓解城市热岛效应要素的研究并不多见。以上海市中心城区为例,首先基于SPOT5影像的分类,提取了城市水域景观,再利用Landsat 7的ETM+的热红外波段,定量反演了城市地表热环境温度,然后利用GIS的空间分析功能,探讨了城市水域景观对热环境的影响。研究揭示水域景观在城市热环境中表现出明显的低温效应,而面状水域景观的热环境效应要强于线状河流景观。面状水域景观对热环境影响随着与热岛中心距离的增加而明显降低,此外还受到周围土地覆被的影响。线状河流景观的宽度与流经区域共同决定了其对城市热环境的影响能力。因此,在城市规划设计中,从缓解城市热岛效应出发,水域生态功能区的形态与空间设置可作为考虑因素之一。
Thermal environment effect of urban water landscape. https://doi.org/10.5846/stxb201112141915 Magsci [本文引用: 1] 摘要
城市热岛效应是当前快速城市化进程中最具代表性的生态环境问题之一。热岛效应进一步影响着城市气候变化与城市可持续发展。现存大量研究证明了土地覆被改变导致的热辐射变化及人为热释放共同作用产生了城市热岛。然而,当前对缓解城市热岛效应要素的研究并不多见。以上海市中心城区为例,首先基于SPOT5影像的分类,提取了城市水域景观,再利用Landsat 7的ETM+的热红外波段,定量反演了城市地表热环境温度,然后利用GIS的空间分析功能,探讨了城市水域景观对热环境的影响。研究揭示水域景观在城市热环境中表现出明显的低温效应,而面状水域景观的热环境效应要强于线状河流景观。面状水域景观对热环境影响随着与热岛中心距离的增加而明显降低,此外还受到周围土地覆被的影响。线状河流景观的宽度与流经区域共同决定了其对城市热环境的影响能力。因此,在城市规划设计中,从缓解城市热岛效应出发,水域生态功能区的形态与空间设置可作为考虑因素之一。
|
| [15] |
近30 a来福州盆地中心的城市扩展进程 [J].
位于福州盆地中心的福州市在城市化进程的推动下,城市空间快速扩展。利用多时相遥感影像和IBI建筑用地指数获得的建筑用地信息表明,福州市建成区在1976~2006年的30 a间面积增加了105 km2,增幅达到3.2倍。由于金山、快安等新城区的形成和马尾区的扩展,整个福州城区从西到东几乎连成一片,城市扩展经历了先慢后快,先北、后东、西的扩展历程。研究发现,福州城市的空间扩展并不属于工业主导型,而是第三产业推动型。城市空间的快速扩展已给福州带来了一定的环境资源问题,其中最突出的就是城市热岛效应与城市建筑用地总量控制问题。
Urban expansion process in the center of the Fuzhou basin, southeast china in 1976-2006.
位于福州盆地中心的福州市在城市化进程的推动下,城市空间快速扩展。利用多时相遥感影像和IBI建筑用地指数获得的建筑用地信息表明,福州市建成区在1976~2006年的30 a间面积增加了105 km2,增幅达到3.2倍。由于金山、快安等新城区的形成和马尾区的扩展,整个福州城区从西到东几乎连成一片,城市扩展经历了先慢后快,先北、后东、西的扩展历程。研究发现,福州城市的空间扩展并不属于工业主导型,而是第三产业推动型。城市空间的快速扩展已给福州带来了一定的环境资源问题,其中最突出的就是城市热岛效应与城市建筑用地总量控制问题。
|
| [16] |
Summary of current radiometric calibration coefficients for Landsat MSS, TM, ETM+, and EO-1 ALI sensors [J].https://doi.org/10.1016/j.rse.2009.01.007 URL [本文引用: 1] 摘要
This paper provides a summary of the current equations and rescaling factors for converting calibrated Digital Numbers (DNs) to absolute units of at-sensor spectral radiance, Top-Of-Atmosphere (TOA) reflectance, and at-sensor brightness temperature. It tabulates the necessary constants for the Multispectral Scanner (MSS), Thematic Mapper (TM), Enhanced Thematic Mapper Plus (ETM+), and Advanced Land Imager (ALI) sensors. These conversions provide a basis for standardized comparison of data in a single scene or between images acquired on different dates or by different sensors. This paper forms a needed guide for Landsat data users who now have access to the entire Landsat archive at no cost.
|
| [17] |
Image-based atmospheric corrections-revisited and revised [J].
|
| [18] |
基于影像的Landsat TM/ETM+数据正规化技术 [J].
阐述了基于影像的Landsat TM/ETM+的数据正规化技术及其发展。该技术通过将Landsat影像的亮度值转换成传感器处的辐射值和反射率来对影像进行辐射校正。实例表明,使用正规化技术处理后的影像可以明显削弱日照和大气的影响,去除它们产生的噪声;其所求的传感器处的反射率与地面实测反射率的RMS值非常小。
Image-based normalization technique used for landsat TM/ETM+ imagery.
阐述了基于影像的Landsat TM/ETM+的数据正规化技术及其发展。该技术通过将Landsat影像的亮度值转换成传感器处的辐射值和反射率来对影像进行辐射校正。实例表明,使用正规化技术处理后的影像可以明显削弱日照和大气的影响,去除它们产生的噪声;其所求的传感器处的反射率与地面实测反射率的RMS值非常小。
|
| [19] |
利用改进的归一化差异水体指数(MNDWI)提取水体信息的研究 [J].https://doi.org/10.11834/jrs.20050586 Magsci [本文引用: 1] 摘要
在对M cfeeters提出的归一化差异水体指数(NDWI)分析的基础上,对构成该指数的波长组合进行了修改,提出了改进的归一化差异水体指数MNDWI(M odified NDWI),并分别将该指数在含不同水体类型的遥感影像进行了实验,大部分获得了比NDWI好的效果,特别是提取城镇范围内的水体。NDWI指数影像因往往混有城镇建筑用地信息而使得提取的水体范围和面积有所扩大。实验还发现MNDWI比NDWI更能够揭示水体微细特征,如悬浮沉积物的分布、水质的变化。另外,MNDWI可以很容易地区分阴影和水体,解决了水体提取中难于消除阴影的难题。
Image-based normalization technique used for landsat TM/ET+ imagery. https://doi.org/10.11834/jrs.20050586 Magsci [本文引用: 1] 摘要
在对M cfeeters提出的归一化差异水体指数(NDWI)分析的基础上,对构成该指数的波长组合进行了修改,提出了改进的归一化差异水体指数MNDWI(M odified NDWI),并分别将该指数在含不同水体类型的遥感影像进行了实验,大部分获得了比NDWI好的效果,特别是提取城镇范围内的水体。NDWI指数影像因往往混有城镇建筑用地信息而使得提取的水体范围和面积有所扩大。实验还发现MNDWI比NDWI更能够揭示水体微细特征,如悬浮沉积物的分布、水质的变化。另外,MNDWI可以很容易地区分阴影和水体,解决了水体提取中难于消除阴影的难题。
|
| [20] |
形状信息的提取与计算机自动分类 [J].
近年来,遥感数据越来越普遍地被利用为更新地理信息系统的数据源。但利用GIS来改善分类精度的探讨却很少。本文提出了利用GIS技术来提取形状信息和改善分类精度的新方法,从而使一些容易混淆的分类得到了纠正。
A new method to improve classification accuracy with shape information.
近年来,遥感数据越来越普遍地被利用为更新地理信息系统的数据源。但利用GIS来改善分类精度的探讨却很少。本文提出了利用GIS技术来提取形状信息和改善分类精度的新方法,从而使一些容易混淆的分类得到了纠正。
|
| [21] |
SPOT 卫星影像的水体提取方法及分类研究 [J].https://doi.org/10.11834/jrs.20010309 Magsci [本文引用: 1] 摘要
文中分析了水体及其它主要的地物的光谱特征在SPOT曩像中的表征特征,发现大多数地形阴影与水体的光谱特征具有一定的相似性,因而用单一的方法很难有效地提取山区的水体,经过研究,发现用决策树分类方法,在各节点设计不同的分类器,可以有效地提取山区中的水体,由于不同类型的水体其面积,周长,形状等几何特征各有特点,并且与地貌类型有一定的关系,因而可利用水体的空间特征信息,对提取的水体进行分类,其方法也选用决策树分类方法,分类结果令人满意。
Study on water bodies extraction and classification from SPOT image. https://doi.org/10.11834/jrs.20010309 Magsci [本文引用: 1] 摘要
文中分析了水体及其它主要的地物的光谱特征在SPOT曩像中的表征特征,发现大多数地形阴影与水体的光谱特征具有一定的相似性,因而用单一的方法很难有效地提取山区的水体,经过研究,发现用决策树分类方法,在各节点设计不同的分类器,可以有效地提取山区中的水体,由于不同类型的水体其面积,周长,形状等几何特征各有特点,并且与地貌类型有一定的关系,因而可利用水体的空间特征信息,对提取的水体进行分类,其方法也选用决策树分类方法,分类结果令人满意。
|
| [22] |
一种快速提取不透水面的新型遥感指数 [J].
首次采用复合波段的形式创建了归一化差值不透水面指数(normalized difference impervious surfaceindex,NDISI)。它可以用于大区域范围内快速、自动地提取不透水面信息。通过Landsat ETM+和ASTER两种影像的实验证明,新的指数能够有效地增强不透水面信息,并具有较高的提取精度。
A new remote sensing index for fastly extracting impervious surface information.
首次采用复合波段的形式创建了归一化差值不透水面指数(normalized difference impervious surfaceindex,NDISI)。它可以用于大区域范围内快速、自动地提取不透水面信息。通过Landsat ETM+和ASTER两种影像的实验证明,新的指数能够有效地增强不透水面信息,并具有较高的提取精度。
|
| [23] |
A generalized single-channel method for retrieving land surface temperature from remote sensing data [J].https://doi.org/10.1029/2003JD003480 URL [本文引用: 1] 摘要
Many papers have developed algorithms to retrieve land surface temperature from at-sensor and land surface emissivity data. These algorithms have been specified for different thermal sensors on board satellites, i.e., the algorithm used for one thermal sensor (or a combination of thermal sensors) cannot be used for other thermal sensor. The main goal of this paper is to propose a generalized single-channel algorithm that only uses the total atmospheric water vapour content and the channel effective wavelength (assuming that emissivity is known), and can be applied to thermal sensors characterized with a FWHM (Full-Width Half-Maximum) of around 1 μm actually operative on board satellites. The main advantage of this algorithm compared with the other single-channel methods is that in-situ radiosoundings or effective mean atmospheric temperature values are not needed, whereas the main advantage of this algorithm compared with split-window and dual-angle methods is that it can be applied to different thermal sensors using the same equation and coefficients. The validation for different test sites shows root mean square deviations lower than 2 K for AVHRR channel 4 (λ≈ 10.8 μm) and ATSR-2 channel 2 (λ≈ 11 μm), and lower than 1.5 K for Landsat Thematic Mapper (TM) band 6 (λ≈ 11.5 μm).
|
| [24] |
单通道算法地表温度反演的若干问题讨论——以Landsat系列数据为例 [J].https://doi.org/10.13203/j.whugis20130733 Magsci 摘要
<b>目的</b>在地表温度反演中,Jiménez Muoz和Sobrino开发的单通道(SC)算法因其需要的实时大气参数少而被广泛应用。由于SC算法在2003年提出时只提供了针对LandsatTM的大气参数,导致许多后续基于ETM+数据的地表温度计算也都采用TM的大气参数。即使SC算法于2009年提出了改进版,但这一混用现象仍未改观。因此,基于实测地表温度,以Landsat5/7/8号卫星的热红外数据为例比较了2003和2009版的算法,探讨了Planck函数、λ取值和大气参数等常见问题。结果表明,2009版的算法明显提高了ETM+地表温度反演的精度,且以采用Planck函数和USGS提供的λ值时所获得的平均精度最高。在当前,如果要用SC算法来反演Landsat8的地表温度,可在大气水汽含量较低时选用TIRS10波段来单独进行。
Some issues in land surface temperature retrieval of landsat thermal data with the single-channel algorithm. https://doi.org/10.13203/j.whugis20130733 Magsci 摘要
<b>目的</b>在地表温度反演中,Jiménez Muoz和Sobrino开发的单通道(SC)算法因其需要的实时大气参数少而被广泛应用。由于SC算法在2003年提出时只提供了针对LandsatTM的大气参数,导致许多后续基于ETM+数据的地表温度计算也都采用TM的大气参数。即使SC算法于2009年提出了改进版,但这一混用现象仍未改观。因此,基于实测地表温度,以Landsat5/7/8号卫星的热红外数据为例比较了2003和2009版的算法,探讨了Planck函数、λ取值和大气参数等常见问题。结果表明,2009版的算法明显提高了ETM+地表温度反演的精度,且以采用Planck函数和USGS提供的λ值时所获得的平均精度最高。在当前,如果要用SC算法来反演Landsat8的地表温度,可在大气水汽含量较低时选用TIRS10波段来单独进行。
|
| [25] |
Land surface temperature retrieval methods from Landsat 8 thermal infrared sensor data [J].https://doi.org/10.1109/LGRS.2014.2312032 Magsci [本文引用: 1] 摘要
The importance of land surface temperature (LST) retrieved from high to medium spatial resolution remote sensing data for many environmental studies, particularly the applications related to water resources management over agricultural sites, was a key factor for the final decision of including a thermal infrared (TIR) instrument on board the Landsat Data Continuity Mission or Landsat-8. This new TIR sensor (TIRS) includes two TIR bands in the atmospheric window between 10 and 12 mu m, thus allowing the application of split-window (SW) algorithms in addition to single-channel (SC) algorithms or direct inversions of the radiative transfer equation used in previous sensors on board the Landsat platforms, with only one TIR band. In this letter, we propose SC and SW algorithms to be applied to Landsat-8 TIRS data for LST retrieval. Algorithms were tested with simulated data obtained from forward simulations using atmospheric profile databases and emissivity spectra extracted from spectral libraries. Results show mean errors typically below 1.5 K for both SC and SW algorithms, with slightly better results for the SW algorithm than for the SC algorithm with increasing atmospheric water vapor contents.
|
| [26] |
城市不透水面与相关城市生态要素关系的定量分析 [J].
城市空间的快速扩展已使得原来以植被为主的自然景观逐渐被人工不透水建筑物所取代,并对区域乃至全球的生态系统造成了明显的影响。因此,准确了解城市不透水面及其与植被、水体、城市热环境的相关关系对于城市的科学规划和城市生态系统的修复具有重要的意义。以福州市为例,采用遥感空间信息技术,获得了城市不透水面、地表温度、植被和水体的信息,并对它们的关系进行了定量分析。发现了城市不透水面与地表温度之间的关系并不是一种简单的线性关系,而是一种很显著的指数函数关系,说明高不透水面比例地区的升温效应要明显高于低不透水面比例地区。多元统计分析表明不透水面是引发城市热岛的最重要因子。
Quantitative analysis on the relationship of urban impervious surface with other components of the urban ecosystem.
城市空间的快速扩展已使得原来以植被为主的自然景观逐渐被人工不透水建筑物所取代,并对区域乃至全球的生态系统造成了明显的影响。因此,准确了解城市不透水面及其与植被、水体、城市热环境的相关关系对于城市的科学规划和城市生态系统的修复具有重要的意义。以福州市为例,采用遥感空间信息技术,获得了城市不透水面、地表温度、植被和水体的信息,并对它们的关系进行了定量分析。发现了城市不透水面与地表温度之间的关系并不是一种简单的线性关系,而是一种很显著的指数函数关系,说明高不透水面比例地区的升温效应要明显高于低不透水面比例地区。多元统计分析表明不透水面是引发城市热岛的最重要因子。
|

/
| 〈 |
|
〉 |
