杨清可 , 段学军, 金志丰
Yang Qingke, Duan Xuejun, Jin Zhifeng
中图分类号: K902
文献标识码: A
文章编号: 1000-0690(2017)04-0528-09
通讯作者:
收稿日期: 2016-04-20
修回日期: 2016-06-22
网络出版日期: 2017-04-25
版权声明: 2017 《地理科学》编辑部 本文是开放获取期刊文献,在以下情况下可以自由使用:学术研究、学术交流、科研教学等,但不允许用于商业目的.
基金资助:
作者简介:
作者简介:杨清可(1986-),男,山东滕州人,博士研究生,研究方向城市与区域规划。E-mail: yangqingke66@163.com
展开
摘要
选择城镇化进程快速、区位条件特殊的南通市作为案例,集成CLUE-S模型与Auto-logistic回归模型构建适合不同情景的建设用地扩张的动态分布模型。通过1987年以来遥感影像获取的4个时段的南通市建设用地增长时空特征分析提取先验知识规则,模拟在基准、经济发展、生态保护等情景下建设用地增长与空间布局,通过景观学知识分析其空间扩张的生态效应。结果表明,1987年以来,南通市建设用地扩张剧烈,空间上围绕城区和乡镇中心快速蔓延,呈现“轴线增长-内部填充”交替的周期性波动规律。Kappa系数与模拟正确率(PCM)显示,构建的复合集成模型具有较高的可靠性,能够应用于对未来建设用地空间分布的模拟。模拟结果显示未来建设用地扩张集中在城镇周边,其中在经济发展情景下还有向东部沿海滩涂扩展的趋势。由于扩张剧烈,在建设用地集中区呈现出融合成更大面积分布区的现象。建设用地空间扩张的斑块密度和景观形状指数均较高,景观格局趋于不稳定,破碎化相对严重。
关键词:
Abstract
Modeling and scenario analysis are the core content of the research on the spatial expansion of construction land. On account of the rapid urbanization process and the special geographical position, Nantong is chosen as the study case in this paper. We employ the hybrid model of CLUE-S and Auto-logistic regression to project the likelihood map of land use distribution, and then simulate the dynamic distribution of the expansion of construction land. We acquire a series of knowledge rules by analyzing the temporal and spatial characteristics of construction land expansion from four time periods of remote sensing images since 1987. The future expansion of construction land under different cenarios is then simulated based on the baseline model, economic development model, ecological conservation model. Through the landscape ecology knowledge we analyze the ecological environment effect of construction land expansion under different scenarios. Key results emerge: since 1987, the expansion of construction land in Nantong has been rapid, which is spreading intensely around the city and the town center on the space. It’s presented that the alternate rule of cyclical fluctuations in the form of ‘axis growth—interior filled’. At the meanwhile, the Kappa and PCM coefficients also show that the hybrid model has high reliability and can be applied to the simulation of the spatial distribution of construction land in the future. The simulation results declare that the expansion of construction land is concentrated in the urban area and towns around, and there is an obvious expansion trend towards the east coast under the economic development scenario. Due to the intense expansion, it’s very obvious that the spatial pattern tends to merge into the larger districts in the concentration area of construction land. The patch density and landscape shape index of the construction land expansion are both high, the landscape pattern tends to be unstable, and the fragmentation is also relatively severe. Therefore, not only control the amount of construction land expansion in the future land use, but also optimize the spatial landscape pattern, which can provide scientific basis for land intensive use, urban growth boundary control and ecosystem management of Nantong City.
Keywords:
快速的工业化和城镇化,使得城市扩张和蔓延成为过去几十年中全球城镇发展的显著特征,并将在未来持续发生[1,2]。城镇空间的增长和伴随发生的土地利用变化对生态系统服务功能、城镇形态和城镇居民的生活方式等产生了诸多影响[3]。尤其是中国作为世界上发展最快、人口最多的国家,城镇扩张产生的负面影响已经蔓延,如耕地占用、生态环境破坏等[4,5]。因此,城市扩张一直是地理学、生态学、3S科学等学科研究的重点,在中国尤其受到关注[6~8]。
认识和理解城市发展过程的特征规律,建立有效的城市空间扩张模型,对其扩张过程中的动态行为进行有效的描述、模拟、分析和预测,可以为区域发展、城市规划和管理等提供决策支持[9]。建设用地扩张是受各种因素共同作用的非线性复杂过程,模拟与预测需要一定规则指标或者模型支撑,虽然预测具有不确定性与片面性,但建设用地扩张动态模拟是城市化影响下的土地利用/覆盖变化以及城市化与环境变化交互机理研究的重要手段,在一定程度上为城镇发展与用地优化配置研究提供参考[10]。目前对城市扩张分析与模拟的研究较多,主要集中在时空变化探测、驱动机制分析、过程模型构建,以及宏观生态环境效应等多个方面[11]。基于微观的Cellular Automata(CA)和Multi-Agent System(MAS)的城市空间扩张模型[12, 13],以及基于灰色理论、系统动力学、神经网络和支持向量机等城市空间扩张规模预测模型因其具有鲜明的特点被应用于土地变化研究中,各模型在分析与预测土地数量结构变化、表达土地利用变化中的邻域关系、体现人为因素等复杂决策过程中的用地变化等方面具有不同的优势[14~17],对于土地利用的模拟产生较好的效果。但是,土地利用类型与影响因素之间的空间位置与土地利用类型变换的竞争关系较少涉及。对城市建设用地扩张的模拟多是建立在不同数学模型与预测指标的基础上,采用的模型和预测指标不同,致使模拟的结果差别较大。
基于上述背景,本文尝试利用经过改进的Auto-logistic回归模型与CLUE-S模型,对用地概率进行评估,引入距离函数作为空间权重的设定依据,体现建设用地变化中除竞争性之外的空间自组织性[18,19]。通过1987年以来高分辨率遥感信息探测获取的4个时段的南通市建设用地时空变化特征提取先验知识规则,模拟在基准、经济发展、生态保护等不同情景下建设用地增长过程与扩展特征,通过景观学知识来分析空间扩张的生态效应,为南通市土地集约利用、城市增长边界的划定和生态系统管理提供科学参考。
南通市位于江海交汇处,地处江苏省东南部,长江口北岸,东濒黄海、背依苏北平原,与沪、苏、锡隔江相望,呈濒江临海“半岛型”的港城格局,被誉为“江湖门户”和“北上海”。地处长三角核心区,区位优势显著,尤其是苏通长江公路大桥建成后,南通将进入上海1 h经济圈。近年来,南通市注重经济增长提质增量,土地利用陆海统筹,空间扩展江海联动,社会经济水平显著提高。2012年,全市GDP高达4 558.7亿元,比上年增长11.8%;全年财政收入1 055.9亿元,比上年增长27.1%。经济增长快速,产业结构优化,2012年的三次产业结构为7.0:53.0:40.0,工业经济仍为GDP的构成主体[20]。
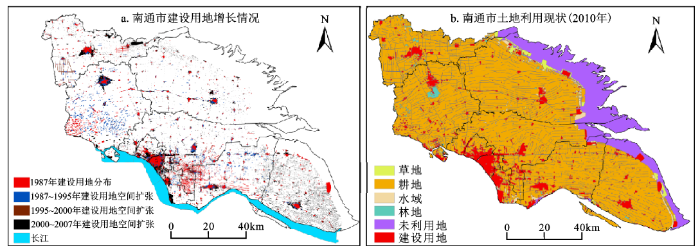
南通土地利用数据来源于中国环境保护部环境卫星的遥感监测中心基于Landsat TM获取的土地利用/覆盖数据,以及基于中巴地球资源卫星(CBERS)新建立的2010年土地利用/覆盖数据(图1)。自然基础数据中的耕地质量、地质灾害、重要生态区与路网等数据来自对南通市发改委、国土局、港务局等单位的实地调研。水系、河网数据来自中科院南京地理所湖泊流域数据集成与模拟中心。社会经济数据来自历年统计年鉴。为研究方便,将自然属性信息借助ArcGIS10.1软件进行空间化处理,转化为点位数据、栅格数据与ASCII码数据。
图1 南通市建设用地增长情况(a)和土地利用现状(b)
Fig.1 construction land growth (a) and Land use map in 2010 (b) in Nantong
建设用地空间扩张过程受到自然条件、社会经济发展、生态环境约束等多重因素的综合作用,本文运用CLUE-S模型来对其扩张进行空间模拟,模型可由非空间模块和空间模块组成[21, 22]。
非空间模块:作为单独输入到模型中的模块,不受空间环境的影响。通过对建设用地变化起驱动作用的非空间因素的分析,测算各类型土地利用的需求。由于南通市在不同时期受到人文经济、国土政策与城市发展战略的影响,建设用地具有时空差异和突变特征。为此,采用系统动力学模型(System Dynamics,SD),一种以反馈控制理论为基础,以计算机仿真技术为手段,研究复杂社会经济系统的定量方法[23,24]。
空间模块:根据影响因子计算空间单元的概率,通过概率大小对建设用地进行空间分配,实现建设用地动态模拟。借助CLUE-S模型进行建设用地扩张的空间影响分析、区域发展情境与空间布局动态模拟。
1) 空间影响分析:对建设用地扩张的空间影
响分析运用改进的Auto-logistic模型,由Besag于1972年首先提出[23],是在传统Logistic回归模型基础之上以空间权重的形式引入自相关因子,解决了空间统计分析中固有的自相关影响。为引入空间自相关因子,将时空点(X,T)处的土地利用类型出现的条件概率定义为驱动因素和一个表示空间自相关性的虚拟变量的函数形式。如果用集合
式中:X代表由一系列影响因素构成的向量;wij代表空间权重值;yi代表事件的状态,为值变量。其中空间权重函数wij的选择可以根据实际情况自行确定。Tobler的地理学第一定律指出:空间数据的相关性揭示了一种自然分布模式,即2个靠近点的属性值比2个分离点的属性值具有更大的相关性[25]。因此,取权重函数为点对间距离的倒数,即如果空间点对i、j的距离以Dij表示,空间权重函数表示为:
式(2)中,空间权重函数可以运用OpenGeoDa软件计算得到。
2) 区域发展情景分析:旨在描述和分析事物发展的各种可能性,对比不同发展路径下的状态,为决策提供依据和宏观背景,是开展建设用地模拟的基础。考虑南通建设用地的生产适宜性、常住人口的空间集聚与固定资产投资强度,设定建设用地利用系统变化主要参数,确定3种不同情景(表1)。
表1 不同扩张情景下主要指标的预测
Table 1 The predication of the main indexes in different scenarios
| 情景设置 | 指标 | 2015年 | 2020年 | 2025年 |
|---|---|---|---|---|
| 基准情景 | 常住人口(万人) | 784.5 | 798.3 | 806.4 |
| 城镇化率(%) | 60 | 66 | 70 | |
| 固定资产投资(亿元) | 4712.4 | 7085.9 | 9708.3 | |
| GDP总量(亿元) | 5972.6 | 8775.7 | 11743.8 | |
| 经济发展 情景 | 常住人口(万人) | 796.3 | 816.4 | 830.8 |
| 城镇化率(%) | 62 | 70 | 75 | |
| 固定资产投资(亿元) | 5389.1 | 9163.1 | 14424.8 | |
| GDP总量(亿元) | 6527.8 | 10276.3 | 14753 | |
| 生态保护 情景 | 常住人口(万人) | 776.7 | 784.5 | 786.5 |
| 城镇化率(%) | 58 | 64 | 68 | |
| 固定资产投资(亿元) | 4280.6 | 6003.7 | 7662.5 | |
| GDP总量(亿元) | 5581.5 | 8013 | 10723.1 |
① 基准情景:此情景是针对实地调研资料而设计的情景方案。各参数的设置主要参考南通市经济发展的实际,较好地反映了其土地利用的实际情况(目标控制的设置参考《南通市城市总体规划(2011~2020)》,而2025年的目标控制参考《南通市城市总体规划修编(2015~2030)》)。② 经济发展情景:此情景优先保障城镇工矿与旅游休闲产业发展的用地,满足高效农业发展下的农业结构调整的用地需求,保持经济快速发展。未来10~20 a,将是南通市工业发展与转型升级、城镇化进程的关键时期。政府要扶持当地支柱产业,加大固定资产投资力度,提高产业发展层次。此情景下SD模型中有利于经济发展的参量将被适当提高。③ 生态保护情景:此情景根据南通市对生态环境保护的限制性要求,满足生态用地需求,保护自然环境。严格限制林地、草地等生态用地向其他用地类型转换,积极实施退耕还林工程,控制固定资产投资,提倡集约高效发展。
最后,空间布局动态模拟:是整个模块的核心部分。利用统计分析模块输出不同情景下土地利用时空格局与自然本底条件、社会经济因素之间的相互作用关系,根据需求模块确定的土地利用变化目标,预测各因素的变化特征,在空间上对建设用地进行动态分配与优化布局。
景观格局的生态效应可以通过格局分析解释其蕴含的生态意义,景观异质性是判断生态系统稳定性和安全性的重要标志[26,27]。借鉴相关研究[28~30],斑块尺度上的破碎度(FN)、斑块密度(PD)、景观形状指数(LSI)、分维度(FD)包含斑块数量、大小、周长、面积等信息,表示结构上的破碎程度和形状规则的程度;景观尺度上的蔓延度指数(CONTAG)、散布与并列指数(IJI)、香农多样性指数(SHDI)和香农均度指数(SHEI)包含团聚延展、相邻、多样性、均度等信息,功能上反映斑块之间的组合程度和稳定程度。本文选用以上8种景观格局指数评价建设用地扩张的景观生态效应,利用Fragstats 4.2软件计算。
依据模型结构,实现步骤如下:① 基于南通市建设用地变化的时空信息,分析建设用地扩张的时空格局特征与驱动机制,挖掘先验知识规则,设置未来建设用地增长的情景方案;② 针对不同时段受到自然本底条件、社会经济发展以及生态环境保护等的相关因素与政策的影响,运用SD模型对南通市建设用地增长进行分析,以2010年为起始时点,测算南通2015年、2020年、2025年3个节点年份不同情景下的建设用地面积;③ 建立研究区480 m×480 m格网系统,生成用地空间比例数据,在南通城市面积总量控制下转化为(0,1)空间网格数据。识别影响城市增长的空间因素,选择距离城市中心,距离海岸带距离,一般公路、高速公路、铁路的距离以及长江与其他主要河流距离等指标生成480 m×480 m格网;④ 应用Auto-logistic模型分析不同影响因素下各单元建设用地分布概率,CLUE-S模型根据建设用地在空间上发生转变的概率最大的位置,完成空间分布模拟;⑤ 测算不同情景下建设用地扩张的景观生态效应。
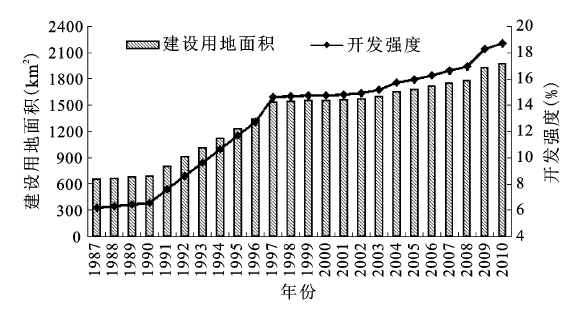
根据TM遥感影像解译结果,1987年以来,南通市建设用地面积快速增长,从1987年的648.6 km2增长到2010年的1 972.3 km2,土地开发强度从6.16%升至18.70%,20多年内,扩张了3倍多。建设用地增长在不同时段呈现显著的变化,其中1987~1990年,年均增速仅有0.13%,开发强度增至6.56%。1991~1997年,建设用地的扩展速度最快,年均增长1.17%,开发强度在1997年迅速增至14.61%。1998~2003年,由于国家土地利用政策收紧,严控建设用地指标投放,制止建设用地无序蔓延和低效利用,城市扩张缓慢,但2004年后,由于城镇化和工业化加速进行,为支撑经济增长和大量人口向城市集聚,增速较前一阶段加快,至2010年,建设用地面积增至1 972.3 km2,开发强度也相应达到18.70%(图2)。
图2 南通市建设用地面积与土地开发强度
Fig.2 Construction land area and development intensity in Nantong
南通市建设用地增长的主要特征:① 建设用地扩张剧烈,表现为原有城区和乡镇中心的急剧蔓延,村庄建设用地呈“串珠状”布局,交通建设用地迅速扩张。② 建设用地扩张呈现“轴线增长-内部填充”交替的周期性波动态势。经济起飞初期,建设用地利用为追求交通可达性和经济效益最大化,多沿主干道路沿线和经济增长走廊扩张;经济发展至一定阶段后,因后备土地不足、用地供给紧张与土地政策约束等因素,多以填充式扩张为主。③ 不同阶段建设用地变化呈现非线性增长的特点,受经济发展周期与工业化、城镇化等多重因素影响,尤其是国家宏观层面的土地利用政策(如建设用地的“增减挂钩”和耕地利用的“占补平衡”)与城市发展战略的影响深远。
应用基期年建设用地现状数据推演未来城市增长情况,将模拟结果与真实变化情况进行比较,应用Kappa系数与模拟正确率(PCM)来进行精度评价[10]。结果(表2)显示PCM的平均精度为60.19%,Kappa系数值也达到0.61,说明模拟结果较好。其中,由于本文以2010年作为未来建设用地扩张模拟的基础,所以2010年的模拟效果最好,PCM精度达到67.31%,Kappa系数为0.68,模拟效果较为理想,可将构建的复合模型应用于建设用地空间扩张的模拟。
表2 不同时间节点建设用地增长空间模拟精度
Table 2 Analysis of simulatedprecision of construction land in different time points
| 节点年份 | 1987 | 1995 | 2000 | 2010 | 平均 |
|---|---|---|---|---|---|
| PCM | 58.12% | 53.16% | 62.15% | 67.31% | 60.19% |
| Kappa | 0.58 | 0.52 | 0.64 | 0.68 | 0.61 |
根据城市建设用地预测与增长潜力模拟2015年、2020年、2025年在基准情景、经济发展情景、生态保护情景下的城市建设用地扩张的空间格局。依据上文情景设置,以及社会、经济、生态环境等方面主要控制指标目标值的设置,运用SD模型预测不同情景下建设用地扩张的面积(表3)。
表3 不同情景下建设用地扩张的面积(km2)
Table 3 The areas of construction land expansion under different scenarios(km2)
| 情景设置 | 2015年 | 2020年 | 2025年 |
|---|---|---|---|
| 基准情景 | 2051.8 | 2131.0 | 2175.3 |
| 经济发展情景 | 2095.1 | 2212.2 | 2301.9 |
| 生态保护情景 | 2030.7 | 2072.9 | 2109.9 |
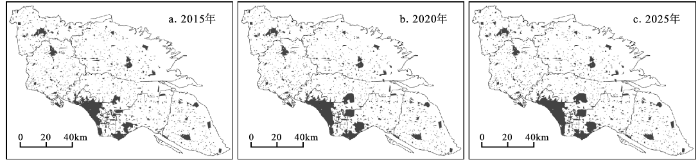
① 基准情景:2015年、2020年、2025年的建设用地面积分别为2 051.9 km2、2 131.0 km2、2 175.3 km2(表3)。2011~2025年中建设用地需求面积的总量持续增加,但由于经济发展的转型升级、生态环境约束的加强,建设用地的扩张在不断降低。模拟结果显示,在2010~2015年、2015~2020年、2020~2025年3个时段,建设用地分别增加79.6 km2、79.1 km2与44.3 km2。建设用地扩张空间集中分布在城市建成区周边、长江以及道路网沿线(图3)。
图3 基准情景下建设用地空间分布模拟
Fig.3 Simulated result of future construction land based on baseline scenario
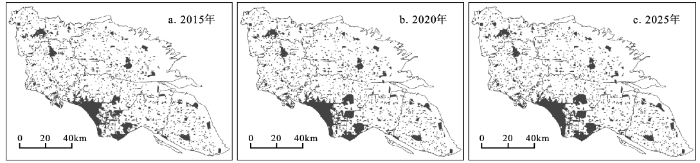
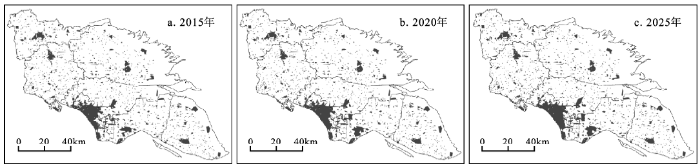
② 经济发展情景:通过SD模型预测建设用地于2015年、2020年、2025年的扩张面积分别为2 095.1 km2、2 212.2 km2与2 301.9 km2(表3),与基准情景相比,经济发展情景关键约束指标设置侧重满足经济发展对建设用地的需求,生态指标的设置相对宽松。在2010~2015年、2015~2020年、2020~2025年3个时段内,建设用地增长分别高达122.8 km2、117.1 km2与89.7 km2。在空间扩张模拟中,除在原有城区外围扩张外,还呈现向东部沿海滩涂扩展的趋势,对生态系统稳定性产生严重压力。同时,在新的工业园区、城镇工矿集中区周围的建设用地扩张也较为显著(图4)。
图4 经济发展情景下建设用地空间分布模拟
Fig.4 Simulated result of future construction land based on scenario of economic development
③ 生态保护情景:在2015年、2020年、2025年3个时间节点中建设用地分别增加至2 030.7 km2、2 072.9 km2与2 109.9 km2(表3)。建设用地需求总量不断增加,但由于生态环境的关键约束指标数值设置较为严格,在2010~2015年、2015~2020年、2020~2025年3个时间段内只增长了58.4 km2、42.2 km2与37 km2。空间模拟中,建设用地的扩张仍然出现集中连片的趋势,主要分布在西南部的城区、海门及启东等地,但面积均较小,扩张速度在一定程度上得到控制(图5)。
图5 生态保护情景下建设用地空间分布模拟
Fig.5 Simulated results of future construction land based on scenario of ecological conservation
情景模拟在景观格局上生态效应的差异,能够成为决策者选择未来发展模式的重要依据。因此,本文在斑块尺度与景观尺度上分析城市建设用地格局变化所产生的景观生态效应,揭示其蕴含的重要生态意义。
斑块尺度上,不同时期建设用地的景观格局指数差异较大。各情景下建设用地空间分布的破碎度(FN)、斑块密度(PD)和景观形状指数(LSI)都相对较高,分维度(FD)小,形状复杂,是景观脆弱性的主要来源,而且景观格局趋于不稳定(表4)。在2015年、2020年、2025年,对比不同情景下的城市建设用地景观格局可以发现,随着扩张面积的持续增加,基准情景与经济发展情景下的破碎化程度均较高。按照目前的发展趋势,在以经济增长为未来发展导向的情况下,建设用地数量需求和空间管制措施,并不能有效制约人类活动为主导的建设用地面积增长与空间扩展对城市景观格局所造成的潜在影响。受南通市实际土地利用类型,以及域内95%以上的耕地被划为基本农田保护区的限制,土地利用规划中变更使用性质程序复杂,未来建设用地扩张的主要方向放在了对沿海滩涂的大面积围垦,通过建设用地指标置换来满足城市发展的用地需求。与此对应,生态保护情景下的建设用地破碎度相对较低,斑块密度下降,分维度提高,对城市生态环境与景观格局的影响最小,是未来建设用地扩张需要引导的方向。
表4 南通市不同情景下斑块尺度景观指数比较
Table 4 Landscape indices based on class-level in different scenarios in Nantong
| 年份 | 指标 | 基准情景 | 经济发展情景 | 生态保护情景 |
|---|---|---|---|---|
| 2015 | FN | 0.114 | 0.228 | 0.116 |
| PD | 0.446 | 0.459 | 0.421 | |
| LSI | 52.435 | 53.436 | 48.866 | |
| FD | 1.019 | 1.020 | 1.019 | |
| 2020 | FN | 0.105 | 0.182 | 0.112 |
| PD | 0.455 | 0.470 | 0.434 | |
| LSI | 50.344 | 52.102 | 47.644 | |
| FD | 1.023 | 1.026 | 1.019 | |
| 2025 | FN | 0.103 | 0.178 | 0.109 |
| PD | 0.462 | 0.482 | 0.441 | |
| LSI | 48.345 | 50.827 | 46.215 | |
| FD | 1.024 | 1.029 | 1.021 |
景观尺度上(表5),经济发展情景下蔓延度指数(CONTAG)最大,这与建设用地扩张的空间模拟结果相对应,扩张的建设用地主要分布城镇、工矿周边,集中连片趋势明显。生态保护情景下的散布与并列指数(IJI)、香农多样性指数(SHDI)和香农均度指数(SHEI)达到最大,表明在斑块之间组合程度合理,景观格局具有最大的多样性和最均匀的分布格局。基准情景下的建设用地扩张的景观生态效应指标介于其余2种情景之间,比较符合预期。
表5 南通市不同情景下景观尺度的景观指数比较
Table 5 Landscape indices based on landscape-level in different scenarios in Nantong
| 年份 | 指标 | 基准情景 | 经济发展情景 | 生态保护情景 |
|---|---|---|---|---|
| 2015 | CONTAG | 47.763 | 52.398 | 49.623 |
| IJI | 75.094 | 69.897 | 76.126 | |
| SHDI | 0.989 | 0.857 | 0.882 | |
| SHEI | 0.615 | 0.532 | 0.548 | |
| 2020 | CONTAG | 50.325 | 54.157 | 52.243 |
| IJI | 72.033 | 65.872 | 73.192 | |
| SHDI | 0.909 | 0.828 | 0.853 | |
| SHEI | 0.615 | 0.532 | 0.548 | |
| 2025 | CONTAG | 51.135 | 57.237 | 55.570 |
| IJI | 69.054 | 62.715 | 71.125 | |
| SHDI | 0.889 | 0.826 | 0.855 | |
| SHEI | 0.584 | 0.503 | 0.529 |
总体上,在城市经济发展与生态环境保护之间,建设用地面积扩展与空间分布的结果对南通市景观生态效应的影响显现出两种不同的方向,未来城镇化的稳步推进、产业经济发展与生态环境保护之间需要寻找平衡点,实现景观空间结构的合理布局,降低各种不稳定性和风险,使城市发展具有可持续性。此外,在南通市土地利用层面,景观生态的稳定还依赖于建设用地、农用地和生态用地景观的合理组合,多样性的用地格局能保证建设用地不因自然或人类环境的不稳定而造成对生态环境不可逆的破坏。
本文以南通市为例,集成CLUE-S模型与Auto-logistic回归模型构建建设用地扩张增长动态分布模型,模拟在基准、经济发展、生态保护等情景下的建设用地空间扩张,通过景观格局指数对比分析不同情景模式下的景观生态效应。研究表明:
1) 1987年以来,南通市建设用地扩张剧烈,空间上主要是城区和乡镇中心快速蔓延。不同阶段城市建设用地变化呈现非线性增长,具有“轴线增长-内部填充”交替的周期性波动态势。建设用地扩张在不同时段呈现时空差异性与突变特征,在空间格局上与各因素的欧几里德距离呈现高度的动态相关性。
2) 应用基期年南通土地利用现状数据推演模拟未来城市增长情况,将模拟结果与真实变化情况进行比较,Kappa与PCM系数显示模拟效果较好。通过SD模型与CLUE-S模型对南通市建设用地扩张进行预测与模拟,基准情景下2015年、2020年、2025年的预测结果为2 051.8 km2、2 131.0 km2与2 175.3 km2;经济发展情景的结果为2 095.1 km2、2 212.2 km2与2 301.9 km2;生态保护情景的结果为2 030.7 km、2 072.9 km2与 2 109.9 km2。空间扩张分配集中于城镇周边,其中在经济发展情景下建设用地还有向东部沿海滩涂扩展的趋势。
3) 建设用地空间扩张的斑块密度和景观形状指数均较高,景观格局趋于不稳定,破碎化相对严重,与当前南通市建设用地“满天星”式的空间格局相吻合,是未来土地整治需重点解决的问题。
本文运用CLUE-S模型进行情景模拟中,在因子选取、地图修饰、空间分析等方面还有一些不足。首先,提高模拟的精度,挖掘CLUE-S模型的工具价值是研究的方向,而在与其他模型耦合的选择、模型“平衡”假设的验证以及土地利用变化的过程3个方面,还需对CLUE-S模型开展研究;再者,加强建设用地的“空间尺度”分析,探究不同尺度对合理土地开发强度的作用方向。同时,在进行景观生态效应分析时,虽从斑块尺度和景观尺度分析景观结构、破碎度与异质性的变化,而在选择哪些景观指标能有效指示景观格局特征,是需进一步思考的问题,以便为城市生态建设与景观格局优化提供参考。
The authors have declared that no competing interests exist.
| [1] |
Land allocation to meet sectoral goals in Indonesia-An analysis of policy coherence [J].https://doi.org/10.1016/j.landusepol.2016.11.033 URL [本文引用: 1] 摘要
Land is a scarce resource affecting the implementation of many sectoral policies. In Indonesia, the expansion of palm oil plantations has led to non-sustainable land use practices in past years, particularly deforestation. More recently, the government has set ambitious targets for the adoption of biodiesel which will require expansion of oil palm plantations, thus putting further pressure on land. Meanwhile, the need to guarantee food supply, forest conservation and climate change mitigation also imply challenges when it comes to land allocation and use. This paper examines the role that land plays in the implementation of sectoral policies in Indonesia, exploring the availability of land to satisfy the multiple goals defined in national policies. We explore land competition resulting from allocations made in official policy documents starting with biofuel policy. The analysis of policy goals and coherence when it comes to land allocation is made in relation to agriculture, climate and forestry policies. We conclude that adjustments need to be made in the policies to avoid overlappings and misinterpretations when it comes to land allocation. The area made available for meeting each sectoral policy goal when taking into account cross sectoral interactions is: 14.2 Mha for agriculture, 43 Mha for climate mitigation measures, 9.2 Mha for forestry, and 20.9 Mha for biofuels. A more uniform land classification and development of a common reference database will increase transparency on land allocation and use, and help to monitor land use change, ultimately supporting the achievement of multiple national goals.
|
| [2] |
Social and institutional factors associated with land use and forest conservation along two urban gradients in Massachusetts [J].https://doi.org/10.1016/j.landurbplan.2011.03.012 Magsci [本文引用: 1] 摘要
With the rate of suburban development now surpassing the amount of land protected nationally for conservation, the act of preserving land from development becomes a crucial need to support critical ecosystem services and human quality of life. While previous studies have quantified the loss of forest lands and open spaces along urban gradients, rarely have they quantified the connections between land use policies, actions and land use change. We examined social and institutional factors positively influencing land conservation efforts across two urban gradients in Massachusetts, one surrounding the large, economically growing city of Boston and the other surrounding the smaller, economically depressed city of Springfield. Despite their differences, the metropolitan areas of these two cities are both growing rapidly. We measured forest and open space protection for a sample of 15 towns, comparing this with quantitative assessments of town-level open space policies, investment in conservation planning, wealth, and social capital, in the form of local land trusts. We found significant differences between the two urban gradients, with greater land protection occurring in the Boston area towns. The towns with the largest proportion of protected land were at the urban end of both gradients. We found that land trusts played a significant role in the conservation of open spaces, and wealthier towns were more likely to have long-standing, active land trusts. This result suggests that fostering land trusts in lower-income communities could have a lasting positive impact on land conservation in the face of rapid suburbanization. (C) 2011 Elsevier B.V. All rights reserved.
|
| [3] |
Sustainable urban form for Chinese compact cities:Challenges of a rapid urbanized economy [J].https://doi.org/10.1016/j.habitatint.2007.06.005 URL Magsci [本文引用: 1] 摘要
Land saving in the process of rapid urbanization is critical to the long-term sustainability of China. Compact cities, characterized by relative high density, mixed land-use and pedestrian-oriented habitation, have been proposed as one solution for sustainable urban planning. However, given the fact that Chinese cities are characterized by high population densities, the applicability of a more compact solution to expanding cities in China remains questionable. Essential to the decision-making is a deeper understanding about the relationship between urban compactness and the sustainable performance of the cities. This study is proposed for a quantitative evaluation about the costs and benefits of cities’ compaction in Chinese context from environmental perspective, especially with respect to “facility availability, infrastructure efficiency, public transport, domestic energy and resources consumption and environmental externalities.” 45 core Chinese cities are selected for the detailed illustration.
|
| [4] |
The environmental impact of suburbanization [J]. |
| [5] |
我国的城镇化进程与空间扩张 [J].https://doi.org/10.3969/j.issn.1000-3363.2007.04.006 URL [本文引用: 1] 摘要
城镇化是一个国家经济结构、社会结构和生产方式、生活方式的根本性转变,涉及到产业的转型和新产业的成长、城乡的社会结构的全面调整以及庞大的基础设施的建设、资源、环境的支撑以及大量的立法、管理、国民素质提高等方面,它必然是长期的积累和长期发展的渐进式过程。
Urbaniation process and spatial sprawl in China .https://doi.org/10.3969/j.issn.1000-3363.2007.04.006 URL [本文引用: 1] 摘要
城镇化是一个国家经济结构、社会结构和生产方式、生活方式的根本性转变,涉及到产业的转型和新产业的成长、城乡的社会结构的全面调整以及庞大的基础设施的建设、资源、环境的支撑以及大量的立法、管理、国民素质提高等方面,它必然是长期的积累和长期发展的渐进式过程。
|
| [6] |
Performance evaluation of the SLEUTH model in the shenyang metropolitan area of northeastern China [J].https://doi.org/10.1007/s10666-008-9154-6 URL [本文引用: 1] 摘要
Performance evaluation is crucial for the development and improvement of an urban cellular automata model, such as SLEUTH. In this paper, we employed multiple methods for map comparison and model validation to evaluate the simulation performance of the SLEUTH urban growth model in the Shenyang metropolitan area of China. These multiple methods included the relative operating characteristic (ROC) curve statistic, multiple-resolutions error budget, and landscape metrics. They were used to quantitatively examine model performance in terms of the amount and spatial location of urban development, urban spatial pattern and prediction ability. The assessment results showed that SLEUTH performed well in the way of the quantitative simulation of urban growth for this case study. Similar to other urban growth models, however, the simulation accuracy for spatial location of new development at the pixel scale and urban spatial pattern still needs to be improved greatly. These inaccuracies might be attributed to the structure and nature of SLEUTH, local urban development characteristics, and the temporal and spatial scale of its application. Finally, many valuable suggestions had been put forward to improve simulation performance of SLEUTH model for spatial location of urban development in the Shenyang metropolitan area.
|
| [7] |
Urban expansion in contemporary China:What can we learn from a small town? [J].https://doi.org/10.1016/j.landusepol.2009.10.010 URL Magsci 摘要
Rapid physical expansion of urban land use is widely observed in Chinese cities. Although there is a consensus that economic liberalization and decentralization of administrative responsibilities explain the urban changes, it is not clear whether or not actual economic and population growth is the only cause of urban expansion. By using a small town as a case study, this paper shows that urban expansion is a combined outcome of actual needs, planning preparations, profit-seeking, and more importantly, the approach used by local government to achieve economic ambitions. Findings show that local economic and demographic changes do contribute to land-use expansion, but a local development approach that uses urban expansion to improve the competitive edge of the locality plays a critical role. A pro-growth coalition consisting of top local government officials, state work-unit leaders, and developers, whose interests align for short-term gain in economic and political terms, guarantee the mobilization of resources for carrying out the rapid urban expansion, and a vision of the local economic success. These findings add in a new dimension that is not yet seen in the study of China's urban expansion.
|
| [8] |
The urban growth, size distribution and spatio-temporal dynamic pattern of the Yangtze River Delta megalopolitan region, China [J].https://doi.org/10.1016/j.ecolmodel.2010.09.036 URL [本文引用: 1] 摘要
As one of the six megalopolitan regions in the world, the Yangtze River Delta is one of the most populated and developed regions of China. The spatial and temporal dynamic pattern of the urbanization process of the megalopolitan region is investigated. This work compared the spatial and temporal dynamic pattern of the urban growth for the five urban areas (Shanghai, Nanjing, Suzhou, Wuxi and Changzhou) in this region. During the 15 years, urban growth patterns were dramatically uneven over three 5-year periods. The size distribution of the five urban areas became more even with the rapid urbanization process. The patterns of urban expansion reflected policy adjustment and economic development throughout the time. Landscape metric analysis across concentric buffer zones was conducted to elucidate the area, shape, size, complexity and configuration of urban expansion. The study indicates the coalescence process occurred during the rapid urban growth from 1990 to 1995 and the moderate growth period from 2000 to 2005, but different urban growth period between 1995 and 2000. The urban growth pattern was coalesced for the Nanjing and Wuxi metropolitan areas and diffused for Shanghai, Suzhou and Changzhou. This approach indicates that the coalescence process was the major growth model for this region in the recent 15 years despite their different size, economic growth and population growth. The diffusion-coalesce dichotomy represent endpoints rather than alternate states of urban growth. This work will be beneficial in understanding the size distribution and urbanization process of the megalopolitan region in China.
|
| [9] |
基于遗传支持向量机的城市扩张非线性组合模型 [J].
<p>在分析当前城市扩张模拟模型优缺点的基础上,利用支持向量机能有效表达、拟合复杂非线性系统的功能,将多个单项城市扩张模型进行非线性组合,有机融合各单项模型优点,最后构建支持向量机的城市空间扩张非线性组合模拟模型。利用遗传算法优化支持向量机的参数,减小参数设置不合理对支持向量机建模精度引起的影响,有效提高支持向量机模型精度。通过分析组合模型误差和各参与组合的单项模型之间的关系,总结出提高支持向量机的城市扩张非线性组合模型精度的方法是:① 提高参与组合的各单项模型精度;② 增加单项模型之间的差异性。以长沙市为例,分别构建多元回归、GM(1,8)、BP网络和LS-SVM单项城市空间扩张模拟模型,并在此基础上建立线性组合城市扩张模型和遗传支持向量机非线性组合城市扩张模型。通过各模型精度对比分析证明,遗传支持向量机的城市扩张非线性组合模型精度远优于各单项模型,并且优于线性组合模型,是一种有效的城市扩张新模型。</p>
A nonlinear polynomial model for urban expansion incorporating genetic algorithm and support vector machines .
<p>在分析当前城市扩张模拟模型优缺点的基础上,利用支持向量机能有效表达、拟合复杂非线性系统的功能,将多个单项城市扩张模型进行非线性组合,有机融合各单项模型优点,最后构建支持向量机的城市空间扩张非线性组合模拟模型。利用遗传算法优化支持向量机的参数,减小参数设置不合理对支持向量机建模精度引起的影响,有效提高支持向量机模型精度。通过分析组合模型误差和各参与组合的单项模型之间的关系,总结出提高支持向量机的城市扩张非线性组合模型精度的方法是:① 提高参与组合的各单项模型精度;② 增加单项模型之间的差异性。以长沙市为例,分别构建多元回归、GM(1,8)、BP网络和LS-SVM单项城市空间扩张模拟模型,并在此基础上建立线性组合城市扩张模型和遗传支持向量机非线性组合城市扩张模型。通过各模型精度对比分析证明,遗传支持向量机的城市扩张非线性组合模型精度远优于各单项模型,并且优于线性组合模型,是一种有效的城市扩张新模型。</p>
|
| [10] |
区域尺度城市增长时空动态模型及其应用 [J].https://doi.org/10.11821/xb201102004 URL Magsci [本文引用: 2] 摘要
区域尺度城市增长动态模拟(Reg-UGM) 是城市化影响下的土地利用/覆盖变化以及全球 环境变化研究的重要手段之一。针对单个城市增长未来情景模拟难以在区域尺度刻画与解释 城市化影响下的土地利用/覆盖变化以及与全球环境变化交互过程与作用机理主要问题,本研 究集成人工神经网络模型(ANN) 与元胞自动机模型(CA) 构建适合不同情景的区域尺度城市 增长动态模型,通过1979 年以来高分辨率遥感信息探测获取的4 个时段京津唐都市圈城市增 长时空特征分析提取先验知识规则,模拟京津唐都市圈在基准模式、经济模式、政策模式与 结构调整模式未来不同情景模式下城市增长过程。研究表明,Reg-UGM在模拟区域尺度受国 家宏观政策等影响城市非线性增长过程具有较好的可靠性,为进一步研究城市化影响下的宏 观生态效应提供前提保障。模拟结果显示京津唐都市圈在不同情景模式下城市增长呈现较大 的时空格局差异,未来城市增长结构调整模式更符合区域城市化的实际情况,未来区域城市 增长将由特大城市向中小城市转移,滨海沿线城镇发展带将经历更快的城市增长过程。
Dynamic urban growth model at regional scale and its application .https://doi.org/10.11821/xb201102004 URL Magsci [本文引用: 2] 摘要
区域尺度城市增长动态模拟(Reg-UGM) 是城市化影响下的土地利用/覆盖变化以及全球 环境变化研究的重要手段之一。针对单个城市增长未来情景模拟难以在区域尺度刻画与解释 城市化影响下的土地利用/覆盖变化以及与全球环境变化交互过程与作用机理主要问题,本研 究集成人工神经网络模型(ANN) 与元胞自动机模型(CA) 构建适合不同情景的区域尺度城市 增长动态模型,通过1979 年以来高分辨率遥感信息探测获取的4 个时段京津唐都市圈城市增 长时空特征分析提取先验知识规则,模拟京津唐都市圈在基准模式、经济模式、政策模式与 结构调整模式未来不同情景模式下城市增长过程。研究表明,Reg-UGM在模拟区域尺度受国 家宏观政策等影响城市非线性增长过程具有较好的可靠性,为进一步研究城市化影响下的宏 观生态效应提供前提保障。模拟结果显示京津唐都市圈在不同情景模式下城市增长呈现较大 的时空格局差异,未来城市增长结构调整模式更符合区域城市化的实际情况,未来区域城市 增长将由特大城市向中小城市转移,滨海沿线城镇发展带将经历更快的城市增长过程。
|
| [11] |
基于主体功能区规划的中国城乡建设用地扩张时空特征遥感分析 [J].Remote sensing-based analysis of the spatiotemporal characteristics of built-up area across China based on the plan for major function-oriented zones . |
| [12] |
多智能体城市土地扩张模型及其应用 [J].https://doi.org/10.3321/j.issn:0375-5444.2008.08.008 URL Magsci [本文引用: 1] 摘要
传统的城市土地扩张模型多为静态模型,无法呈现空间上每一时间点的土地利用状况,以元胞自动机(Cellular Automata)模型为代表的新型城市土地扩张模型虽然具有动态特性,但其无法描述影响城市土地扩张的智能体(Agent)之间所产生的多元变化结果。以多智能体系统(Multi-Agent System)理论为基础,建立城市土地资源时间和空间配置规则,构建了动态且能描述影响城市土地扩张的智能体(Agent)间互动关系的城市土地扩张模型,并以长沙市区为例,应用所构建之模型进行了城市土地扩张的实证分析。结果表明:该模型可以反映城市土地扩张的基本特征和规律,对于解释城市土地扩张的成因、理解智能体行为对城市土地扩张过程的影响是合适的。并且将模拟结果与遥感土地利用解译结果对比,1998年、2001年、2005年城市土地扩张模拟的点对点精度均达到68%以上,从而能够为政府和城市规划者制定用地政策提供辅助决策支持。
Urban land expansion model based on multi-agent system and application .https://doi.org/10.3321/j.issn:0375-5444.2008.08.008 URL Magsci [本文引用: 1] 摘要
传统的城市土地扩张模型多为静态模型,无法呈现空间上每一时间点的土地利用状况,以元胞自动机(Cellular Automata)模型为代表的新型城市土地扩张模型虽然具有动态特性,但其无法描述影响城市土地扩张的智能体(Agent)之间所产生的多元变化结果。以多智能体系统(Multi-Agent System)理论为基础,建立城市土地资源时间和空间配置规则,构建了动态且能描述影响城市土地扩张的智能体(Agent)间互动关系的城市土地扩张模型,并以长沙市区为例,应用所构建之模型进行了城市土地扩张的实证分析。结果表明:该模型可以反映城市土地扩张的基本特征和规律,对于解释城市土地扩张的成因、理解智能体行为对城市土地扩张过程的影响是合适的。并且将模拟结果与遥感土地利用解译结果对比,1998年、2001年、2005年城市土地扩张模拟的点对点精度均达到68%以上,从而能够为政府和城市规划者制定用地政策提供辅助决策支持。
|
| [13] |
多智能体与元胞自动机结合及城市用地扩张模拟 [J].https://doi.org/10.3969/j.issn.1000-0690.2007.04.015 URL Magsci [本文引用: 1] 摘要
运用多智能体(Agent)和元胞自动机(CA)结合来模拟城市用地扩张的方法,将影响和决定用地类型转变的主体作为Agent引进元胞自动机模型中,Agent在CA确定的城市发展概率的基础上,通过自身及其周围环境的状况,综合各种因素的影响做出决策,决定元胞下一时刻的城市发展概率。运用Agent的决策结果,对CA模型中以随机变量体现的不确定性通过Agent决策行为给予地理意义的新解释。以城市郊区—樟木头镇为例,对1988~1993年城市用地扩张进行了模拟研究,取得了良好的模拟效果。
Integration of multi-agent systems with cellular automata for simulating urban land expansion .https://doi.org/10.3969/j.issn.1000-0690.2007.04.015 URL Magsci [本文引用: 1] 摘要
运用多智能体(Agent)和元胞自动机(CA)结合来模拟城市用地扩张的方法,将影响和决定用地类型转变的主体作为Agent引进元胞自动机模型中,Agent在CA确定的城市发展概率的基础上,通过自身及其周围环境的状况,综合各种因素的影响做出决策,决定元胞下一时刻的城市发展概率。运用Agent的决策结果,对CA模型中以随机变量体现的不确定性通过Agent决策行为给予地理意义的新解释。以城市郊区—樟木头镇为例,对1988~1993年城市用地扩张进行了模拟研究,取得了良好的模拟效果。
|
| [14] |
基于误差反馈控制的变系数城市扩张模型构建及应用 [J].
<p>通过模拟结果与实际情况的误差分析,将研究区划分为4 种像元类型,包括漏算误差像元(Omission Error,OE)、超算误差像元(Commission Error,CE)、正确模拟的城市像元(Urban Correct,UC)及正确模拟的非城市像元(Non-urban Correct,NUC)。利用线性规划方法,将误差反馈到城市扩张模型中,动态修正模型系数,构建基于误差反馈控制的变系数城市扩张空间布局模型反映城市扩张的内在特征,最后以北京市为例,模拟了其1997~2009 年的城市扩张过程,通过与传统Logistic-CA 模型的模拟结果对比,验证变系数模型的有效性与实用性。研究结果表明:传统Logistic-CA 模型在2001 年、2005年和2009 年的模拟精度分别为73.842%、64.704 %和63.953%,而基于误差反馈控制的变系数城市扩张模型的模拟精度分别为75.624%、66.537%和69.142%,较Logistic-CA回归模型提高了1.782、1.833 和5.189 个百分点,取得了更好的模拟效果。</p>
The variable-coefficient urban growth model based on the error feedback control [J].
<p>通过模拟结果与实际情况的误差分析,将研究区划分为4 种像元类型,包括漏算误差像元(Omission Error,OE)、超算误差像元(Commission Error,CE)、正确模拟的城市像元(Urban Correct,UC)及正确模拟的非城市像元(Non-urban Correct,NUC)。利用线性规划方法,将误差反馈到城市扩张模型中,动态修正模型系数,构建基于误差反馈控制的变系数城市扩张空间布局模型反映城市扩张的内在特征,最后以北京市为例,模拟了其1997~2009 年的城市扩张过程,通过与传统Logistic-CA 模型的模拟结果对比,验证变系数模型的有效性与实用性。研究结果表明:传统Logistic-CA 模型在2001 年、2005年和2009 年的模拟精度分别为73.842%、64.704 %和63.953%,而基于误差反馈控制的变系数城市扩张模型的模拟精度分别为75.624%、66.537%和69.142%,较Logistic-CA回归模型提高了1.782、1.833 和5.189 个百分点,取得了更好的模拟效果。</p>
|
| [15] |
城市建设系统的动力学模型研究 [J].https://doi.org/10.3969/j.issn.1002-9753.2004.11.026 URL 摘要
本文以复杂系统论和系统动力学为指导,从宏观和微观两个角度综合考虑,给出了城市建设系统的动力学模型,以探寻城市建设过程中的基本规律,促进城市建设同社会经济的协调发展和城市建设模式的进一步合理化,为城市建设质量的提高提供支持。
Study of the city construction system using system dynamics models .https://doi.org/10.3969/j.issn.1002-9753.2004.11.026 URL 摘要
本文以复杂系统论和系统动力学为指导,从宏观和微观两个角度综合考虑,给出了城市建设系统的动力学模型,以探寻城市建设过程中的基本规律,促进城市建设同社会经济的协调发展和城市建设模式的进一步合理化,为城市建设质量的提高提供支持。
|
| [16] |
Construction area expansion in relation to economic-demographic development and land resource in the Pearl River Delta of China [J].https://doi.org/10.1007/s11442-016-1262-7 URL Magsci 摘要
Since 1979, the Pearl River Delta (PRD) of China has experienced rapid socioeconomic development along with a fast expansion of construction area. Affected by both natural and human factors, a complex interdependency is found among the regional changes in construction area, GDP and population. A quantitative analysis of the four phases of the regional land use data extracted from remote sensing images and socioeconomic statistics spanning 1979 to 2009 demonstrates that the proportion of construction area in the PRD increased from 0.5% in 1979 to 10.8% in 2009, accompanied with a rapid loss of agricultural land. An increase of one million residents was associated with an increase of GDP of approximately 32 billion yuan before 2000 and approximately 162 billion yuan after 2000. Because the expansion of construction area has approached the limits of land resource in some cities of the PRD, a power function is found more suitable than a linear one in describing the relationship between GDP and construction area. Consequently, the Logistic model is shown to provide more accurate predictions of population growth than the Malthus model, particularly in some cities where a very large proportion of land resource has been urbanized, such as Shenzhen and Dongguan.
|
| [17] |
Support vector machines for urban growth modeling [J].https://doi.org/10.1007/s10707-009-0077-4 URL [本文引用: 1] 摘要
This paper presents a novel method to model urban land use conversion using support vector machines (SVMs), a new generation of machine learning algorithms used in the classification and regression domains. This method derives the relationship between rural-urban land use change and various factors, such as population, distance to road and facilities, and surrounding land use. Our study showed that SVMs are an effective approach to estimating the land use conversion model, owing to their ability to model non-linear relationships, good generalization performance, and achievement of a global and unique optimum. The rural-urban land use conversions of New Castle County, Delaware between 1984–1992, 1992–1997, and 1997–2002 were used as a case study to demonstrate the applicability of SVMs to urban expansion modeling. The performance of SVMs was also compared with a commonly used binomial logistic regression (BLR) model, and the results, in terms of the overall modeling accuracy and McNamara’s test, consistently corroborated the better performance of SVMs.
|
| [18] |
CLUE-S模型的改进与土地利用变化动态模拟——以张家界市永定区为例 [J].
<p>区域土地利用变化模拟是LUCC研究的核心内容之一。以地处湘西北岩溶山区的张家界市永定区为研究对象,针对目前国际上广泛使用的CLUE-S土地利用变化模型,通过在传统Logistic回归模型中引入空间自相关变量,对CLUE-S模型的空间分析模块进行了改进。实验与分析结果表明,改进的空间分析模块拟合优度、拟合精度都有较大的提高。耕地、林地及居民点工矿用地的拟合优度(ROC值)分别从0.784、0.821和0.741提高到0.827、0.875和0.838。在此基础之上,采用改进的CLUE-S模型,模拟和预测了研究地区2005~2020年的土地利用时空变化。研究结果说明对CLUE-S模型空间分析模块的改进在一定意义上是合理的,同时也可以为永定区及其相似地区的土地利用规划决策提供更为科学的依据。</p>
Dynamic simulation of land use change based on the improved CLUE-S model: A case study of Yongding County,Zhangjiajie .
<p>区域土地利用变化模拟是LUCC研究的核心内容之一。以地处湘西北岩溶山区的张家界市永定区为研究对象,针对目前国际上广泛使用的CLUE-S土地利用变化模型,通过在传统Logistic回归模型中引入空间自相关变量,对CLUE-S模型的空间分析模块进行了改进。实验与分析结果表明,改进的空间分析模块拟合优度、拟合精度都有较大的提高。耕地、林地及居民点工矿用地的拟合优度(ROC值)分别从0.784、0.821和0.741提高到0.827、0.875和0.838。在此基础之上,采用改进的CLUE-S模型,模拟和预测了研究地区2005~2020年的土地利用时空变化。研究结果说明对CLUE-S模型空间分析模块的改进在一定意义上是合理的,同时也可以为永定区及其相似地区的土地利用规划决策提供更为科学的依据。</p>
|
| [19] |
基于Logistic回归的沿海经济区建设用地演变驱动因素研究——以大连市新市区为例 [J].
沿海经济区空间演变与其产业经济的可持续发展紧密相关,探索用地演变的驱动机制,对区域未来发展具有重要意义。以临港产业高度集聚发展的典型沿海经济区——大连市新市区为例,基于TM遥感影像和DEM空间数据,通过随机选取2 000个采样点,构建了描述用地空间演变过程的Logistic回归模型,分析了沿海经济区土地利用变化过程的空间变量,重点研究驱动因素构成,各因素参与程度、影响效果和作用,各时段因素间的关联性及传导性等内容。研究发现,在1990~2010年的20 a间,大连市新市区建设用地面积增加了近30倍,其空间驱动变量除了包含与城市CBD、邻近区县、乡镇中心的距离外,还与到主要港区、沿海岸线、邻近临港工业区距离等因素密切相关,这一系列城镇空间分布与港口相关变量构成了用地空间演变的驱动因素体系,共同塑造了沿海经济区的空间格局。文章所建空间模型通过Logistic回归检验,能够较好地揭示沿海经济区空间演变的主要驱动因素及其作用机理,为相关研究提供了新的思路和方法。
Driving factor analysis of construction land changes in coastal economic zone based on logistic regression:a case study of Dalian new urban .
沿海经济区空间演变与其产业经济的可持续发展紧密相关,探索用地演变的驱动机制,对区域未来发展具有重要意义。以临港产业高度集聚发展的典型沿海经济区——大连市新市区为例,基于TM遥感影像和DEM空间数据,通过随机选取2 000个采样点,构建了描述用地空间演变过程的Logistic回归模型,分析了沿海经济区土地利用变化过程的空间变量,重点研究驱动因素构成,各因素参与程度、影响效果和作用,各时段因素间的关联性及传导性等内容。研究发现,在1990~2010年的20 a间,大连市新市区建设用地面积增加了近30倍,其空间驱动变量除了包含与城市CBD、邻近区县、乡镇中心的距离外,还与到主要港区、沿海岸线、邻近临港工业区距离等因素密切相关,这一系列城镇空间分布与港口相关变量构成了用地空间演变的驱动因素体系,共同塑造了沿海经济区的空间格局。文章所建空间模型通过Logistic回归检验,能够较好地揭示沿海经济区空间演变的主要驱动因素及其作用机理,为相关研究提供了新的思路和方法。
|
| [20] |
|
| [21] |
Clue-cr:an integrated multi-scale model to simulate land use change scenarios in Costa Rica [J].https://doi.org/10.1016/0304-3800(95)00158-1 URL [本文引用: 1] 摘要
A dynamic geo-referenced land use/cover model ( clue-cr ) which simulates simultaneous local, regional and national land use/cover changes in Costa Rica is presented and discussed. clue-cr simulates the effects of changing demographical and biophysical driving forces on land use/cover change in Costa Rica, including feedbacks from land use/cover to those forces. The multi-scale aspect of the model allows the simulation of realistic system dynamics related to the interaction of top-down and bottom-up effects and constraints. As a model clue may be implemented for other countries and has the potential to be scaled down and/or up to link with regional land use models or integrated global change models.
|
| [22] |
南京市区建设用地扩张模式、功能演化与机理 [J].https://doi.org/10.11821/dlyj201410010 URL Magsci [本文引用: 1] 摘要
以南京市区不同时段遥感影像为基础,在综合凸壳方法与公共边方法基础上,通过矩阵分析对1985-2007年南京市区建设用地扩张模式进行划分,探讨不同扩张模式的空间结构特征。结果表明:1 1985年以来,南京市区建设用地扩张迅速。其中,填充扩张由主城区逐渐向外推移,飞地扩张分散在远离主城区的开发区、工业园及大学城内,蔓延扩张则介于二者之间,多表现为前期扩张的继续发展。2功能上,填充扩张由居住主导向居住与工业混合转变;蔓延扩张由居住与工业混合向工业主导转变;飞地扩张一直以工业主导,并伴随科教的区域性集中。3驱动机理,填充与蔓延扩张属于收益驱动型,飞地扩张更多地受成本制约。随着城市空间向外拓展,建设用地扩张的成本约束作用均逐渐加强;而城市建设用地中工业用地比重的增加,又使三种扩张模式的收益驱动作用加强。
Patterns, functions and underlying mechanisms of urban land expansion in Nanjing .https://doi.org/10.11821/dlyj201410010 URL Magsci [本文引用: 1] 摘要
以南京市区不同时段遥感影像为基础,在综合凸壳方法与公共边方法基础上,通过矩阵分析对1985-2007年南京市区建设用地扩张模式进行划分,探讨不同扩张模式的空间结构特征。结果表明:1 1985年以来,南京市区建设用地扩张迅速。其中,填充扩张由主城区逐渐向外推移,飞地扩张分散在远离主城区的开发区、工业园及大学城内,蔓延扩张则介于二者之间,多表现为前期扩张的继续发展。2功能上,填充扩张由居住主导向居住与工业混合转变;蔓延扩张由居住与工业混合向工业主导转变;飞地扩张一直以工业主导,并伴随科教的区域性集中。3驱动机理,填充与蔓延扩张属于收益驱动型,飞地扩张更多地受成本制约。随着城市空间向外拓展,建设用地扩张的成本约束作用均逐渐加强;而城市建设用地中工业用地比重的增加,又使三种扩张模式的收益驱动作用加强。
|
| [23] |
基于SD和CA的城镇土地扩展模拟模型——以江苏省南通地区为例 [J].https://doi.org/10.3969/j.issn.1000-0690.2009.03.022 URL Magsci [本文引用: 2] 摘要
充分利用系统动力学模型(System Dynamics,SD)在情景模拟和宏观因素反映上的优势和元胞自动机模型(Cellular Automata,CA)在微观土地利用空间格局反映上的优势,构建一个耦合SD和CA的城镇土地扩展模拟模型,并以江苏省南通地区为例,对模型的实证应用做了进一步的验证。结果表明,这种耦合模型不仅能够对研究区域未来城镇土地扩展数量给予一个比较好的预测,而且还对其空间分布效果做了一定精度上的模拟,这使得城市规划在土地利用预测方面有一个相对科学的依据。
Urban land expansion simulation model based on SD and CA—a case study of Nantong city .https://doi.org/10.3969/j.issn.1000-0690.2009.03.022 URL Magsci [本文引用: 2] 摘要
充分利用系统动力学模型(System Dynamics,SD)在情景模拟和宏观因素反映上的优势和元胞自动机模型(Cellular Automata,CA)在微观土地利用空间格局反映上的优势,构建一个耦合SD和CA的城镇土地扩展模拟模型,并以江苏省南通地区为例,对模型的实证应用做了进一步的验证。结果表明,这种耦合模型不仅能够对研究区域未来城镇土地扩展数量给予一个比较好的预测,而且还对其空间分布效果做了一定精度上的模拟,这使得城市规划在土地利用预测方面有一个相对科学的依据。
|
| [24] |
An autologistic model for the spatial distribution of wildlife [J]. |
| [25] |
modeling the spatial pattern of land-use change with GEOMOD2:application and validation for Costa Rica [J].https://doi.org/10.1016/S0167-8809(01)00183-9 URL [本文引用: 1] 摘要
The objective of this paper is to simulate the location of land-use change, specifically forest disturbance, in Costa Rica over several decades. This paper presents a GIS-based model, GEOMOD2, which quantifies factors associated with land-use, and simulates the spatial pattern of land-use forward and backward in time. GEOMOD2 reads rasterized maps of land-use and other biogeophysical attributes to determine empirically the attributes of land that humans tend to use. Then GEOMOD2 uses the patterns of those biogeophysical attributes to simulate the spatial pattern of land-use change. GEOMOD2 can select locations for land-use change according to any of three decision rules based on (1) nearest neighbors, (2) stratification by political sub-region, and/or (3) the pattern of biogeophysical attributes. GEOMOD2 simulates the progressive loss of closed-canopy forest in Costa Rica for 1940, 1961 and 1983, which are the years for which maps of land-use are available. Also, GEOMOD2 extrapolates the pattern of land-use to the year 2010. When GEOMOD2 extrapolates land-use change over several decades, it is able to classify correctly between 74 and 88% of the grid cells, for two categories: forest versus non-forest. Over various simulation runs, Kappa ranges from 0.31 to 0.53. The model ability to predict the location of disturbance is best when the model is driven by the location of biogeophysical characteristics, most importantly lifezones.
|
| [26] |
景观空间分析的特征和主要内容 [J].https://doi.org/10.3321/j.issn:1000-0933.2002.07.024 URL Magsci [本文引用: 1] 摘要
在综合前人对景观空间格局与异质性,景观镶嵌动态,尺度、格局、过程相关等景观生态学基本原理的基础上,初步提出了景观空间分析的框架,认为:景观空间分析主要包括景观空间形态分析、空间关系分析与空间构型分析,并对景观空间分析的特征及与一般空间分析之间的关系进行了探讨.
The characteristics and contents of landscape spatial analysis .https://doi.org/10.3321/j.issn:1000-0933.2002.07.024 URL Magsci [本文引用: 1] 摘要
在综合前人对景观空间格局与异质性,景观镶嵌动态,尺度、格局、过程相关等景观生态学基本原理的基础上,初步提出了景观空间分析的框架,认为:景观空间分析主要包括景观空间形态分析、空间关系分析与空间构型分析,并对景观空间分析的特征及与一般空间分析之间的关系进行了探讨.
|
| [27] |
三峡库区生态屏障区土地利用规划生态效应评估 [J].
<p>以地处三峡库区腹心地带的重庆市云阳县为例,基于土地利用多功能性,以Costanza等的生态系统服务价值测算方法及谢高地等制定的生态服务价值系数为基础,构建不同土地利用类型生态服务价值修正系数,从生态系统服务价值以及景观格局视角定量估算三峡库区生态屏障区土地利用规划生态效应.结果表明,以土地生态功能建设为导向的土地利用规划能够快速提升生态屏障区生态系统服务价值,增强屏障区调节气候、保持土壤、维护生物多样性等方面能力,云阳县三峡库区生态屏障区生态系统服务总价值从2010年的15.53亿元提升到2020年的19.98亿元,年均变化率达到2.87%;至2020年云阳县三峡库区生态屏障区初步构建一个以"林地为骨架,耕地、园地、草地为补充"的生态系统服务格局;同时,云阳县三峡库区生态屏障区生态系统服务价值及其调节服务和支持服务价值表现出显著地空间分异特征,其中磨刀溪流域生态系统服务价值提升幅度最大,澎溪河流域次之,长江沿岸生态服务系统价值保持稳定增长,而长滩河流域变化不大.</p>
Evaluation of ecological effects in land use planning:a case study of ecological barrier zone of three gorges reservoir area .
<p>以地处三峡库区腹心地带的重庆市云阳县为例,基于土地利用多功能性,以Costanza等的生态系统服务价值测算方法及谢高地等制定的生态服务价值系数为基础,构建不同土地利用类型生态服务价值修正系数,从生态系统服务价值以及景观格局视角定量估算三峡库区生态屏障区土地利用规划生态效应.结果表明,以土地生态功能建设为导向的土地利用规划能够快速提升生态屏障区生态系统服务价值,增强屏障区调节气候、保持土壤、维护生物多样性等方面能力,云阳县三峡库区生态屏障区生态系统服务总价值从2010年的15.53亿元提升到2020年的19.98亿元,年均变化率达到2.87%;至2020年云阳县三峡库区生态屏障区初步构建一个以"林地为骨架,耕地、园地、草地为补充"的生态系统服务格局;同时,云阳县三峡库区生态屏障区生态系统服务价值及其调节服务和支持服务价值表现出显著地空间分异特征,其中磨刀溪流域生态系统服务价值提升幅度最大,澎溪河流域次之,长江沿岸生态服务系统价值保持稳定增长,而长滩河流域变化不大.</p>
|
| [28] |
Landscape metrics for assessment of landscape destruction and rehabilitation [J].https://doi.org/10.1007/s002670010136 URL PMID: 11083911 Magsci [本文引用: 1] 摘要
Abstract This investigation tested the usefulness of geometry-based landscape metrics for monitoring landscapes in a heavily disturbed environment. Research was carried out in a 75 sq km study area in Saxony, eastern Germany, where the landscape has been affected by surface mining and agricultural intensification. Landscape metrics were calculated from digital maps (1912, 1944, 1973, 1989) for the entire study area and for subregions (river valleys, plains), which were defined using the original geology and topography of the region. Correlation and factor analyses were used to select a set of landscape metrics suitable for landscape monitoring. Little land-use change occurred in the first half of the century, but political decisions and technological developments led to considerable change later. Metrics showed a similar pattern with almost no change between 1912 and 1944, but dramatic changes after 1944. Nonparametric statistical methods were used to test whether metrics differed between river valleys and plains. Significant differences in the metrics for these regions were found in the early maps (1912, 1944), but these differences were not significant in 1973 or 1989. These findings indicate that anthropogenic influences created a more home geneous landscape.
|
| [29] |
黄河三角洲地区人类活动对景观结构的影响分析——以山东省东营市为例 [J].
景观生态学是研究由不同生态系统所组成的景观的空间结构、相互作用、功能及动态变化。研究人类活动的区域差异对景观结构的影响,探讨人类活动的强弱对生物生境和资源分布格局的干扰,成为景观生态学研究的一个重要方面。本文以我国黄河三角洲地区东营市为研究区域,通过选取景观多样性、优势度、景观破碎度和景观分离度作为评价指标,分析了该区人类活动和景观结构之间的关系。研究表明,人类活动对景观结构具有显著的影响,主要表现在:1)人类活动对景观多样性有较为明显的影响,随着人类活动的加强,景观多样性降低。2)人类活动的强度与景观的破碎度成正比关系,随着人类活动的加强,景观越破碎,其破碎度的值越大,人类活动越弱,景观破碎度的值越小。3)景观分离度与人类活动的关系较为复杂,表现为两个方面,与人类活动密切相关的景观类型,如耕地和居民点及工矿用地,景观的分离度与人类活动强度成反比关系,对于那些受人类影响遗留下的自然或半自然景观类型,如:草地、水域、盐碱地及荒地,景观的分离度和人类活动成正比关系。
Analysis of impact of human activity on and scape structure in Yellow River delta-a case study of Dongying region .
景观生态学是研究由不同生态系统所组成的景观的空间结构、相互作用、功能及动态变化。研究人类活动的区域差异对景观结构的影响,探讨人类活动的强弱对生物生境和资源分布格局的干扰,成为景观生态学研究的一个重要方面。本文以我国黄河三角洲地区东营市为研究区域,通过选取景观多样性、优势度、景观破碎度和景观分离度作为评价指标,分析了该区人类活动和景观结构之间的关系。研究表明,人类活动对景观结构具有显著的影响,主要表现在:1)人类活动对景观多样性有较为明显的影响,随着人类活动的加强,景观多样性降低。2)人类活动的强度与景观的破碎度成正比关系,随着人类活动的加强,景观越破碎,其破碎度的值越大,人类活动越弱,景观破碎度的值越小。3)景观分离度与人类活动的关系较为复杂,表现为两个方面,与人类活动密切相关的景观类型,如耕地和居民点及工矿用地,景观的分离度与人类活动强度成反比关系,对于那些受人类影响遗留下的自然或半自然景观类型,如:草地、水域、盐碱地及荒地,景观的分离度和人类活动成正比关系。
|
| [30] |
Using neural networks and GIS to forecast land use changes:a Land Transformation Model [J].https://doi.org/10.1016/S0198-9715(01)00015-1 URL [本文引用: 1] 摘要
The Land Transformation Model (LTM), which couples geographic information systems (GIS) with artificial neural networks (ANNs) to forecast land use changes, is presented here. A variety of social, political, and environmental factors contribute to the model's predictor variables of land use change. This paper presents a version of the LTM parameterized for Michigan's Grand Traverse Bay Watershed and explores how factors such as roads, highways, residential streets, rivers, Great Lakes coastlines, recreational facilities, inland lakes, agricultural density, and quality of views can influence urbanization patterns in this coastal watershed. ANNs are used to learn the patterns of development in the region and test the predictive capacity of the model, while GIS is used to develop the spatial, predictor drivers and perform spatial analysis on the results. The predictive ability of the model improved at larger scales when assessed using a moving scalable window metric. Finally, the individual contribution of each predictor variable was examined and shown to vary across spatial scales. At the smallest scales, quality views were the strongest predictor variable. We interpreted the multi-scale influences of land use change, illustrating the relative influences of site (e.g. quality of views, residential streets) and situation (e.g. highways and county roads) variables at different scales.
|

/
| 〈 |
|
〉 |