李净 , 刘红兵
, 刘红兵
Li Jing, Liu Hongbing
中图分类号: TP79
文献标识码: A
文章编号: 1000-0690(2017)04-0620-10
收稿日期: 2016-04-29
修回日期: 2016-10-10
网络出版日期: 2017-04-25
版权声明: 2017 《地理科学》编辑部 本文是开放获取期刊文献,在以下情况下可以自由使用:学术研究、学术交流、科研教学等,但不允许用于商业目的.
基金资助:
作者简介:
作者简介:李净(1978-),女,甘肃会宁人,博士,副教授。主要从事复杂地形下定量遥感研究。E-mail: Li-jinger@nwnu.edu.cn
展开
摘要
基于全球库存建模与绘图研究第三代归一化差值植被指数(GIMMS 3g NDVI)、土地利用和气温降水数据,利用NDVI时间序列谐波分析法(HANTS)重构了中国北部地区原始植被NDVI,用一元六次多项式拟合了植被生长曲线并结合逐像元动态阈值法提取了中国北部地区1983~2012年植被生长季始期并分析了其时空变化及对气温和降水的响应情况。结果表明:①GIMMS 3g NDVI具有较长的时序特征和较好的数据质量,经HANTS时间序列谐波分析后能很好的表现植被生长季曲线特征,可用于后续植被生长季的研究。② 北部地区生长季始期均值主要集中分布在80~150βd之间,全区30βa平均为111.6βd,东北平原、华北平原、河套平原、新疆天山和阿尔泰地区生长季始期早于其它区域。③ 研究时段内北部地区生长季始期总体上呈提前趋势(R2=0.19),空间上由西北向东北逐渐推移,明显提前的区域主要分布在内蒙古中东部、东北平原、陕西南部和新疆天山的部分地区,明显推迟的区域主要分布在青藏高原高寒地区。④ 因植被类型的不同和区域的差异,生长季始期对气温和降水的响应程度不同,春季气温是影响生长季始期变化的主要自然因素。
关键词:
Abstract
Based on GIMMS 3g NDVI, landuse, temperature, precipitation and vegetation type data, the paper fitted the current year vegetation growing season curve and extracted the yearly green-up day of vegetation growing season in northern China in recent 30 years (from 1983 to 2012), analyzed its spatio-temporal changes and also the relationship between temperature and precipitation. In order to meet the actual vegetation growth, we used harmonic analysis of time-series method to reconstruct vegetation NDVI, dynamic threshold and a sixpolynomial fitting method. Some conclusions were as follows. 1) With longer time-series features and better data quality, GIMMS 3g NDVI data with time-series harmonic data analysis was very good to fit and show the actual characteristics of vegetation growing season curve in northern China and can be well used to further study of vegetation growing season in the future. 2) During the study period, green-up day of vegetation growing season mainly distributed from 80 days to 150 days, and the regional averaged value reached 111.6 days.Green-up day of vegetation growing season in regions such as northeast Plain, north China Plain, Hetao Plain, Tianshan, the Altai were earlier. 3) Green-up day of vegetation growing season in northern China showed an advanced tend in general and gradually transitioned from the northwest to the northeast. The significantly advanced regions mainly distributed in the eastern of Inner Mongolia, northeast China Plain, southern Shanxi and the Tianshan Mountains of Xinjiang section area, while the significantly delayed regions were in Qinghai-Tibet Plateau alpine regions. 4) Due to various vegetation types and regional differences and so on,green-up day of vegetation growing season responded to temperature and precipitation distinctly and temperature was the main factor that affecting green-up day of vegetation growing season changes.
Keywords:
受全球气候变暖的影响,北半球植被活动显著增强[1]。在此背景下,1951~2009年中国平均气温上升了1.38°C,变暖速率达到0.23°C/10a[2]。植被作为陆地生态系统对气候变化的响应和反馈的重要指示,已成为区域乃至全球生态环境领域研究的热点[3]。植被物候可以敏感地反映气候变化,气候变化反过来可以影响植被物候期。传统的植被物候研究通常采用野外目视观察法,该方法通过定点观测,简单易行,但费时费力,不易开展长期、区域尺度的研究[4]。由于NDVI(归一化植被指数)能够在大范围覆盖区域内精确地反映植被生长季和光合作用强度、植被代谢强度及其季节性和年际间变化,因而基于NDVI时序数据的遥感方法已成为目前监测植物物候最常用的手段[5]。
目前,大多数学者基于GIMMS AVHRR NDVI[6~9],中分辨率成像光谱仪归一化差值植被指数(MODIS NDVI)[10]和地球观测系统归一化差值植被指数(SPOT Vegetation)[11]单一数据集来研究植被物候期的变化。由于单一数据源时间序列较短,从而大部分对植被生长季始期变化趋势的研究都集中在10~20 a之间,时间序列短则很难准确反映植被生长季总体上的变化趋势。也有学者[12,13]将多个单一数据源结合起来,构建长时间序列数据集,但由于不同传感器来源数据之间分辨率和数据质量差异较大,导致结果误差较大。GIMMS 3g NDVI是目前描述植被随时间变化最好的数据集之一[14],也是到目前为止时序最长的植被数据集(1981~2013年)。因此,本文在前人研究的基础上,基于长时间序列的GIMMS 3g NDVI数据集,在考虑植被生长周期性和数据本身特点的前提下,引进NDVI时间序列谐波分析法(Harmonic Analysis of NDVI Time-Series,HANTS)对原始NDVI数据集进行重构,结合逐像元动态阈值法来研究中国北部地区近30βa以来植被生长季始期时的空变化特征,并分析生长季始期时空变化与气温和降水的关系,从而得出在全球变暖的前提下植被物候与气候的响应关系。
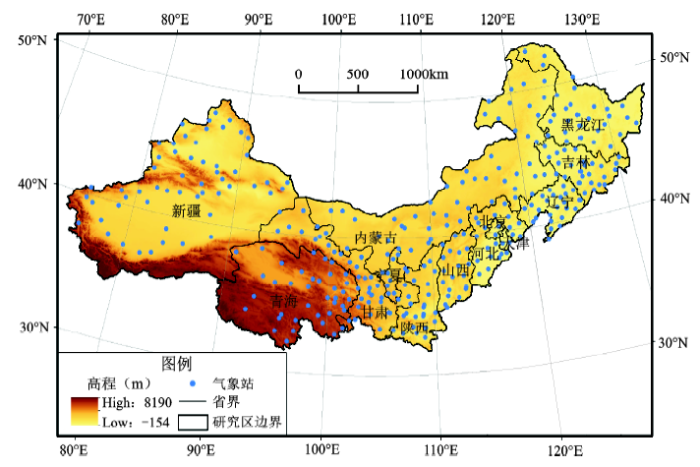
本文的研究区为中国东北、华北和西北三大区域,范围在73°E~136°E,31°N ~54°N之间,行政区划上包括黑龙江、辽宁、吉林、北京、天津、山西、河北、内蒙古、甘肃、陕西、青海、宁夏和新疆13个省(市或自治区)(图1)。该区域内有高(山)原、平原、盆地,自东向西依次为湿润气候区,亚湿润气候区,亚干旱气候区,干旱气候区。植被主要包括东北半湿润森林/森林草原和西北干旱/半干旱荒漠和草原2个大区,分布着森林、农田、草地和灌丛等植被,受人为的干扰相对南部较小,季节特征明显。同时,该地区大面积区域处于从草原到沙漠的过渡地带,生态环境脆弱,极易发生土地退化和荒漠化。
2.1.1 GIMMS 3g NDVI数据
GIMMS(Global Inventory Modeling and Mapping Studies)NDVI数据是搭载在NOAA卫星上的AVHRR传感器获取的植被产品,在全球及区域大尺度植被活动变化研究中广泛使用[15]。GIMMS 3g NDVI来自于ECOCAST网站(http://ecocast.arc.nasa.gov),空间分辨率为0.083 3°,时间分辨率为15βd,该数据集已经过校正,最小程度的太阳高度角、传感器误差和偏移等的影响,可用于反映植被的长时间序列变化[16]。
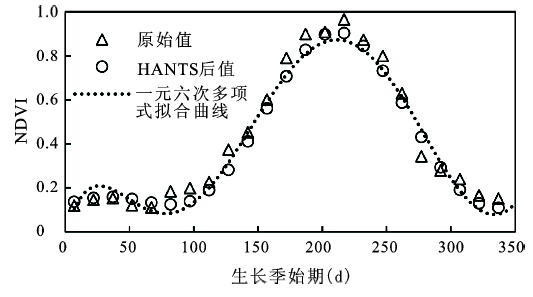
由于GIMMS 3g NDVI数据时间分辨率及植被物候本身的特性,必须进行重构。目前,国内外学者已经提出了多种时间系列重建的算法,主要有最佳指数斜率提取方法[17]、Savitzky-Golay滤波方法[18]、时间窗内的线性内插[19]等。NDVI时间序列谐波分析法,综合了平滑和滤波2种方法,不仅能够充分利用影像的时空特性,还充分考虑了植被自然的生长周期和数据本身的双重特点,真实反映植被的周期性变化规律[20]。图2为青藏高原高寒草地单个像元处原始NDVI、经HANTS重构和一元六次多项式拟合的曲线效果。
图2 青藏高原高寒草地单个像元HANTS分析及六次多项式拟合曲线
Fig.2 HANTS analysis and six polynomial fitting curve of single pixel of alpine grassland in Qinghai-Tibet Plateau
2.1.2 气温降水数据
月均温和月降水量数据来源于中国气象科学数据共享网(http://cdc.cma.gov.cn),由于部分气象站点观测资料不连续、新增、搬迁等因素,导致研究时段内各个年份站点数目不一,为了保证插值精度,本文以计算年份已有的站点数目为准,利用ArcGIS 10.2提供的克里金(Kriging)插值方法得到了具有与NDVI数据相同空间分辨率的北部地区春季(3月、4月和5月份)气温和降水空间连续数据。
2.1.3 土地利用和植被分区数据
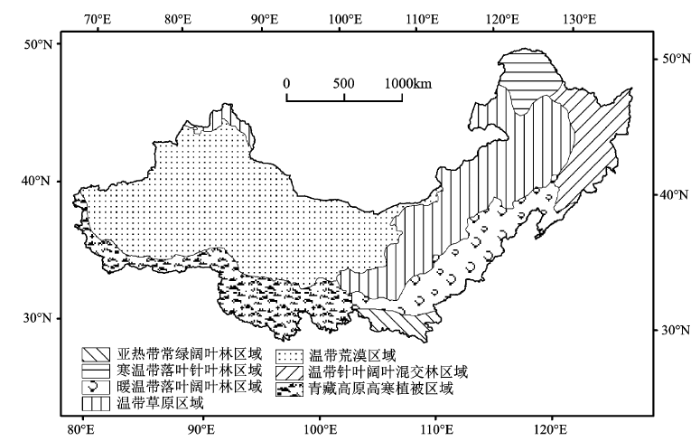
土地利用数据为Global Land Cover 2000栅格数据集,来源于地理空间数据云(http://www.gscloud.cn),空间分辨率为1βkm,该数据集总体分类精度最高,为了研究的需要及保留原始分类值,采用最近邻法将其重采样为与NDVI数据对应的空间分辨率。植被分区数据为ArcGIS 10.2数字化1:1 000 000中华人民共和国植被图得到的.shp数据(图3)。
2.2.1 植被生长季始期参数提取
现有的物候提取方法主要有阈值法[21]、曲线拟合法[22]、移动平均法[23]、累计频率法[24]和最大斜率法[5]等,也有学者利用遥感数据对已有的模型进行了改进[25]。阈值法是较早出现的一种方法,比较简单,但受限于土地覆盖类型、土壤背景等,因此本文在HANTS时间序列谐波分析和传统阈值法的基础上,经逐像元计算,将变化率最大处对应的NDVI值确定为生长季始期阈值,计算公式如下:
式中,NDVIratio(t)是t时刻NDVI的变化率,t为某一时刻,t+1为下一时刻,间隔15 d。
一元n次多项式常用来描述北部温带和高纬度地区时序NDVI生长季模式。何月等[26]等将生长季分为上升和下降的2部分,用一元二次多项式分段进行拟合,考虑到生长季曲线的连续性,本文使用一元六次多项式来拟合整个植被生长季曲线,公式如下:
式中,x为生长季始期,范围应在2~9月之间,超出该范围的视为无效值或者非植被像元,予以剔除;NDVI为(1)式中计算的第x天对应的阈值,a0~an为拟合参数。图2为青藏高原某一典型像元处一年的谐波分析与多项式拟合效果。
上述方法虽然提取了物候期,但依然存在着非植被信息(如水体和裸岩等)的影响,因此本文结合重采样后的LUCC土地利用数据对提取结果做进一步的处理。
2.2.2 一元线性回归模型
一元线性回归模型可以模拟空间上每个像元的植被生长季始期的时间变化,斜率(Slope)表示生长季始期变化的趋势,用最小二乘法来计算,公式如下:
式中,n为累积年数,本文为30;Pi为第i年的生长季始期;Slope为一元线性回归方程的斜率,是n年连续年份的趋势,Slope>0说明生长季始期在n年间的变化趋势是推迟的,反之则是提前的。
2.2.3 Mann-Kendall突变检测方法
Mann-Kendall是一种非参数统计检验方法,具有样本不遵从某一特定分布,不受个别异常值干扰,能够客观地表征样本序列整体变化趋势等优点。在假设生长季序列没有变化的情况下,设此生长季序列为x1,x2,···,xN,mi表示第i个样本xi大于xj(1≤j≤i)的累计数,则可以定义一统计量:
在原序列随机独立等假定条件下,dk的均值和方差可分别表示为:
将dk标准化,则可表示为:
在假设原始序列随机独立的前提下,给定某一显著性水平a0,当a1<a0时,则拒绝原假设,它表示此序列将存在一个强的增长或减小趋势,所有U(dk)(1≤k≤N)将组成一条曲线UF。将此方法用到反序列中,则得到另一条曲线UB。如果曲线UF和UB的交叉点位于信度线之间,这个点便是突变的开始。
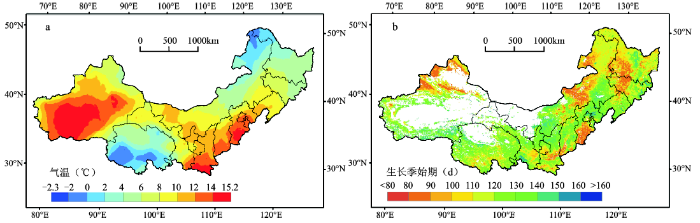
通过气象站点资料,采用ArcGIS 10.2空间分析中的克里金(Kriging)插值方法获得了30 a春季平均气温的空间分布(图3a)。可以看出,研究区内春季气温差异很大,平均气温为7.12℃,新疆塔里木盆地边缘、陕西南部和华北平原温度在10℃以上,而青藏高原和东北部分地区气温在0℃以下。
多年的平均生长季始期可以反映植被多年的平均生长模式,利用动态阈值和一元六次多项式拟合方法,逐个像元运算得到了北部地区1983~2012年植被平均生长季始期空间分布格局(图3)。北部大部分地区生长季始期均值主要集中分布在第80~150βd之间,全区30 a平均值为第111.6βd,这比王宏等[8]基于GIMMS NDVI(1982~1999年),用动态阈值法和滑动平均法提取的北方植被生长季始期早,比陈怀亮等[27]用最大斜率法计算的黄淮海地区1982~2000年生长季开始时间早,且由生长季始期较早的青海、甘肃、陕南地区向三大平原及新疆天山地区推移;不同区域,因植被类型和水热条件等的不同而呈现明显的空间差异:东北平原[主要植被为农作物,如水稻(Oryza sativa)、春小麦(Triticum aestivum)和玉米(Glycine max)和大豆(Zea mays)]、华北平原北部(河北省,分布着数量较多的水浇地和水田)、黄淮海地区、内蒙古呼伦贝尔大草原、锡林郭勒大草原、新疆天山和阿尔泰山(山地草原,寒温性针叶林),生长季始期在3月中旬前后;昆仑山脉、甘南玛曲湿地、太行山脉、小兴安岭和长白山脉等生长季始期在6月上旬之后。
对比图4a与b可以得出,在不考虑植被类型与下垫面的关系的情况下,生长季始期与春季气温具有一定的空间相关性,温度较高的地区生长季始期相对较早,反之则相对较晚。
图4 1983~2012年春季平均气温(a)和平均生长季始期(b)空间分布
Fig.4 Spatial distribution of annual average temperature(a) and green-up day(b) from 1983 to 2012
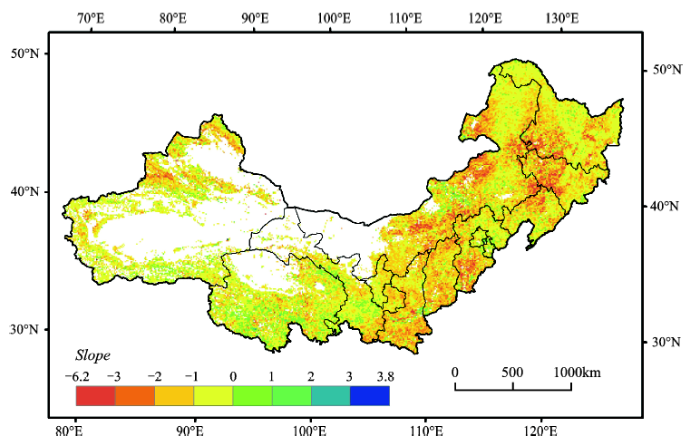
基于一元线性回归模型逐像元计算得到了1983~2012年北部地区生长季始期空间变化趋势(图5),可以得出,近30 a以来北部地区生长季始期整体上呈提前趋势(slope<0,占有效像元个数的70.18%);其中显著提前的区域主要分布在内蒙古中部、东北平原、陕西南部和新疆天山的部分地区,这与王宏等[8]短时间序列研究的结果一致;显著推迟的区域仅仅占了很少的像元,这与长时间序列气温和降水引起的生长季始期在空间上的推移和参与运算的有效像元个数有关。
图5 1983~2012生长季始期年际变化趋势
Fig.5 Change trend of annual green-up day from 1983 to 2012
以整个北部地区为研究对象,计算了年际平均生长季始期的变化情况,1983~2012年北部地区生长季始期整体上呈波动提前的趋势(R2=0.19),波动范围在14 d之内,最小值出现在1985年(为第115βd),最大值出现在1996年(为第129βd),这与Lucht W[28],Nezlin N P[4]对北半球寒带地区的研究由于全球变暖活动造成的植被活动增强,植被返青期提前的结论相符。考虑到研究尺度的问题本文将研究区分为七大植被区域(图3,图6)并参照生长季始期Mann-Kendall分析(图7)分别进行讨论。
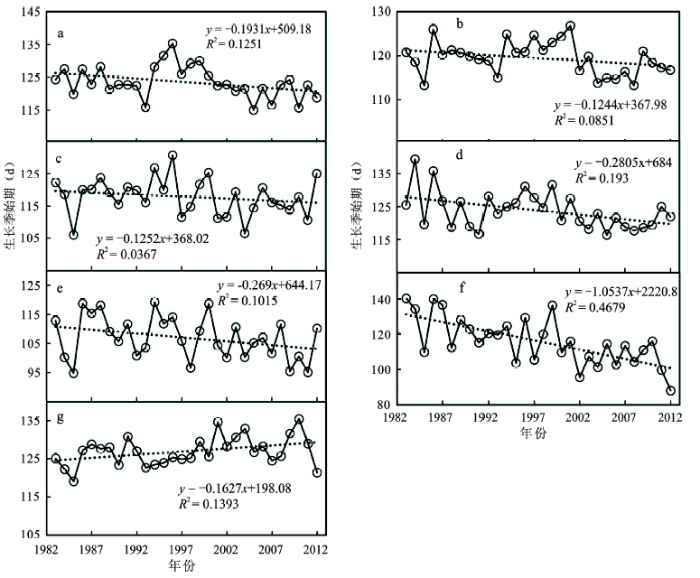
图6 七大植被区域1983~2012年际平均生长季始期变化
注:a.温带草原 b.温带荒漠 c. 温带针叶阔叶混交林 d.暖温带落叶阔叶林 e.寒温带落叶针叶林 f. 亚热带常绿阔叶林 g.青藏高原高寒植被。
Fig.6 Change of annual average green-up day in seven vegetation areas in 1983- 2012
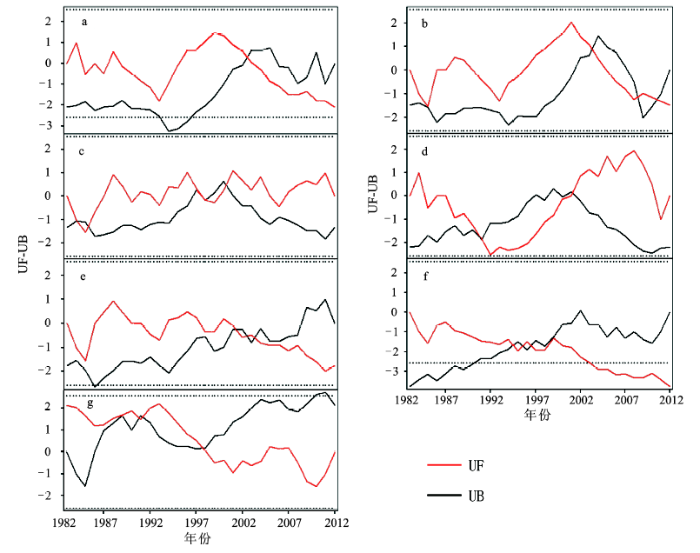
图7 七大植被区域Mann-Kendall统计量曲线
Fig.7 Mann-Kendall statistic curve of seven vegetation areas
温带草原区域(图6a),平均生长季始期为10a,在2004年前后有一个明显的转折点。温带荒漠区域(图6b)内植被相对稀少,平均生长季始期较为提前,为第119 d,呈提前趋势,速率为1.24βd/10a,该区域内常年雨水较少,降水对植被的影响较大,降水在2004年以后出现了较为明显的增多,使得生长季始期也有了一定程度的提前。温带针叶阔叶混交林区域(图6c)平均生长季始期为118 d,研究时段内呈提前趋势,速率为1.25βd/10a,突变发生在2004年前后。暖温带落叶阔叶林区域(图6d)平均生长季始期为124 d,研究时段内呈提前趋势,速率为2.81βd/10a,突变发生在2000年前后。寒温带落叶针叶林区域(图6e)地理位置位于中国最北端,包括大兴安岭等地区,平均生长季始期为107 d,明显早于其它区域。究其原因,该区域冬季雨雪较多,而且多为常绿林,春季冰雪消融是导致生长季始期较早的主要原因。由于研究时段温度不断上升,导致生长季始期呈提前趋势,在2002年出现了突变,速率为2.69βd/10a。亚热带常绿阔叶林区域(图6f),包括甘肃南部、陕西南部和秦岭地区[10],平均生长季始期为116 d,研究时段内呈提前趋势,速率为10.54βd/10a,突变发生在2002年前后。青藏高原高寒植被区域(图6g),本文在该区域的研究范围仅仅包括青海南部和昆仑山地区,该地区海拔较高,气候差异显著,对比强烈,研究时段内生长季始期呈推迟趋势,平均生长季始期为127 d,推迟速率为1.63βd/10a,在1994年前后推迟趋势有所加剧,可能是水热条件的恶化[29],以及人为因素等综合作用的结果。
植被对气候变化的响应,主要表现在植被生长季信息的变化上。上述结果表明,北部地区植被对气候变化的响应主要表现为生长季始期提前,分析气温和降水生长季始期的相关性有助于进一步分析植被对气候变化的响应机制。
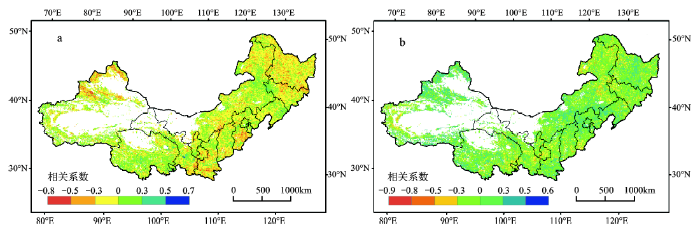
近30βa北部地区春季气温总体上呈上升趋势(线性R2=0.35),降水也呈上升趋势(线性R2=1×10-4),为了反映生长季始期与气候的空间相关性,本文在像元尺度上计算了生长季始期与春季气温和降水的关系(图8)。按相关系数范围将相关性分为7个等级(表1),其中正相关表示随气温上升和降水的增多,生长季始期呈提前趋势,反之则是负相关。从图8a和表1中可以看出,生长季始期与温度呈正相关的地区(相关系数<0,63.54%)主要分布在黄土高原地区、内蒙古北部、东北地区和新疆北部地区,显著正相关的地区(相关系数范围-0.7~-0.5,在0.01水平上显著)主要分布在新疆北部、东北平原、大兴安岭地区、小兴安岭、长白山脉和华北平原地区。从图8b和表1中可以看出,生长季始期和降水呈正相关的地区(相关系数<0,50.94%)和呈负相关的地区基本相当,与降水呈强正相关(相关系数范围-0.8~-0.5,在0.01水平上显著)的地区主要分布在内蒙古高原、大兴安岭、甘肃中部、宁夏南部等地区,从表1中可以看出,植被对气温变化较为敏感,春季气温是影响北部植被生长季始期的主要自然因素。通过叠置分析,得出同时对气温和降水呈正相关的地区占有效像元的43.93%,在研究区内较均匀分布;呈负相关的地区仅占0.09%,分布在青藏高原和陕西南部的局部地区。
图8 生长季始期与气温(a)和降水(b)的空间相关性
Fig.8 Spatial correlation of green-up day between temperature(a) and precipitation(b)
表1 中国北方生长季始期与气温和降水相关性
Table 1 Statistics of correlation of green-up day between temperature and precipitation in north of China
| 相关性 | 生长季始期与气温 | 生长季始期与降水 | |||||
|---|---|---|---|---|---|---|---|
| 系数范围 | 像元个数 | 百分比(%) | 系数范围 | 像元个数 | 百分比(%) | ||
| 显著正相关 | -0.7~-0.5 | 483 | 1.26 | -0.8~-0.5 | 208 | 0.54 | |
| 较显著正相关 | -0.5~-0.3 | 4464 | 11.62 | -0.5~-0.3 | 2431 | 6.33 | |
| 弱正相关 | -0.3~-0.1 | 12237 | 31.86 | -0.3~-0.1 | 9613 | 25.03 | |
| 基本不相关 | -0.1~0.1 | 13913 | 36.22 | -0.1~0.1 | 15377 | 40.03 | |
| 弱负相关 | 0.1~0.3 | 6670 | 17.36 | 0.1~0.3 | 9626 | 25.06 | |
| 较显著负相关 | 0.3~0.5 | 1179 | 3.07 | 0.3~0.5 | 1636 | 4.26 | |
| 显著负相关 | 0.5~0.7 | 52 | 0.14 | 0.5~0.6 | 107 | 0.28 | |
就植被分区来看,亚热带常绿阔叶林对气温的变化最为显著,相关系数为-0.2,青藏高原高寒植被区与气温的相关性最小,为0.03;降水对生长季始期的提前影响总体较小,温带针叶阔叶混交林受降水的影响较为显著,相关系数为-0.1。
综上所述,植被因所在区域和类型等的不同,对气温和降水的响应程度也有所差别。西北干旱半干旱地区在温度上升和降水增多的情况下,生长季始期呈提前趋势。东北平原和华北平原这些典型的灌溉农区也呈提前趋势,除气候的变化外还跟灌溉活动和农业结构调整有很大关系。研究时段内植被生长季始期总体上呈现出提前趋势,是春季气温和降水和其他因素共同作用的结果,但气温是主导自然因子。
遥感技术的发展为植被物候长时间序列动态变化研究提供了新的方法和技术手段,利用遥感手段研究植被生长季已经成为植被变化及物候研究的重要组成部分。借助ArcGIS 10.2、Envi 5.0和Matlab 2011软件平台,基于1983~2012年北部地区GIMMS 3g NDVI、土地利用和春季气温降水数据,用HANTS时间序列谐波分析法进行重构,经过逐像元动态阈值和多项式拟合了生长季始期,并分析了生长季始期时空变化及其与春季气温和降水的相关性,结论如下:
1) GIMMS 3g NDVI数据具有较长的时序特征和较好的数据质量,经HANTS时间序列谐波分析后能很好的表现植被生长季曲线特征,可用于后续植被生长季的研究。
2) 重构后的GIMMS 3g NDVI时序数据,经过动态阈值法和逐像元一元六次多项式拟合生长季始期,能很好地拟合生长季曲线,提取中国北部植被的生长季信息并反应长时间序列植被生长季始期的时空变化特征。
3) 受全球气候变暖和中国区域气温上升的影响,北部地区植被生长季始期总体呈现提前趋势,速率为1.75βd/10a,在空间上也具有较大的差异性,呈现由西北向东北推迟的趋势。东北平原、华北平原、内蒙古高原的部分地区、新疆天山和阿尔泰山等以人工种植农作物为主的地区,生长季始期明显早于其他地区。
4) 生长季始期与春季气温和降水具有很强的空间相关性,与春季气温的相关性大于春季降水,春季气温是影响生长季始期的主要因素。
物候提取的精度会受到提取方法、植被类型、下垫面和积雪消融等的影响,在讨论植被物候变化的影响因子时,本文也只考虑了当年春季气温和降水,实际上前一年冬季气温和降水对生长季始期也有一定的影响,并有一定的滞后作用。另外,下垫面、冰雪消融、社会经济、作物种类和政府政策等也不容忽视。本文采用谐波分析重构了生长季曲线,并用多项式拟合和动态阈值法提取长时间序列大尺度植被生长季信息,但跟植物物候学上的返青发芽等概念有一定的出入,今后的研究中尽可能参考以往物候实测记录以及相关研究。
The authors have declared that no competing interests exist.
| [1] |
Increased plant growth in the northern high latitudes from 1981 to 1991 [J]. |
| [2] |
|
| [3] |
Phenology shifts at start vs. end of growing season in temperate vegetation over the Northern Hemisphere for the period 1982-2008 [J].https://doi.org/10.1111/j.1365-2486.2011.02397.x URL Magsci [本文引用: 1] 摘要
Changes in vegetative growing seasons are dominant indicators of the dynamic response of ecosystems to climate change. Therefore, knowledge of growing seasons over the past decades is essential to predict ecosystem changes. In this study, the long-term changes in the growing seasons of temperate vegetation over the Northern Hemisphere were examined by analyzing satellite-measured normalized difference vegetation index and reanalysis temperature during 1982-2008. Results showed that the length of the growing season (LOS) increased over the analysis period; however, the role of changes at the start of the growing season (SOS) and at the end of the growing season (EOS) differed depending on the time period. On a hemispheric scale, SOS advanced by 5.2 days in the early period (1982-1999) but advanced by only 0.2 days in the later period (2000-2008). EOS was delayed by 4.3 days in the early period, and it was further delayed by another 2.3 days in the later period. The difference between SOS and EOS in the later period was due to less warming during the preseason (January-April) before SOS compared with the magnitude of warming in the preseason (June-September) before EOS. At a regional scale, delayed EOS in later periods was shown. In North America, EOS was delayed by 8.1 days in the early period and delayed by another 1.3 days in the later period. In Europe, the delayed EOS by 8.2 days was more significant than the advanced SOS by 3.2 days in the later period. However, in East Asia, the overall increase in LOS during the early period was weakened in the later period. Admitting regional heterogeneity, changes in hemispheric features suggest that the longer-lasting vegetation growth in recent decades can be attributed to extended leaf senescence in autumn rather than earlier spring leaf-out.
|
| [4] |
Inter-annual variability and interaction of remote-sensed vegetation index and atmospheric precipitation in the Aral Sea region [J].https://doi.org/10.1016/j.jaridenv.2005.01.015 URL [本文引用: 2] 摘要
The remotely sensed Normalized Difference Vegetation Index (AVHRR NDVI) and precipitation data were analysed in the Aral Sea region in Central Asia during two recent decades. Both variables exhibited pronounced seasonal variation, with maximum precipitation in March and maximum NDVI in May une. The regions of synchronous seasonal and inter-annual variability between the vegetation index and precipitation were distinguished using the Empirical Orthogonal Functions (EOF) method and time-lagged correlations between EOF modes. At a seasonal scale, precipitation and the vegetation index were correlated with a time lag from 1 to 6 months in different regions with peak plant growth following precipitation maxima.
|
| [5] |
Response of seasonal vegetation development to climatic variations in eastern central Asia [J].https://doi.org/10.1016/S0034-4257(03)00144-5 URL [本文引用: 2] 摘要
Meteorological records show that central Asia has experienced one of the strongest warming signals in the world over the last 30 years. The objective of this study was to examine the seasonal vegetation response to the recent climatic variation on the Mongolian steppes, the third largest grassland in the world. The onset date of green-up for central Asia was estimated using time-series analysis of advanced very high resolution radiometer (AVHRR) normalized difference vegetation index (NDVI) biweekly composite data collected between January 1982 and December 1991. Monthly precipitation and mean temperature data (1982-1990) were acquired from 19 meteorological stations throughout the grasslands of the eastern Mongolian steppes in China. Our results showed that while the taiga forest north of the Mongolian steppes (>50N) experienced an earlier onset of green-up during the study period, a later onset was observed at the eastern and northern edges of the Gobi Desert (40N-50N). Responses of different vegetation types to climatic variability appeared to vary with vegetation characteristics and spring soil moisture availability of specific sites. Plant stress caused by drought was the most significant contributor to later vegetation green-up as observed from satellite imagery over the desert steppe. Areas with greater seasonal soil moisture greened up earlier in the growing season. Our results suggested that water budget limitations determine the pattern of vegetation responses to atmospheric warming.
|
| [6] |
1982-2006年欧亚大陆植被生长季开始时间遥感监测分析 [J].https://doi.org/10.11820/dlkxjz.2012.11.003 URL [本文引用: 1] 摘要
植被物候是环境条件季节和年际变化最直观、最敏感的生物指示器,物候变化可以反映陆地生态系统对气候变化的快速响应。论文基于1982-2006年连续25年的GIMMS AVHRR NDVI数据,采用动态阈值法、延迟滑动平均法,双Logistic和Savitzky-Golay方法提取欧亚大陆植被的生长季开始时间,并对不同方法的提取结果进行比较和分析。然后以动态阈值法的物候提取结果,研究了1982-2006年期间植被物候变化趋势以及物候对温度变化的响应情况。结果表明:动态阈值法在欧亚大陆地区生长季开始时间提取率高,在纬度上的变化趋势稳定;北方森林/针叶林和苔原地区的生长季开始时间提取结果最稳定,低纬度区域的变率最大。1982-2006年,大部分植被类型的生长季开始时间表现出提早趋势,其中森林覆盖区域提早趋势明显,变化幅度为11.45~15.61 d/25a;除了郁闭式至开放式(15%)灌木丛(5 m)植被类型外,植被物候和温度表现出负相关关系,变化幅度为1.32~3.47d/℃,这也验证了近几十年气候变暖的趋势。
Assessment and Intercomparison of Satellite-derivedStart-of-Season (SOS) Measures in Eurasia for 1982-2006 .https://doi.org/10.11820/dlkxjz.2012.11.003 URL [本文引用: 1] 摘要
植被物候是环境条件季节和年际变化最直观、最敏感的生物指示器,物候变化可以反映陆地生态系统对气候变化的快速响应。论文基于1982-2006年连续25年的GIMMS AVHRR NDVI数据,采用动态阈值法、延迟滑动平均法,双Logistic和Savitzky-Golay方法提取欧亚大陆植被的生长季开始时间,并对不同方法的提取结果进行比较和分析。然后以动态阈值法的物候提取结果,研究了1982-2006年期间植被物候变化趋势以及物候对温度变化的响应情况。结果表明:动态阈值法在欧亚大陆地区生长季开始时间提取率高,在纬度上的变化趋势稳定;北方森林/针叶林和苔原地区的生长季开始时间提取结果最稳定,低纬度区域的变率最大。1982-2006年,大部分植被类型的生长季开始时间表现出提早趋势,其中森林覆盖区域提早趋势明显,变化幅度为11.45~15.61 d/25a;除了郁闭式至开放式(15%)灌木丛(5 m)植被类型外,植被物候和温度表现出负相关关系,变化幅度为1.32~3.47d/℃,这也验证了近几十年气候变暖的趋势。
|
| [7] |
Remotely sensed trends in the phenology of northern high latitude terrestrial vegetation, controlling for land cover change and vegetation type [J].https://doi.org/10.1016/j.rse.2013.11.020 URL 摘要
Trends in the start or end of growing season (SOS, EOS) of terrestrial vegetation reported previously as latitudinal averages limit the ability to investigate the effects of land cover change and species-wise conditioning on the presented vegetation phenology information. The current research provided more reliable estimates of the trends in the annual growth pattern of terrestrial vegetation occurring at latitudes greater than 45°N. 2502years of satellite-derived Normalised Difference Vegetation Index (GIMMS NDVI) was used and reliable vegetated pixels were analysed to derive the SOS and EOS. The rate of change in SOS and EOS over 2502years was estimated, aggregated and scrutinised at different measurement levels: a) vegetation type, b) percentage vegetative cover, c) core area, d) percentage forest cover loss, and e) latitude zones. The research presents renewed and detailed estimates of the trends in these phenology parameters in these strata. In the >0245°N zone, when only reliable pixels were considered, there was an advancement of 61020.5802days02yr 61021 in SOS and a delay of +020.6402days02yr 61021 in EOS. For homogeneous vegetated areas (91–100% cover at 802km spatial resolution) the 55–65°N zone showed the maximum change with 61021.0702days02yr 61021 advancement in SOS for needle leaved deciduous vegetation , and 61021.0602days02yr 61021 delay in EOS for broad leaved deciduous vegetation . Overall, the increasing trend in EOS during senescence (September to November) was greater in magnitude than the decreasing trend in SOS during spring (March to May) and the change in EOS was more consistent and greater than that in SOS.
|
| [8] |
基于NOAA NDVI和MSAVI研究中国北方植被生长季变化 [J].https://doi.org/10.3321/j.issn:1000-0933.2007.02.012 URL Magsci [本文引用: 2] 摘要
利用1982~1999年的NOAA/AVHRR NDVI和MSAVI指数监测了中国北方植被生长季变化规律,主要内容包括:(1)不同植被类型的生长季变化监测。提取植被的1982~1999年NDVI和MSAVI时间序列,利用阈值法和滑动平均法逐年估测植被类型的生长季的开始、结束日期及长度。对估测的生长季开始、结束时间和长度进行一次线性拟合,得到了18a中植被生长季的开始、结束日期和长度的线性变化趋势;(2)不同区域的植被生长季变化监测。将中国北方13省、区按纬向划分为32~36°N,36~40°N,40~44°N,44~48°N,48~52°N等5个区域。基于最大变化斜率法估测了不同年份的生长季开始、结束和长度;(3)研究区域植被生长季的空间变化监测。利用曲线拟合出1982~1999年像元对应的空间位置的植被平均生长季变化,然后讨论了多年平均的植被生长季的空间分异规律,并利用一次线性拟合分析了这18a的植被生长季的变化趋势。结果表明:部分植被类型生长季的开始日期提前,结束日期推迟,而生长季长度延长,提前或推迟的天数不一,如典型草原、荒漠草原、寒温带山地落叶针叶林。而一些植被类型的生长季并没有表现出这样的趋势,而是开始日期延迟或结束日期推迟,如温带落叶阔叶林。不同纬度带的植被生长季变化监测表明,大部分纬度带植被生长季开始日期都表现出不同程度的提前趋势,生长季结束日期表现出推迟的趋势,整个生长季长度表现出延长的趋势。中国北方植被生长季空间变化研究表明,青海、甘肃、陕南地区的植被生长季开始较早。新疆天山、东北北部、青海、甘肃的部分地区植被生长季结束较早。东北、青海、新疆的大部分地区的植被生长季有明显的延长趋势,整个研究区内有一部分地区的植被生长季长度表现出缩短的趋势。
The variability of vegetation growing season in the northern China based on NOAA NDVI and MSAVI from 1982 to 1999 .https://doi.org/10.3321/j.issn:1000-0933.2007.02.012 URL Magsci [本文引用: 2] 摘要
利用1982~1999年的NOAA/AVHRR NDVI和MSAVI指数监测了中国北方植被生长季变化规律,主要内容包括:(1)不同植被类型的生长季变化监测。提取植被的1982~1999年NDVI和MSAVI时间序列,利用阈值法和滑动平均法逐年估测植被类型的生长季的开始、结束日期及长度。对估测的生长季开始、结束时间和长度进行一次线性拟合,得到了18a中植被生长季的开始、结束日期和长度的线性变化趋势;(2)不同区域的植被生长季变化监测。将中国北方13省、区按纬向划分为32~36°N,36~40°N,40~44°N,44~48°N,48~52°N等5个区域。基于最大变化斜率法估测了不同年份的生长季开始、结束和长度;(3)研究区域植被生长季的空间变化监测。利用曲线拟合出1982~1999年像元对应的空间位置的植被平均生长季变化,然后讨论了多年平均的植被生长季的空间分异规律,并利用一次线性拟合分析了这18a的植被生长季的变化趋势。结果表明:部分植被类型生长季的开始日期提前,结束日期推迟,而生长季长度延长,提前或推迟的天数不一,如典型草原、荒漠草原、寒温带山地落叶针叶林。而一些植被类型的生长季并没有表现出这样的趋势,而是开始日期延迟或结束日期推迟,如温带落叶阔叶林。不同纬度带的植被生长季变化监测表明,大部分纬度带植被生长季开始日期都表现出不同程度的提前趋势,生长季结束日期表现出推迟的趋势,整个生长季长度表现出延长的趋势。中国北方植被生长季空间变化研究表明,青海、甘肃、陕南地区的植被生长季开始较早。新疆天山、东北北部、青海、甘肃的部分地区植被生长季结束较早。东北、青海、新疆的大部分地区的植被生长季有明显的延长趋势,整个研究区内有一部分地区的植被生长季长度表现出缩短的趋势。
|
| [9] |
Consistent shifts in spring vegetation green-up date across temperate biomes in China, 1982-2006 [J].https://doi.org/10.1111/gcb.12086 URL PMID: 23504843 Magsci [本文引用: 1] 摘要
Understanding spring phenology changes in response to the rapid climate change at biome-level is crucial for projecting regional ecosystem carbon exchange and climate-biosphere interactions. In this study, we assessed the long-term changes and responses to changing climate of the spring phenology in six temperate biomes of China by analyzing the global inventory monitoring and modeling studies (GIMMS) NOAA/AVHRR Normalized Difference Vegetation Index (NDVI) and concurrent mean temperature and precipitation data for 1982-2006. Results show that the spring phenology trends in the six temperate biomes are not continuous throughout the 25year period. The spring phenology in most areas of the six biomes showed obvious advancing trends (ranging from -0.09 to -0.65day/yr) during the 1980s and early 1990s, but has subsequently suffered consistently delaying trends (ranging from 0.22 to 1.22day/yr). Changes in spring (February-April) temperature are the dominating factor governing the pattern of spring vegetation phenology in the temperate biomes of China. The recently delayed spring phenology in these temperate biomes has been mainly triggered by the stalling or reversal of the warming trend in spring temperatures. Results in this study also reveal that precipitation during November-January can explain 16.1% (P<0.05), 20.9% (P<0.05) and 14.2% (P<0.05) of the variations in temperate deciduous forest (TDF), temperate steppe (TS), temperate desert (TD) respectively, highlighting the important role of winter precipitation in regulating changes in the spring vegetation phenology of water-limited biomes.
|
| [10] |
基于NDVI的秦岭山地植被遥感物候及其与气温的响应关系——以陕西境内为例 [J].https://doi.org/10.1016/S0955-2219(02)00073-0 URL Magsci [本文引用: 2] 摘要
基于MODIS NDVI时间序列数据,利用动态阈值法提取秦岭山地2000~2010年的物候参数,并结合实测物候资料进行验证,在宏观尺度上量化了气温升高对植物物候的影响程度.研究得出:基于NDVI的物候变化趋势与实测物候资料结果一致;2000~2010年间物候始期提前的速率为0.165 6 d/a,末期推后速率为0.109 1 d/a;空间上,秦岭山地北部区域的植被物候始期主要发生在第120~130 d,相对于南坡较晚,物候末期主要发生在第300~325 d,北部区域物候末期的到来较迟,南部区域相对较早;物候始期NDVI与有效气温、春季、生长期气温相关性较好,末期NDVI与夏、秋季节气温相关性较好;气温对生长季开始阶段的NDVI在时间上存在2~3旬的滞后效应.
The vegetation remote sensing phenology of Qinling Mountains based on NDVI and it’s response to temperature: Taking within the territory of Shaanxi as an example .https://doi.org/10.1016/S0955-2219(02)00073-0 URL Magsci [本文引用: 2] 摘要
基于MODIS NDVI时间序列数据,利用动态阈值法提取秦岭山地2000~2010年的物候参数,并结合实测物候资料进行验证,在宏观尺度上量化了气温升高对植物物候的影响程度.研究得出:基于NDVI的物候变化趋势与实测物候资料结果一致;2000~2010年间物候始期提前的速率为0.165 6 d/a,末期推后速率为0.109 1 d/a;空间上,秦岭山地北部区域的植被物候始期主要发生在第120~130 d,相对于南坡较晚,物候末期主要发生在第300~325 d,北部区域物候末期的到来较迟,南部区域相对较早;物候始期NDVI与有效气温、春季、生长期气温相关性较好,末期NDVI与夏、秋季节气温相关性较好;气温对生长季开始阶段的NDVI在时间上存在2~3旬的滞后效应.
|
| [11] |
基于遥感方法的长白山地区植被物候期变化趋势研究 [J].
目前,越来越多的遥感数据被用来监测大面积植物物候的动态变化。利用长时间序列的SPOT/NDVI旬合成数据,通过doublelogistic模型获取了1999~2008年长白山地区植被的3个关键物候参数:生长季始期、生长季末期和生长季长度的多年平均值,并绘制了它们的变化趋势空间格局图。结果表明,林地的生长季开始日期为第100-120天,草地和耕地相对较晚,分别为第130~140天和第140~150天;林地和草地生长季的结束日期为第275-285天,耕地的相对较早,为第265~275天;林地、草地和耕地的生长季长度范围分别为160-180d、140-160d和110--130d。植被物候期的变化趋势表现为一定的空间差异性,生长季长度延长区域主要分布在长白山地区的中东部,平均每年延长约0.7d;缩短的区域在西北地区,平均每年缩短1.1d。最后通过部分物候观测数据及前人在相同研究区的结果验证了利用doublelogistic模型提取预测长白山植被物候期的可行性。
Growing-season Trends Determined from SPOT NDVI in Changbai Mountains, China, 1999-2008 .
目前,越来越多的遥感数据被用来监测大面积植物物候的动态变化。利用长时间序列的SPOT/NDVI旬合成数据,通过doublelogistic模型获取了1999~2008年长白山地区植被的3个关键物候参数:生长季始期、生长季末期和生长季长度的多年平均值,并绘制了它们的变化趋势空间格局图。结果表明,林地的生长季开始日期为第100-120天,草地和耕地相对较晚,分别为第130~140天和第140~150天;林地和草地生长季的结束日期为第275-285天,耕地的相对较早,为第265~275天;林地、草地和耕地的生长季长度范围分别为160-180d、140-160d和110--130d。植被物候期的变化趋势表现为一定的空间差异性,生长季长度延长区域主要分布在长白山地区的中东部,平均每年延长约0.7d;缩短的区域在西北地区,平均每年缩短1.1d。最后通过部分物候观测数据及前人在相同研究区的结果验证了利用doublelogistic模型提取预测长白山植被物候期的可行性。
|
| [12] |
Green-up dates in the Tibetan Plateau have continuously advanced from 1982 to 2011 [J].https://doi.org/10.1073/pnas.1210423110 URL PMID: 23440201 [本文引用: 1] 摘要
As the Earth's third pole, the Tibetan Plateau has experienced a pronounced warming in the past decades. Recent studies reported that the start of the vegetation growing season (SOS) in the Plateau showed an advancing trend from 1982 to the late 1990s and a delay from the late 1990s to 2006. However, the findings regarding the SOS delay in the later period have been questioned, and the reasons causing the delay remain unknown. Here we explored the alpine vegetation SOS in the Plateau from 1982 to 2011 by integrating three long-term time-series datasets of Normalized Difference Vegetation Index (NDVI): Global Inventory Modeling and Mapping Studies (GIMMS, 1982-2006), SPOT VEGETATION (SPOT-VGT, 1998-2011), and Moderate Resolution Imaging Spectroradiometer (MODIS, 2000-2011). We found GIMMS NDVI in 2001-2006 differed substantially from SPOT-VGT and MODIS NDVIs and may have severe data quality issues in most parts of the western Plateau. By merging GIMMS-based SOSs from 1982 to 2000 with SPOT-VGT-based SOSs from 2001 to 2011 we found the alpine vegetation SOS in the Plateau experienced a continuous advancing trend at a rate of 1.04 d y(-1) from 1982 to 2011, which was consistent with observed warming in springs and winters. The satellite-derived SOSs were proven to be reliable with observed phenology data at 18 sites from 2003 to 2011; however, comparison of their trends was inconclusive due to the limited temporal coverage of the observed data. Longer-term observed data are still needed to validate the phenology trend in the future.
|
| [13] |
基于多源遥感数据集的近30a西北地区植被动态变化研究 [J].
基于重构后的AVHRR GIMMS NDVI、MODIS NDVI、GLC 2000数据产品和研究区的128个气象站点的气温、降水数据,利用回归分析、相关性分析法,研究了西北地区近30 a(1984-2013年)以来不同植被NDVI的时空变化及其与气候的相关性。结果表明:(1)研究时段内,西北地区植被NDVI变化整体上呈上升趋势,将整个研究分为两个时段,1984-1997年呈小幅上升趋势,且波动起伏较大,最大值在1993年,最小值出现在1995年;1997-2013年也呈波动上升趋势,且上升趋势大于前一阶段。(2)空间上,西北地区植被NDVI变化存在明显的区域差异,大部分区域植被NDVI变化显著性较弱,昆仑山、塔里木盆地北部、祁连山、青海的中东西部、甘肃东部、陕西北部等地区植被NDVI显著增加;阿尔泰山、天山、伊犁哈萨克自治州等干旱地区植被NDVI下降趋势明显。(3)除甘肃的祁连山、青海东南部、陕西的秦岭等地植被NDVI的变化主要受气温的驱动外,西北地区植被NDVI变化与气温整体上呈弱相关,干旱半干旱地区植被与气温呈负相关;除甘肃南部、祁连山西段和陕西中部等一些年降水量较多以及灌溉农业区或草地以外,西北地区植被与降水呈较强正相关,降水是影响植被变化的主要自然因素;(4)不同植被类型NDVI的变化具有时空差异性,且与气温和降水的相关性不尽相同,与气温由强到弱:耕地灌丛草地沼泽湿地林地;与降水由强到弱:耕地草地灌丛林地沼泽湿地。
Vegetation dynamic changes in northwest China based onmulti-source remote sensing datasets in recent 30 years .
基于重构后的AVHRR GIMMS NDVI、MODIS NDVI、GLC 2000数据产品和研究区的128个气象站点的气温、降水数据,利用回归分析、相关性分析法,研究了西北地区近30 a(1984-2013年)以来不同植被NDVI的时空变化及其与气候的相关性。结果表明:(1)研究时段内,西北地区植被NDVI变化整体上呈上升趋势,将整个研究分为两个时段,1984-1997年呈小幅上升趋势,且波动起伏较大,最大值在1993年,最小值出现在1995年;1997-2013年也呈波动上升趋势,且上升趋势大于前一阶段。(2)空间上,西北地区植被NDVI变化存在明显的区域差异,大部分区域植被NDVI变化显著性较弱,昆仑山、塔里木盆地北部、祁连山、青海的中东西部、甘肃东部、陕西北部等地区植被NDVI显著增加;阿尔泰山、天山、伊犁哈萨克自治州等干旱地区植被NDVI下降趋势明显。(3)除甘肃的祁连山、青海东南部、陕西的秦岭等地植被NDVI的变化主要受气温的驱动外,西北地区植被NDVI变化与气温整体上呈弱相关,干旱半干旱地区植被与气温呈负相关;除甘肃南部、祁连山西段和陕西中部等一些年降水量较多以及灌溉农业区或草地以外,西北地区植被与降水呈较强正相关,降水是影响植被变化的主要自然因素;(4)不同植被类型NDVI的变化具有时空差异性,且与气温和降水的相关性不尽相同,与气温由强到弱:耕地灌丛草地沼泽湿地林地;与降水由强到弱:耕地草地灌丛林地沼泽湿地。
|
| [14] |
Satellite observations of high northern latitude vegetation productivity changes between 1982 and 2008: ecological variability and regional differences [J]. |
| [15] |
Northern hemisphere photosynthetic trends 1982-99 [J].https://doi.org/10.1046/j.1365-2486.2003.00507.x URL [本文引用: 1] 摘要
Abstract We examined trends in the averaged May–September AVHRR normalized difference vegetation index (NDVI) from 1982 to 1999 for the northern hemisphere. NDVI is closely related to the amount of absorbed photosynthetically active radiation; hence, trends in NDVI reflect trends in photosynthetic activity of land-surface vegetation. Linear and nonlinear trend analysis techniques were applied to four differently processed and corrected Advanced Very High Resolution Radiometer (AVHRR) NDVI data sets. The results were compared in order to evaluate the effects of trends in NDVI unrelated to vegetation activity. We consistently found significant positive trends in averaged NDVI for latitude bands above 35°N in all but one data set; this one data set lacked corrections for sensor drift and instrument calibration. An impressive improvement in data quality was achieved by applying calibration and corrections for atmospheric effects. Conservative estimates of the trends over the 1982–99 period range from 0.0015 to 0.004565NDVI units year 611 for global latitude bands from 35 to 75°N, with trends generally higher in the 1990s than in the 1980s; trends in NDVI were larger than trends explained by artefacts. In the 1980s, North American and Eurasian trends were roughly comparable, whereas in the 1990s the North American trends were generally higher. A pixel-level analysis shows the trends to be widespread, with large areas of Canada, Europe and northern Asia experiencing significant positive increases across all vegetated landcovers.
|
| [16] |
Variations in northern vegetation activity inferred from satellite data of vegetation index during 1981 to 1999 [J]. |
| [17] |
The Best Index Slope Extraction (BISE): A method for reducing noise in NDVI time-series [J].https://doi.org/10.1080/01431169208904212 URL [本文引用: 1] 摘要
The Best Index Slope Extraction (BISE) is proposed as an alternative to the Maximum Value Composite (MVC) as a way of reducing noise in Normalized Difference Vegetation Index (NDVI) time-series from Advanced Very High Resolution Radiometer (AVHRR) data. The BISE method retains more valuable elements of an NDVI profile than the MVC. NDVI profiles prepared using the BISE method show strong differences in the development characteristics of various West African vegetation types.
|
| [18] |
Smoothing and differentiation of data by simplified least squares procedures [J]. |
| [19] |
A proposal of the Temporal Window Operation (TWO) method to remove high-frequency noises in AVHRR-NDVI time series data [J].https://doi.org/10.4287/jsprs.38.5_36 URL [本文引用: 1] 摘要
This paper describes a new method to remove high frequency fluctuations in timeseries normalized difference vegetation index (NDVI) of NOAA AVHRR. Time series NDVI of AVHRR are frequently used for global or continental land cover monitoring. However, NDVI values have undesirable noises due to cloud or atmospheric effect and signal noises. These effects cause high frequency fluctuations in time series NDVI. In order to remove these fluctuations, several methods such as Maximum Value Composite (MVC) method, Cloud screening method, J. Cihlar's method, and Maximum Value Interpolated (MVI) method have been developed. Since none of them provides satisfactory result, authors developed a new method, the Temporal Window Operation (TWO) method, main part of which is the removal of the effect of clouds to make a smooth temporal NDVI change. The TWO method also includes the removal of high value noises.
|
| [20] |
Reconstructing cloud free NDVI composites using Fourier analysis of time series [J]. |
| [21] |
Monitoring the length of the growing season with NOAA [J].https://doi.org/10.1080/01431160110070843 URL [本文引用: 1] 摘要
A vegetation index (NDVI) time series of 1984 to 1993 was used to calibrate a pixel-based assessment of the start, end and length of the growing season in the sahelian country of Burkina Faso. Annual curves of rainfall/ETP, NDVI crop calendars were prepared for meteorological stations representative for three climatic zones. Agrometereological criteria for assessment of the start and the end were extracted from literature. NDVI parameters were assessed at the dekad of the agrometeorological onset and end of the growing season, and used for the definition of decision rules. Decision rules were implemented in a GIS to the NDVI image time series. The start of the growing season assessed with the NDVI dynamics was slightly better correlated with given farmer's sowing dates than with original agro-meteorological criteria. The normal start of the growing season, calculated from the NDVI image time series, was in good agreement with the recommended sowing dates. A delay of the onset of the growing season with regard to normal was monitored under near real time conditions in Burkina Faso in 1995. It was found that the delay of up to five dekads could lead to a partial crop failure and to changes in decisions of farmers. The model for the start and the end of the growing season was validated with independent data from different years. From the maps of the end and the start, maps of the length of the growing season were calculated by subtraction. The length of the growing season was found to be in agreement with agrometeorological literature, although in northern sahelian areas, the real growing season measured by the vegetation index tended to be shorter by about one dekad. In addition, the climatic map was improved by a per pixel classification of a normal (1984-1995 median) image time profile. The 36 normal NDVI images were classified using a hyperspectral image-processing tool.
|
| [22] |
Monitoring vegetation phenology using MODIS [J].https://doi.org/10.1016/S0034-4257(02)00135-9 URL [本文引用: 1] 摘要
Accurate measurements of regional to global scale vegetation dynamics (phenology) are required to improve models and understanding of inter-annual variability in terrestrial ecosystem carbon exchange and climate iosphere interactions. Since the mid-1980s, satellite data have been used to study these processes. In this paper, a new methodology to monitor global vegetation phenology from time series of satellite data is presented. The method uses series of piecewise logistic functions, which are fit to remotely sensed vegetation index (VI) data, to represent intra-annual vegetation dynamics. Using this approach, transition dates for vegetation activity within annual time series of VI data can be determined from satellite data. The method allows vegetation dynamics to be monitored at large scales in a fashion that it is ecologically meaningful and does not require pre-smoothing of data or the use of user-defined thresholds. Preliminary results based on an annual time series of Moderate Resolution Imaging Spectroradiometer (MODIS) data for the northeastern United States demonstrate that the method is able to monitor vegetation phenology with good success.
|
| [23] |
Measuring phenological variability from satellite imagery [J].https://doi.org/10.2307/3235884 URL [本文引用: 1] 摘要
Abstract. Vegetation phenological phenomena are closely related to seasonal dynamics of the lower atmosphere and are therefore important elements in global models and vegetation monitoring. Normalized difference vegetation index (NDVI) data derived from the National Oceanic and Atmospheric Administration's Advanced Very High Resolution Radiometer (AVHRR) satellite sensor offer a means of efficiently and objectively evaluating phenological characteristics over large areas. Twelve metrics linked to key phenological events were computed based on time-series NDVI data collected from 1989 to 1992 over the conterminous United States. These measures include the onset of greenness, time of peak NDVI, maximum NDVI, rate of greenup, rate of senescence, and integrated NDVI. Measures of central tendency and variability of the measures were computed and analyzed for various land cover types. Results from the analysis showed strong coincidence between the satellite-derived metrics and predicted phenological characteristics. In particular, the metrics identified interannual variability of spring wheat in North Dakota, characterized the phenology of four types of grasslands, and established the phenological consistency of deciduous and coniferous forests. These results have implications for large-area land cover mapping and monitoring. The utility of remotely sensed data as input to vegetation mapping is demonstrated by showing the distinct phenology of several land cover types. More stable information contained in ancillary data should be incorporated into the mapping process, particularly in areas with high phenological variability. In a regional or global monitoring system, an increase in variability in a region may serve as a signal to perform more detailed land cover analysis with higher resolution imagery.
|
| [24] |
Determining the growing season of land vegetation on the basis of plant phenology and satellite data in Northern China [J].https://doi.org/10.1007/s004840000056 URL PMID: 10993564 [本文引用: 1] 摘要
The objectives of this study are to explore the relationships between plant phenology and satellite-sensor-derived measures of greenness, and to advance a new procedure for determining the growing season of land vegetation at the regional scale. Three phenological stations were selected as sample sites to represent different climatic zones and vegetation types in northern China. The mixed data set consists of occurrence dates of all observed phenophases for 50 70 kinds of trees and shrubs from 1983 to 1988. Using these data, we calculated the cumulative frequency of phenophases in every 5-day period (pentad) throughout each year, and also drew the cumulative frequency distribution curve for all station-years, in order to reveal the typical seasonal characteristics of these plant communities. The growing season was set as the time interval between 5% and 95% of the phenological cumulative frequency. Average lengths of the growing season varied between 188 days in the northern, to 259 days in the southern part of the research region. The beginning and end dates of the surface growing season were then applied each year as time thresholds, to determine the corresponding 10-day peak greenness values from normalized difference vegetation index curves for 8-km 2 pixels overlying the phenological stations. Our results show that, at the beginning of the growing season, the largest average greenness value occurs in the southern part, then in the northern, and finally the middle part of the research region. In contrast, at the end of the growing season, the largest average greenness value is measured in the northern part, next in the middle and lastly the southern part of the research region. In future studies, these derived NDVI thresholds can be applied to determine the growing season of similar plant communities at other sites, which lack surface phenological data.
|
| [25] |
利用遥感数据优化物候模型时样本选择的新方法 [J].https://doi.org/10.17521/cjpe.2015.0026 URL Magsci [本文引用: 1] 摘要
<p>植被物候模型是生态系统模型的重要组成部分, 其精度对准确地模拟陆面和大气之间的能量和物质交换具有重要意义。利用遥感获取空间物候信息并与气候数据进行耦合分析是在中亚干旱区等地面物候观测数据缺乏的地区构建物候模型的重要方法。为减小混合植被像元和气候数据资料的内在误差及二者在空间尺度的不匹配对物候模型构建产生的影响, 该研究提出一种在气象站点周围选取满足规定规则集的“代表植被类型像元”作为样本点的选择方法, 以代表植被类型像元的遥感物候数据和气象站点数据为基础, 结合经典物候模型和改进物候模型, 在粒子群优化算法支持下, 分别以独立的拟合与评价样本数据, 完成了荒漠草原植被与落叶阔叶林的模型拟合与评价。研究发现中亚干旱区荒漠草原植被的最优模型为温度-降水修正模型, 落叶阔叶林的最优模型为替代模型。通过此方法模型总体精度在8–10 d左右。结果表明此方法在气候数据和植物物候空间匹配方面有改进, 有助于提高物候模型精度。</p>
A new method of sample selections for optimizing phenology model based remote sensing data .https://doi.org/10.17521/cjpe.2015.0026 URL Magsci [本文引用: 1] 摘要
<p>植被物候模型是生态系统模型的重要组成部分, 其精度对准确地模拟陆面和大气之间的能量和物质交换具有重要意义。利用遥感获取空间物候信息并与气候数据进行耦合分析是在中亚干旱区等地面物候观测数据缺乏的地区构建物候模型的重要方法。为减小混合植被像元和气候数据资料的内在误差及二者在空间尺度的不匹配对物候模型构建产生的影响, 该研究提出一种在气象站点周围选取满足规定规则集的“代表植被类型像元”作为样本点的选择方法, 以代表植被类型像元的遥感物候数据和气象站点数据为基础, 结合经典物候模型和改进物候模型, 在粒子群优化算法支持下, 分别以独立的拟合与评价样本数据, 完成了荒漠草原植被与落叶阔叶林的模型拟合与评价。研究发现中亚干旱区荒漠草原植被的最优模型为温度-降水修正模型, 落叶阔叶林的最优模型为替代模型。通过此方法模型总体精度在8–10 d左右。结果表明此方法在气候数据和植物物候空间匹配方面有改进, 有助于提高物候模型精度。</p>
|
| [26] |
浙江省植被物候变化及其对气候变化的响应 [J].https://doi.org/10.11849/zrzyxb.2013.02.004 URL Magsci [本文引用: 1] 摘要
<p>基于改进的Savitzky-Golay滤波算法重构了2001—2010年MODIS NDVI时间序列数据,反演了浙江近10 a来的植被生长状况,利用分段多项式拟合和动态阈值法提取了自然植被重要物候期(生长季开始时间、结束时间和生长季长度等),分析了植被物候期的年际变化趋势和空间分异特征,并结合同期气象数据,探讨了植被物候变化与气候变化的关系.主要结论如下:①浙江植被覆盖有所减少,整体下降趋势不显著,平均植被生长季为222 d,长度略有延长,其中开始时间提前趋势不显著,而结束时间推迟显著.②植被生长季为3月下旬至11月中旬,植被生长季的开始时间从北往南逐渐推迟,生长季结束时间相对集中,其中生长季延长的区域面积和缩短的区域面积相当.③气象要素与关键物候期参数的相关性分析表明冬季的热量供给是影响浙江植被生长开始的重要因子,植被生长季前期温度积累的增加有利于植被生长;生长季结束时间与当年温度呈极显著正相关,与当年降水和湿润指数的减少呈负相关,但影响不显著,从与各相关月、季度相关分析来看,秋季干湿程度对植被生长季结束时间影响相对较大.</p>
Vegetation Phenological Variation and Its Response to Climate Changes in Zhejiang Province .https://doi.org/10.11849/zrzyxb.2013.02.004 URL Magsci [本文引用: 1] 摘要
<p>基于改进的Savitzky-Golay滤波算法重构了2001—2010年MODIS NDVI时间序列数据,反演了浙江近10 a来的植被生长状况,利用分段多项式拟合和动态阈值法提取了自然植被重要物候期(生长季开始时间、结束时间和生长季长度等),分析了植被物候期的年际变化趋势和空间分异特征,并结合同期气象数据,探讨了植被物候变化与气候变化的关系.主要结论如下:①浙江植被覆盖有所减少,整体下降趋势不显著,平均植被生长季为222 d,长度略有延长,其中开始时间提前趋势不显著,而结束时间推迟显著.②植被生长季为3月下旬至11月中旬,植被生长季的开始时间从北往南逐渐推迟,生长季结束时间相对集中,其中生长季延长的区域面积和缩短的区域面积相当.③气象要素与关键物候期参数的相关性分析表明冬季的热量供给是影响浙江植被生长开始的重要因子,植被生长季前期温度积累的增加有利于植被生长;生长季结束时间与当年温度呈极显著正相关,与当年降水和湿润指数的减少呈负相关,但影响不显著,从与各相关月、季度相关分析来看,秋季干湿程度对植被生长季结束时间影响相对较大.</p>
|
| [27] |
黄淮海地区植被生长季变化及其气候变化响应 [J].https://doi.org/10.3969/j.issn.1001-7313.2011.04.006 URL [本文引用: 1] 摘要
利用1982—2000年的 NOAA/AVHRR逐旬数据,采用最大变化斜率法、曲线拟合法等方法分析黄淮海地区植被生长季开始及结束时间,选取典型样带,制作基于逐像无的 I_(NDV)(归一化植被指数)变化图,研究1982—2000年植被生长季的变化规律及其对气候变化的响应。结果表明:黄淮海地区生长季开始的平均时 间为3月下旬,结束时间为11月上旬。20年来研究区植被四季平均I_(NDV)呈上升趋势,春季增长尤为显著,且随着年代的推移,植被生长季有延长的趋 势,生长季提前是黄淮海地区植被活动对气候变化响应的主要方式。
The Change of Growing Season of the Vegetation in Huanghe-Huaihe-HaiheRgeion and Its Responses to Climate Changes .https://doi.org/10.3969/j.issn.1001-7313.2011.04.006 URL [本文引用: 1] 摘要
利用1982—2000年的 NOAA/AVHRR逐旬数据,采用最大变化斜率法、曲线拟合法等方法分析黄淮海地区植被生长季开始及结束时间,选取典型样带,制作基于逐像无的 I_(NDV)(归一化植被指数)变化图,研究1982—2000年植被生长季的变化规律及其对气候变化的响应。结果表明:黄淮海地区生长季开始的平均时 间为3月下旬,结束时间为11月上旬。20年来研究区植被四季平均I_(NDV)呈上升趋势,春季增长尤为显著,且随着年代的推移,植被生长季有延长的趋 势,生长季提前是黄淮海地区植被活动对气候变化响应的主要方式。
|
| [28] |
Climatic control of the high latitude vegetation greening trend and Pinatubo effect [J].https://doi.org/10.1126/science.1071828 URL PMID: 12040194 [本文引用: 1] 摘要
A biogeochemical model of vegetation using observed climate data predicts the high northern latitude greening trend over the past two decades observed by satellites and a marked setback in this trend after the Mount Pinatubo volcano eruption in 1991. The observed trend toward earlier spring budburst and increased maximum leaf area is produced by the model as a consequence of biogeochemical vegetation responses mainly to changes in temperature. The post-Pinatubo decline in vegetation in 1992-1993 is apparent as the effect of temporary cooling caused by the eruption. High-latitude CO(2) uptake during these years is predicted as a consequence of the differential response of heterotrophic respiration and net primary production.
|
| [29] |
近10年青藏高原高寒草地物候时空变化特征分析 [J].https://doi.org/10.1007/s11434-012-5407-5 URL [本文引用: 1] 摘要
植物物候是陆地生态系统对气候变化响应的最佳指示器,其变化研究对于深入地理解和预测陆地生态系统的动态变化具有重要的意义.本文利用SPOTVGT归一化植被指数(NDVI)对青藏高原1999~2009年间高寒草地物候的时空变化进行了研究,结论如下:①青藏高原高寒草地物候多年均值的空间分布与水热条件关系密切.由东南向西北,随着水热条件的恶化,生长季始期(SOG)逐渐推迟,生长季末期(EOG)逐渐提前,生长季长度(LOG)逐渐缩短.海拔在物候的地域分异中扮演着重要作用,但存在3500m分界线.其下,物候随海拔变化波动较大,其上物候与海拔关系密切;②1999~2009年间,青藏高原高寒草地SOG整体上呈提前趋势,变化幅度为6d/10a(R2=0.281,P=0.093);EOG呈推迟趋势,变化幅度为2d/10a(R2=0.031,P=0.605);LOG呈延长趋势,变化幅度为8d/10a(R2=0.479,P=0.018).SOG提前、EOG推迟和LOG增长的区域主要分布在高原的东部.SOG推迟、EOG提前和LOG缩短的区域主要分布在高原的中、西部,其中高原绝大部分区域的SOG呈显著提前趋势,尤其是高原的东部地区;③青藏高原高寒草地物候年际变化在不同的海拔和自然带上分异显著.高海拔地区的年际变化趋势要比低海拔复杂;青东祁连山地草原带的变化幅度和显著水平最高,而藏南山地灌丛草原带最低.
Spatiotemporal variation in alpine grassland phenology in the Qinghai-Tibetan Plateau from 1999 to 2009 .https://doi.org/10.1007/s11434-012-5407-5 URL [本文引用: 1] 摘要
植物物候是陆地生态系统对气候变化响应的最佳指示器,其变化研究对于深入地理解和预测陆地生态系统的动态变化具有重要的意义.本文利用SPOTVGT归一化植被指数(NDVI)对青藏高原1999~2009年间高寒草地物候的时空变化进行了研究,结论如下:①青藏高原高寒草地物候多年均值的空间分布与水热条件关系密切.由东南向西北,随着水热条件的恶化,生长季始期(SOG)逐渐推迟,生长季末期(EOG)逐渐提前,生长季长度(LOG)逐渐缩短.海拔在物候的地域分异中扮演着重要作用,但存在3500m分界线.其下,物候随海拔变化波动较大,其上物候与海拔关系密切;②1999~2009年间,青藏高原高寒草地SOG整体上呈提前趋势,变化幅度为6d/10a(R2=0.281,P=0.093);EOG呈推迟趋势,变化幅度为2d/10a(R2=0.031,P=0.605);LOG呈延长趋势,变化幅度为8d/10a(R2=0.479,P=0.018).SOG提前、EOG推迟和LOG增长的区域主要分布在高原的东部.SOG推迟、EOG提前和LOG缩短的区域主要分布在高原的中、西部,其中高原绝大部分区域的SOG呈显著提前趋势,尤其是高原的东部地区;③青藏高原高寒草地物候年际变化在不同的海拔和自然带上分异显著.高海拔地区的年际变化趋势要比低海拔复杂;青东祁连山地草原带的变化幅度和显著水平最高,而藏南山地灌丛草原带最低.
|

/
| 〈 |
|
〉 |