赵泉华 , 胡广臣, 李玉
辽宁工程技术大学测绘与地理科学学院遥感科学与应用研究所,辽宁 阜新 123000
Zhao Quanhua, Hu Guangchen, Li Yu
中图分类号: TP79
文献标识码: A
文章编号: 1000-0690(2017)07-1120-07
收稿日期: 2016-09-20
修回日期: 2016-11-26
网络出版日期: 2017-07-20
版权声明: 2017 《地理科学》编辑部 本文是开放获取期刊文献,在以下情况下可以自由使用:学术研究、学术交流、科研教学等,但不允许用于商业目的.
基金资助:
作者简介:
作者简介:赵泉华(1978-),女,河北承德人,博士,副教授,博导,主要研究方向为随机几何、空间统计学、模糊集理论等在遥感图像建模、解译及其在海洋环境遥感中的应用。E-mail:zhaoquanhua@lntu.edu.cn
展开
摘要
为了更加精准地从合成孔径雷达(SAR)图像中提取水边线,提出基于G0分布的SAR图像水边线提取方法。首先,将SAR图像域划分为大小相等的子块,并假设每个子块内像素强度服从独立同一的G0分布;利用矩估计方法得到对应每个子块的粗糙度和散射性参数;根据设定的参数阈值,可划分出粗略的水域,并确定该区域的几何中心;以该几何中心为圆心,向四周做射线,保留经过陆地区域的射线;利用似然函数确定每条射线上的水-陆分界点,依次连接分界点,进而实现SAR图像水边线提取。采用本文方法,分别对模拟和真实SAR图像进行水边线提取实验。定性和定量结果表明:采用基于G0分布的SAR图像水边线提取方法能够有效地克服斑点噪声的影响。
关键词:
Abstract
The water line is the demarcation line between land and sea areas. It is important interaction zone for global ecosystem conservation. As a result, it is vital that the rapid, accurate, real-time extraction of water line. Remote sensing solutions using Synthetic Aperture Radar (SAR) are playing an increasingly important role in monitoring water line and have getted much more attention from scholars and related department around the world. The sensor has two types: satellite SAR and airborne SAR. Satellite SAR has many advantages, for instance wide range observation, timely data available and all weather operation. As a result, it is a most suitable sensor for monitoring water line in marine environments. At present, the commonly used satellite SAR sensors for this purpose including Seasat SAR, Jers-1 SAR, Sentinel-1 SAR, and so on. In the SAR images, water line usually shows the edge characteristic, so the edge detection based algorithms are the most commonly used in coastline extraction. The classical edge detection operators including Canny operator, Sobel operator, Roberts operator, Prewitt operator and Laplacian operator, and so on. The operators have some advantages such as simple, fast speed, but they always effected by speckle noise inherent in SAR images, as a result, they can not obtain accurate water line results. So noise is a major issue for the task of boundary detection by the SAR images. Instead of combating the noise, we use a technique for boundary detection in SAR images based on the statistical properties of speckled data. The G0 distribution is a special form of G model, its parameters are very sensitive to the surface roughness and succeeds in characterizing a wide range of areas as sea, mountain chain and urban areas in speckled images. And the parameters required for boundary detection is extracted with moment estimation. Moreover, relative to G distribution, G0 distribution does not include the complex Bessel function, and is a kind of simple statistical distribution model with less parameter. According to the estimated parameters of G0 distribution, the marine and land areas can accurately be separated. In order to extract the water linefrom SAR image, a G0 distribution based algorithm is proposed in the article. First, the domain of SAR image is divided into a set of sub-blocks with the same size, and the grayscales of pixels in each sub-block are assumed to be identical and independent G0 distribution. The roughness of each sub-block and scatter shot parameters of the distribution are obtained with moment estimation. By thresholding the roughness parameter, the rough sea area can be divided, and then its geometric center is determined. On the rays started at the geometrical center, the cut-off points between sea and land are located with likelihood function. Consequently, the water line is formed by linking all the cut-off points. To prove its feasibility, a process of water line extraction has been tested with simulated and real SAR images by the method. Qualitative and quantitative results show that the proposed method can extract water line from SAR image effectively and efficiently.
Keywords:
水边线是陆地和水域的交界线[1],由于人类活动和自然环境变化等影响,水边线不断变化,直接影响到人类对水域资源的开发和利用[2,3]。因此,实现快速、准确、实时的水边线监测有重要意义。合成孔径雷达(Synthetic Aperture Radar, SAR)因其全天候、全天时、不受烟尘、云雾限制等优点[4],已成为国土资源与环境调查中的重要技术手段。但由于SAR图像固有的斑点噪声[5],使得水边线难以准确判定。因此,利用SAR提取水边线是图像处理研究领域中的热点和难点。
SAR图像中水边线为即时水线,在图像中表现为边缘特征,所以图像边缘检测方法是SAR图像水边线提取最常见的方法。经典的边缘检测算子包括Canny算子、Sobel算子、Roberts算子、Prewitt算子和Laplacian算子等。虽然这些算子具有算法简单、运算速度较快等优点,但是对于含有大量斑点噪声的SAR图像,以上方法均不能取得较好的水边线提取结果[6]。
在乘积模型下建立斑点噪声的统计模型可以更好地描述SAR图像中像素强度或幅度的分布特性,常见的统计模型有Gamma分布和K分布[7]。Gamma分布参数估计容易,但只适合均匀区域的多视强度图像;K分布适合均匀、粗糙区域多视、单视强度、幅度图像,但其参数估计难。Frery等由乘性噪声模型推导出G0分布[8~13],其参数对被测区域的地表复杂程度十分敏感,不仅适合对均匀区域、粗糙区域及极度粗糙区域进行精确建模,且不包含复杂的Bessel函数,因此计算简单,是一种参数更少,更简单实用的统计分布模型[8],且对强度、幅度图像均适合。根据G0分布估计出的相关参数能够准确地刻画水域和陆地区域,并且可以从数据中获取更多的细节信息。
对幅度图像进行建模,已知SAR图像z={zi, i =1, 2, ..., N},其中,i为像素索引,zi为像素i的幅度,N为总像素数。在统计学的理论框架下,z可建模为随机场Z={Zi, i =1, 2, ..., N},其中,Zi为表征第i个像素点像素幅度的随机变量。本文利用G0分布建模SAR幅度图像的斑点噪声:
式中,n(取正整数)为有效视数;
G0分布的特点之一是参数
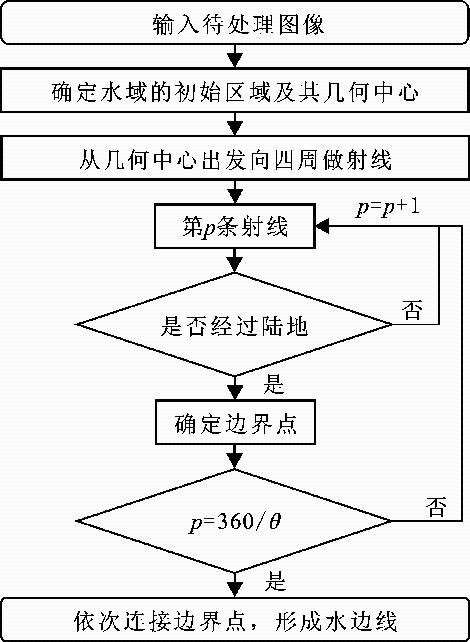
将图像划分为大小相等的子块,并假设每个子块都服从独立同一的G0分布;利用矩估计的方法估计出每个子块的粗糙度和散射性;给定阈值以划分粗略的水域,并确定该区域的几何中心;从几何中心向周围做射线,利用似然函数L确定每条射线上的水-陆分界点,并将其依次连接,从而实现SAR图像水边线提取。算法流程如图1所示。
1.2.1 划分粗略的水域
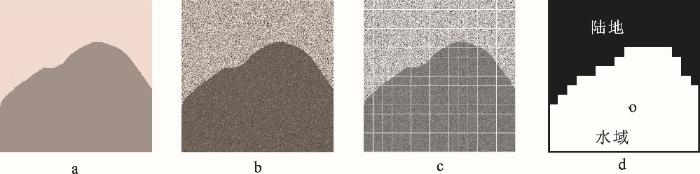
为了划分粗略的水域,需将图像分为大小相同的子块,并估计出子块的相关参数。生成一个512×512 像素大小的标准图像,如图2a所示。图2b为其对应的模拟高斯SAR图像,以较暗区域代表水域,以较亮区域代表陆地。将模拟图像划分成大小为64×64像素的子块,如图2c所示。通过矩估计求出每个子块的
式中,EG0()是矩的表达式,r(<-
式中,m1和m1/2分别表示1阶矩和1/2阶矩。根据(3)式求出每个子块的参数估计值。对γ设定阈值T,将γ估计值小于T的子块划分为水域。将子块的γ估计值图像恢复成原图像大小。对水域所覆盖像素的横纵坐标进行平均并取整,确定该区域的几何中心,记为o。如图2d所示,黑色表示陆地区域,白色表示水域,位置o表示水域的几何中心。
1.2.2 确定边界点
水-陆边界点所在像素周围区域的粗糙度和反射性存在较大变化。为了找到边界点,以几何中心o为起点,θ为2条相邻射线的间隔角度,向周围做射线。将第p条射线记为sp,1≤p≤360/θ,每条经过陆地区域的射线上都会有一个边界点。设sp由该射线经过的mp个点元素组成,记为sp=(z1, ..., zmp)。以第p条射线sp所经过每个像素的8邻域为样本,估计其参数值,记为该像素的参数值。αp表示第p条射线上所有像素的α值的集合,γp表示第p条射线上所有像素的γ值的集合,记αr= min (αp),γr= min (γp),αb=max(αp),γb=max(γp),参数(αr, γr)和(αb, γb)分别代表水域和陆地区域。为了判定每条射线上的水-陆边界点,引入下列似然函数[18]:
将参数(
似然函数L在水域和陆地区域增速不同,在水域增速较慢,即相邻两点L差值较小,在陆地区域增速快,即相邻两点的L差值较大,求出从1到j的平均增速为,
j到终点mp的平均增速为,
式中,L(mp) 表示第mp个像素似然函数L的值,L(j)表示第j个像素似然函数L的值。
当|vj1-vj2|达到最大时,第j个像素为水-陆边界点,确定该点的像素位置,记为射线sp上的边界点。重复上述操作,确定所有射线上的边界点,去除错误点,依次连接边界点,得出水边线。
为了验证本文算法的可行性与有效性,分别对模拟和真实SAR图像进行水边线提取实验。
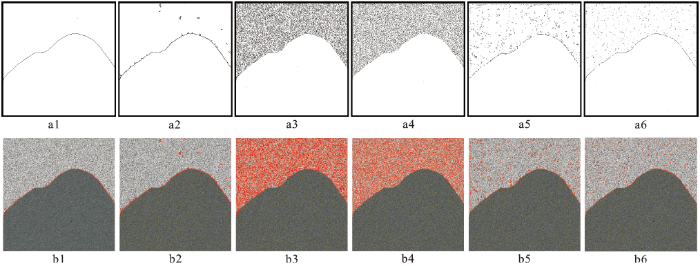
利用G0算法对模拟SAR图像(图2b)进行实验,并与其它5种常用的典型边缘提取算法进行对比,对比算法分别为:Canny算子、Sobel算子、Roberts算子、Qiu算法[19]、ROA算法[20]。图3a1~a6分别为基于上述6种算法的水边线提取结果二值图像,其中黑色像素为提取的边缘像素;图3b1~b6分别为对应提取的水边线(红色像素)与原图的叠加图。通过目视判读可以看到,本文算法的提取结果较好,有效克服了噪声影响,连续、准确地提出模拟SAR图像的水边线,结果与实际水边线高度吻合;Canny算子的实验结果稍差,水边线粗糙不连续,且周围有少量噪声;Sobel、Roberts算子、Qiu算法和ROA算法实验结果均有较多噪声,虽然增大阈值可以减少噪声,但是同时也加剧了水边线不连续现象,为此不可行。
图3 实验结果及原始图像叠加轮廓线结果
Fig.3 Experimental results and the result of superposition of original image contour line
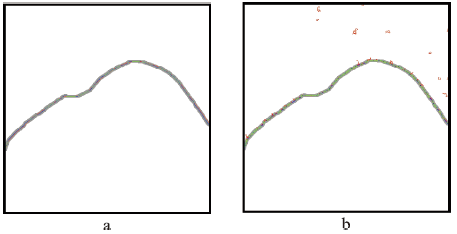
根据上述实验结果可知,本文算法和Canny算子的提取结果明显优于其它4种对比算法。为了进一步证明本文算法的有效性,分别对本文算法和Canny算子的提取结果进行精度评价。首先,对提取结果建立缓冲区,如图4所示,其中,图4a和b分别为本文算法和Canny算子实验结果的缓冲区分析示意图,图中红色表示算法提取结果,蓝色表示真实边缘,绿色表示实验结果与真实边缘的重合部分。然后,据此给出精度评价指标(见表1),B0、S0表示实验结果与真实边缘重合的点所占百分比,Bx(x =1, 2, 3)表示落在第x个缓冲区的点所占百分比,Sx表示落在前x缓冲区内的点的累加百分比。由表1可知,本文算法的最终结果与标准轮廓线重合率为48.01%,落在缓冲区内的点占51.99%;Canny算子的最终结果和原始轮廓线重合率为50.81%,落在缓冲区内的点共占25.37%,有23.82%的点在缓冲区以外的区域。由此进一步精确地证明了本文算法的有效性和准确性。
表1 缓冲区精度分析(%)
Table 1 Buffer precision evaluation
| 算法 | B0 / S0 | B1 / S1 | B2 / S2 | B3 / S3 |
|---|---|---|---|---|
| G0分布 | 48.01 / 48.01 | 42.03 / 90.04 | 9.42 / 99.46 | 0.54 / 100 |
| Canny算子 | 50.81 / 50.81 | 18.94 / 69.75 | 3.86 / 73.61 | 2.57 / 76.18 |
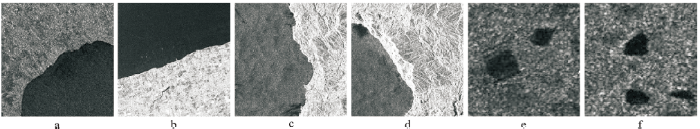
图5为6幅真实SAR图像,该组图像均为HH极化方式,其中,较亮区域为陆地,较暗区域为水域。图5a大小为512×512像素,分辨率为30 m×30 m,陆地区域有绿地和农作物。图5b、c、d大小为1 024×1 024像素,其中,图5b分辨率为30 m×30 m,陆地区域为城市;图5c、d分辨率为20 m×20 m,陆地区域多为山脉。图5e、f大小分别为256×256像素、128×128像素,分辨率均为30 m×30 m,均表示内陆水域。
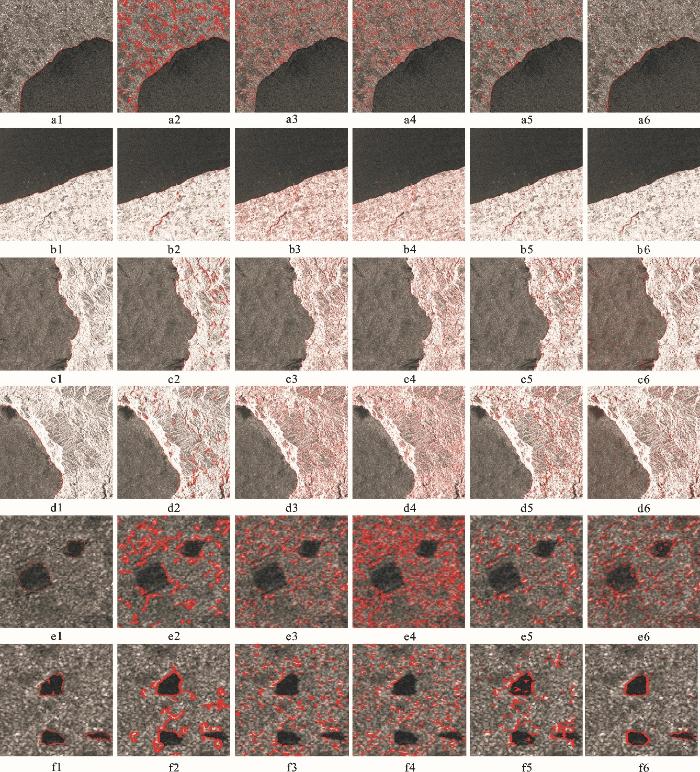
分别使用本文算法和5种对比算法对图5中6幅真实SAR图像进行实验。将水边线与原始图像叠加显示(图6)。能够更加直观地反应本文算法较其它5种对比算法的优越性。
当陆地区域为绿地和农作物,分布均匀,其灰度值与水域较为相近,粗糙度较为相似,本文算法根据水域与陆地的反射特性的不同,能够有效提取出水边线;Canny算子、ROA算法将陆地区域中与水域灰度值相似的地区(绿地)边缘误分为水边线,形成虚假水边线,导致提取结果较差;虽然ROA算法通过增大阈值减少了噪声,但是同时也加剧了真实水边线的不连续现象;Sobel算子、Roberts算子、Qiu算法结果基本不能够形成水边线,且存在大量虚假水边线,如图6a1~a6所示。当陆地区域为城市时,地物类型较为复杂,粗糙度较大,而水域粗糙度较小,且两者反射特性不同,所以本文算法提取结果较好,图中陆地区域的小突起也能够被有效区分;Canny算子和ROA算法通过调整阈值,可减少虚假水边线,结果稍好;Sobel算子、Roberts算子、Qiu算法调整阈值,形成水边线的同时,城市内部出现大量虚假水边线,结果较差,如图6b1~b6所示。当陆地区域为山脉时,山脊线两侧灰度值差异较大,背阳面与水域灰度值较为相似,目视上可能会误以为是海浪,而且水域有深有浅,明暗不一,但本文算法未受其影响,依然能够有效提取水边线;而其他对比算法法均将山脉背阳面误以为是水域,将山脊线误分为水边线,如图6c1~c6和d1~d6所示。此外,由于内陆水域周围地物分布复杂,噪声大,且陆地和水域边界较为模糊,本文算法综合其粗糙度及反射特性,能够实现水边线的有效提取;对比算法仅依据其灰度值,不能有效区分陆地与水域,导致提取结果极差,即使水域内干净无噪声时,也只有ROA算法结果相对较好,但依然不如本文算法,如图6e1~e6和f1~f6所示。
图6 轮廓线与原始图像叠加结果
注:a1~f1、a2~f2、a3~f3、a4~f4、a5~f5、a6~f6分别为本文算法、Canny算子、Sobel算子、Roberts算子、Qiu算法、ROA算法提取的水边线(红色像素)和原图的叠加图。
Fig.6 Results of original image outline overlay
综上所述,本文算法利用水域和陆地间粗糙度和反射性相差较大的特点,能够有效克服SAR图像中斑点噪声的影响,不受陆地区域地物类型变化的干扰,得出准确、连续的水边线。
利用本文算法分别对模拟和真实SAR图像进行水边线提取实验,并对其结果进行了定量和定性分析,以评价水边线提取精度。主要结论如下。
1) 水边线往往呈现非规则性,实验结果表明基于G0分布的水边线提取方法,能够较精准地提取这些非规则形态的水边线。
2) 由于受SAR图像固有斑点噪声和水岸其它地物的影响,传统边缘检测算法提取的水边线多呈现变形、不连续等现象;利用G0分布建立的SAR图像模型,可以有效估计水域及水岸地物的粗糙度和散射性参数,并能降低斑点噪声的影响。由于水域及水岸地物参数有显著的差异,因此划分结果受水岸地物的影响较小,进而可以有效地划分出水域和陆地,最终得到精准水边线。
3) 在提取的水边线基础上,可以进一步计算水域的面积、周长等特征,为有关部门的水域调查提供更多可靠的数据支持,因此提出算法具有重要理论意义和实用价值。
The authors have declared that no competing interests exist.
| [1] |
海岸线分类体系探讨 [J].Discussion on classification system of coastline. |
| [2] |
基于SVM的海岸线提取方法研究[D] .Coastline extraction using support vector machine from remote sensing image. |
| [3] |
海岸带的空间功能分区与管制方法——以宁波市为例 [J].https://doi.org/10.11821/dlyj201310011 URL Magsci [本文引用: 1] 摘要
海岸带空间资源的合理开发和利用关系到海洋经济发展质量和优质资源利用效率,成为影响沿海城市区域可持续发展的重要内容。根据区域自然、经济、社会特征,运用相关分区方法,划分海岸线和海岸带开发与保护的适宜性空间,获取较高的空间资源配置效率,成为地理学研究关注的热点。大部分学者从经济和生态两个方面要素构建指标体系,并对分区方法进行了有益探索和尝试,但是由于海岸带具有自然地理的特殊性,所以在指标选择上有较大不同。以宁波海岸带为例,讨论海岸线及海岸带的空间区划指标体系选择和方法应用问题。在借鉴已有区划方法的基础上,重点讨论评价单元划分、评价指标选择与处理等技术方法,在评价海岸线开发适宜基础上,做进一步的海岸带空间功能分区,将宁波市海岸带空间划分为生态空间、生产空间和生活空间,并结合宁波市空间开发现状,提出不同类型区域空间布局调整引导方向和管制要求。
Spatial function regionalization and spatial governance of the coastal zone: A case study in Ningbo City. https://doi.org/10.11821/dlyj201310011 URL Magsci [本文引用: 1] 摘要
海岸带空间资源的合理开发和利用关系到海洋经济发展质量和优质资源利用效率,成为影响沿海城市区域可持续发展的重要内容。根据区域自然、经济、社会特征,运用相关分区方法,划分海岸线和海岸带开发与保护的适宜性空间,获取较高的空间资源配置效率,成为地理学研究关注的热点。大部分学者从经济和生态两个方面要素构建指标体系,并对分区方法进行了有益探索和尝试,但是由于海岸带具有自然地理的特殊性,所以在指标选择上有较大不同。以宁波海岸带为例,讨论海岸线及海岸带的空间区划指标体系选择和方法应用问题。在借鉴已有区划方法的基础上,重点讨论评价单元划分、评价指标选择与处理等技术方法,在评价海岸线开发适宜基础上,做进一步的海岸带空间功能分区,将宁波市海岸带空间划分为生态空间、生产空间和生活空间,并结合宁波市空间开发现状,提出不同类型区域空间布局调整引导方向和管制要求。
|
| [4] |
利用SAR影像区域分割方法提取海洋暗斑特征 [J].https://doi.org/10.1329/j.cnki.sgs.2016.01.015 URL [本文引用: 1] 摘要
在SAR强度影像中,包括海洋溢油在内的许多海洋现象呈现为暗斑。为从诸多暗斑中辨识海洋溢油,需要在SAR影像中提取暗斑的几何和统计分布特征,以此作为进一步分类(辨识)海洋溢油的依据,将基于几何划分技术的区域分割方法应用于SAR影像暗斑特征提取。首先建立高分辨率SAR影像暗斑或然率模型,然后利用最大化期望值和M-H算法实现其几何及统计分布特征参数提取。实验结果表明,该方法不仅可以精准提取暗斑的几何形状,同时还能有效估计其统计分布参数。
Feature extraction of dark spot based on the SAR image segmentation. https://doi.org/10.1329/j.cnki.sgs.2016.01.015 URL [本文引用: 1] 摘要
在SAR强度影像中,包括海洋溢油在内的许多海洋现象呈现为暗斑。为从诸多暗斑中辨识海洋溢油,需要在SAR影像中提取暗斑的几何和统计分布特征,以此作为进一步分类(辨识)海洋溢油的依据,将基于几何划分技术的区域分割方法应用于SAR影像暗斑特征提取。首先建立高分辨率SAR影像暗斑或然率模型,然后利用最大化期望值和M-H算法实现其几何及统计分布特征参数提取。实验结果表明,该方法不仅可以精准提取暗斑的几何形状,同时还能有效估计其统计分布参数。
|
| [5] |
极化SAR图像自适应增强Lee滤波算法 [J].精制极化Lee滤波算法以其简单、高效、健壮等优点在极化SAR图像处理解译中得到了广泛的应用。然而,此滤波算法存在明显的缺陷:扇贝效应和虚假细线。对此,本文提出增加一组均匀窗口及一组线性方向窗口,并采用大小自适应窗口机制,在同质度高的区域用大窗口滤波,在同质度低的区域用小窗口滤波,从而使得滤波窗口在形状和尺寸上都能自动适应实际场景。利用机载和星载全极化SAR数据进行的滤波实验结果表明,本文提出的自适应增强Lee滤波算法在同质区域的噪声抑制能力明显优于精制极化Lee滤波算法及改进的Sigma滤波算法,同时在保持点、线等细节信息方面也优于精制极化Lee滤波算法,并且能很好的保持图像中地物的极化散射信息。 An adaptive enhanced Lee speckle filter for polarimetric SAR image. 精制极化Lee滤波算法以其简单、高效、健壮等优点在极化SAR图像处理解译中得到了广泛的应用。然而,此滤波算法存在明显的缺陷:扇贝效应和虚假细线。对此,本文提出增加一组均匀窗口及一组线性方向窗口,并采用大小自适应窗口机制,在同质度高的区域用大窗口滤波,在同质度低的区域用小窗口滤波,从而使得滤波窗口在形状和尺寸上都能自动适应实际场景。利用机载和星载全极化SAR数据进行的滤波实验结果表明,本文提出的自适应增强Lee滤波算法在同质区域的噪声抑制能力明显优于精制极化Lee滤波算法及改进的Sigma滤波算法,同时在保持点、线等细节信息方面也优于精制极化Lee滤波算法,并且能很好的保持图像中地物的极化散射信息。 |
| [6] |
遥感和GIS支持下的九段沙岸线提取及变迁研究 [J].Shoreline extraction and change analysis of the Jiuduansha islands with the support of remote sensing and GIS technologies. |
| [7] |
SAR图像目标ROI自动获取技术研究[D] .The research on automatic acquirement of target’s ROI from SAR imagery. |
| [8] |
A model for extremely heterogeneous clutter [J].https://doi.org/10.1109/36.581981 URL [本文引用: 2] 摘要
Abstract A new class of distributions, G distributions, arising from the multiplicative model is presented, along with their main properties and relations. Their densities are derived for complex and multilook intensity and amplitude data. Classical distributions, such as K, are particular cases of this new class. A special case of this class called G0, that has as many parameters as K distributions, is shown able to model extremely heterogeneous clutter, such as that of urban areas, that cannot be properly modeled with K distributions. One of the parameters of this special case is related to the degree of homogeneity, and a limiting case is that of a scaled speckle. The advantage of the G 0 distribution becomes evident through the analysis of a variety of areas (urban, primary forest and deforested) from two sensors
|
| [9] |
The polarimetric G distribution for SAR data analysis [J].https://doi.org/10.1002/env.658 URL 摘要
Remote sensing data, and radar data in particular, have become an essential tool for environmental studies. Many airborne polarimetric sensors are currently operational, and many more will be available in the near future including spaceborne platforms. The signal-to-noise ratio of this kind of imagery is lower than that of optical information, thus requiring a careful statistical modelling. This modelling may lead to useful or useless techniques for image processing and analysis, according to the agreement between the data and their assumed properties. Several distributions have been used to describe synthetic aperture radar (SAR) data. Many of these univariate laws arise by assuming the multiplicative model, such as Rayleigh, square root of gamma, exponential, gamma, and the class of I distributions. The adequacy of these distributions depends on the detection (amplitude, intensity, complex, etc.), the number of looks, and the homogeneity of the data. In Frery et al. (1997), another class of univariate distributions, called , was proposed to model extremely heterogeneous clutter, such as urban areas, as well as other types of clutter. This article extends the univariate family to the multivariate multi-look polarimetric situation: the p law. The new family has the classical polarimetric multi-look p distribution as a particular case, but another special case is shown to be more flexible and tractable, while having the same number of parameters and fully retaining their interpretability: the law. The main properties of this new multivariate distribution are shown. Some results of modelling polarimetric data using the distribution are presented for two airborne polarimetric systems and a variety of targets, showing its expressiveness beyond classical models. Copyright 漏 2004 John Wiley & Sons, Ltd.
|
| [10] |
Approximation of distributions for SAR images: proposal, evaluation and practical consequences [J].URL 摘要
ABSTRACT Data from a coherent illumination system like a Synthetic Aperture Radar (SAR) can be modelled by the multiplicative model. This model explains the characteristics of these data. The multiplicative model states that, under certain conditions, the constructive and destructive interferences of the incident and reflected signals give a return that varies, in a random manner, with the mean value of the backscatter corresponding to the illuminated target. The K distributions have been widely used to model data comming from a coherent illumination system, in particular for SAR images. These distributions allow us to model homogeneous as well as heterogeneous data. Given the need of finding a model for extremely heterogeneous data, a new class of distributions, the G distributions and a particular case the GA0 distributions have been recently proposed. These distributions model urban area very well, while K distributions do not fit this type of data. In this work, the feasibility of substituting the GA0 distribution for the KA distribution is studied and the practical usefulness of doing this will be shown. Once this fact is established, it will be possible to consider SAR images under the GA0 model only.
|
| [11] |
Classification of SAR images using a general and tractable multiplicative model [J].https://doi.org/10.1080/0143116021000053274 URL 摘要
Among the frameworks for Synthetic Aperture Radar (SAR) image modelling and analysis, the multiplicative model is very accurate and successful. It is based on the assumption that the observed random field is the result of the product of two independent and unobserved random fields: X and Y. The random field X models the terrain backscatter and, thus, depends only on the type of area to which each pixel belongs. The random field Y takes into account that SAR images are the result of a coherent imaging system that produces the well-known phenomenon called speckle noise, and that they are generated by performing an average of n statistically independent images (looks) in order to reduce the noise effect. There are various ways of modelling the random field X; recently the Γ611/2(α, γ) distribution was proposed. This, with the usual Γ1/2(n, n) distribution for the amplitude speckle, resulted in a new distribution for the return: the (α, γ, n) law. The parameters α and γ depend only on the ground truth, and n is the number of looks. The advantage of this distribution over the ones used in the past is that it models very well extremely heterogeneous areas like cities, as well as moderately heterogeneous areas like forests and homogeneous areas like pastures. As the ground data can be characterized by the parameters α and γ, their estimation in each pixel generates parameter maps that can be used as the input for classification methods. In this work, moment estimators are used on simulated and on real SAR images and, then, a supervised classification technique (Gaussian maximum likelihood) is performed and evaluated. Excellent classification results are obtained.
|
| [12] |
Feature extraction in speckled imagery using dynamic B-spline deformable contours under the model [J].https://doi.org/10.1080/01431160600702616 URL 摘要
This article proposes a technique for boundary detection in speckled imagery based on active contours and on the statistical properties of speckled data. Synthetic Aperture Radar (SAR), sonar, B‐ultrasound and laser imagery is corrupted by a signal‐dependent non‐additive noise called speckle. Many statistical models have been proposed to describe this noise, aiming at the development of specialized techniques for image improvement and analysis. The distribution is a statistical model that succeeds in describing a wide range of areas as, for instance in SAR data, pastures (smooth), forests (rough) and urban (extremely rough) areas. In order to determine boundaries between different areas, dynamic B‐splines are proposed in this paper. The algorithm automatically finds seeds and regions boundaries by a decision rule based on the estimation of the parameters of the law. The proposed algorithm is tested on synthetic and real SAR images, and both the accuracy and the performance of the proposal are assessed.
|
| [13] |
Accuracy of edge detection methods with local information in speckled imagery [J].https://doi.org/10.1007/s11222-007-9034-y URL [本文引用: 2] 摘要
We compare the accuracy of five approaches for contour detection in speckled imagery. Some of these methods take advantage of the statistical properties of speckled data, and all of them employ active contours using B-spline curves. Images obtained with coherent illumination are affected by a noise called speckle, which is inherent to the imaging process. These data have been statistically modeled by a multiplicative model using the G0 distribution, under which regions with different degrees of roughness can be characterized by the value of a parameter. We use this information to find boundaries between regions with different textures. We propose and compare five strategies for boundary detection: three based on the data (maximum discontinuity on raw data, fractal dimension and maximum likelihood) and two based on estimates of the roughness parameter (maximum discontinuity and anisotropic smoothed roughness estimates). In order to compare these strategies, a Monte Carlo experience was performed to assess the accuracy of fitting a curve to a region. The probability of finding the correct edge with less than a specified error is estimated and used to compare the techniques. The two best procedures are then compared in terms of their computational cost and, finally, we show that the maximum likelihood approach on the raw data using the G0 law is the best technique.
|
| [14] |
Improving estimation in speckled imagery [J].https://doi.org/10.1007/BF02741311 URL [本文引用: 1] 摘要
We propose an analytical bias correction for the maximum likelihood estimators of the G 1 0 distribution. This distribution is a very powerful tool for speckled imagery analysis, since it is capable of describing a wide range of target roughness. We compare the performance of the corrected estimators with the corresponding original version using Monte Carlo simulation. This second-order bias correction leads to estimators which are better from both the bias and mean square error criteria.
|
| [15] |
Analog estimation methods in econometrics [J].https://doi.org/10.1017/S0266466600005132 URL |
| [16] |
M-estimators with asymmetric influence functions: The distribution case [J].https://doi.org/10.1080/10629360600569154 URL [本文引用: 1] 摘要
Many applications consecrate the use of asymmetric distributions, and practical situations often require robust parametric inference. This paper presents the derivation of M-estimators with asymmetric influence functions, motivated by the distribution. This law, regarded as the universal model for speckled imagery, can be highly skewed and maximum likelihood estimation can be severely hampered by small percentages of outliers. These outliers appear mainly because the hypothesis of independence and equal distribution of observations are seldom satisfied in practice; for instance, in the process of filtering, some pixels within a window frequently come from regions with different underlying distributions. Traditional robust estimation methods, on the basis of symmetric robustifying functions, assume that the distribution is symmetric, but when the data distribution is asymmetric, these methods yield biased estimators. Empirical influence functions for maximum likelihood estimators are computed, and based on this information we propose the asymmetric M-estimator (AM-estimator), an M-estimator with asymmetric redescending functions. The performance of AM estimators is assessed, and it is shown that they either compete with or outperform both maximum likelihood and Huber-type M-estimators.
|
| [17] |
基于EM算法的G0分布参数最大似然估计 [J].https://doi.org/10.3969/j.issn.0372-2112.2013.01.031 URL Magsci [本文引用: 1] 摘要
G0分布是目前合成孔径雷达(Synthetic Aperture Radar,SAR)图像数据建模的一个重要模型,建模能力强、实用性好,受到了广泛的关注.G0分布的应用离不开准确有效的参数估计,而由于G0分布表达式复杂,统计意义上最优的最大似然估计法一直没能用在G0分布上.本文首先给出了一种新的方式来推导得出G0分布,在此基础上,采用最大期望(Expectation Maximization,EM)算法为G0分布给出一种有效的最大似然参数估计方法.文中的方法与现有的G0分布参数估计方法通过实验进行了比较,实验结果充分证明了所提方法的有效性.
An EM algorithm based maximum likelihood parameter estimation method for the G0 distribution .https://doi.org/10.3969/j.issn.0372-2112.2013.01.031 URL Magsci [本文引用: 1] 摘要
G0分布是目前合成孔径雷达(Synthetic Aperture Radar,SAR)图像数据建模的一个重要模型,建模能力强、实用性好,受到了广泛的关注.G0分布的应用离不开准确有效的参数估计,而由于G0分布表达式复杂,统计意义上最优的最大似然估计法一直没能用在G0分布上.本文首先给出了一种新的方式来推导得出G0分布,在此基础上,采用最大期望(Expectation Maximization,EM)算法为G0分布给出一种有效的最大似然参数估计方法.文中的方法与现有的G0分布参数估计方法通过实验进行了比较,实验结果充分证明了所提方法的有效性.
|
| [18] |
Cribari-Neto F, de Souza M O. Analysis of minute features in speckled imagery with maximum likelihood estimation [J].https://doi.org/10.1155/S1110865704002732 URL [本文引用: 1] |
| [19] |
Image processing and jump regression analysis [J].https://doi.org/10.1198/tech.2006.s395 URL [本文引用: 1] 摘要
Abstract Recent statistical tools developed to estimate jump curves and surfaces have broad applications, specifically in the area of image processing. Often, significant differences in technical terminologies make communication between the disciplines of image processing and jump regression analysis difficult. In easy-to-understand language, Image Processing and Jump Regression Analysis builds a bridge between the worlds of computer graphics and statistics by addressing both the connections and the differences between these two disciplines. The author provides a systematic analysis of the methodology behind nonparametric jump regression analysis by outlining procedures that are easy to use, simple to compute, and have proven statistical theory behind them. Key topics include: Conventional smoothing procedures Estimation of jump regression curves Estimation of jump location curves of regression surfaces Jump-preserving surface reconstruction based on local smoothing Edge detection in image processing Edge-preserving image restoration With mathematical proofs kept to a minimum, this book is uniquely accessible to a broad readership. It may be used as a primary text in nonparametric regression analysis and image processing as well as a reference guide for academicians and industry professionals focused on image processing or curve/surface estimation.
|
| [20] |
A statistical and geometrical edge detector for SAR images [J].https://doi.org/10.1109/36.7708 URL [本文引用: 1] 摘要
A constant-false-alarm-rate (CFAR) edge detector based on the ratio between pixel values is described. The probability distribution of the image obtained by applying the edge detector is derived. Hence, the decision threshold can be theoretically det...
|

/
| 〈 |
|
〉 |