应小宇 , 阚琪
, 阚琪
Ying Xiaoyu, Kan Qi
中图分类号: TU201.1
文献标识码: A
文章编号: 1000-0690(2018)12-2093-07
收稿日期: 2017-11-25
修回日期: 2018-03-14
网络出版日期: 2018-12-20
版权声明: 2018 《地理科学》编辑部 本文是开放获取期刊文献,在以下情况下可以自由使用:学术研究、学术交流、科研教学等,但不允许用于商业目的.
基金资助:
作者简介:
作者简介:应小宇(1980-),男,浙江杭州人,博士,副教授,主要从事城市风环境研究。E-mail:Evanyxy@qq.com
展开
摘要
利用基于计算流体力学(CFD)理论的数值模拟软件,在不影响街道连续性面貌的前提下,通过控制变量法分别改变街道贴线率、街道界面密度、街道高宽比3个关键要素的数值来观察街道风环境的变化情况。结论主要有: 街道内的风速大小随着街道贴线率的增大呈抛物线趋势变化,先增大后减小,在街道贴线率接近70%时,城市街道内风速达到最大; 随着界面密度的不断减小,城市街道内各个测点的风速变化的幅度越来越大,这样会让在其中行走的行人感受到强烈的风速变化,舒适度大为下降; 城市街道内的平均风速和街道高宽比成反比例关系。
关键词:
Abstract
With a rapid urbanization in Asia, the high-density new urban-center districts have already changed the microclimate in the city. Because of the using characters of building, the commercial streets which have emerged massively making a large number of pedestrians appear, pedestrian comfort in the commercial streets of the new urban-center districts requires more attention. Different street spatial layout will lead to change the internal wind environment in it and then affect the pedestrian comfort. Computational fluid dynamics (CFD) models are used to study the correlation between the three main street spatial layout factors, which are near-line rate, street interface density and street aspect ratio, under the simulation of relevant weather conditions. The results are mainly the following three points, first, the wind speed within the street change with the increase in the near-line rate like a parabola trend, and the wind speed reaches its peak about at a near-line rate of 70%. In that cases, it’s conducive to ventilation. Second, as the street interface density decreases, the variation of the wind speed of each measuring point in the city streets is getting bigger and bigger, and then the pedestrian walking in it will feel a strong wind speed change and the comfort is greatly reduced. Thirdly, the wind speed in the city streets is inversely proportional to the street aspect ratio. These conclusions will provide an important reference and evaluation basis for urban designers at the beginning of the design to effectively avoid future wind environmental problems.
Keywords:
随着中国城市化进程的快速推进,中国的城市建设处于持续的巨变之中,城市中心区建设逐步进入一个高速发展期。楼房林立、人口密集的城市新建中心区,开始进入人们的日常生活之中,极大的改变了人们生活的城市微气候。风是城市微气候的重要影响因素[1]。城市新建中心区的高层建筑群,将直接影响城市冠层的气流运动,加剧了近地面处的气流运动,使建筑周围形成下冲流、上冲流、角流等,并可能造成局部气流加速,形成一定的涡流区、静风区或疾风区,从而影响到人们的舒适、健康与出行安全[2, 3]。以往的规划设计中,城市规划师和建筑师更多得将精力放在形式和功能上,而忽略了室外风环境的设计,从而导致很多潜在的风害发生[4],例如峡谷效应、分离涡群、静风区、尾流区、风洞效应,并且直接影响城市气候。夏热冬冷地区的城市新建中心区需要风环境相关规划策略。清华大学江亿教授在2006年的《中国绿色建筑报告》中指出,夏热冬冷地区的节能措施的重点为夏季的遮阳和通风,春秋季利用自然通风[5]。对于夏热冬冷地区而言,其设计策略应兼顾两季的巨大气候差异。
物理环境指标的五大指标,分别为通风、采光、温度、湿度和辐射。其中,建筑群体的体积、形状和建筑物的错落、起伏还有街道及外部环境的空间布局形式直接影响空气流动的速度和方向[6]。而且,风环境可以评价不同尺度的城市空间布局类别。在一般的规划和建筑设计中,城市空间布局的内容从大尺度到小尺度可分为3个类别:城市空间规划、建筑群布局、单体建筑间距关系。对于不同尺度的设计工作,例如城市空间规划、建筑群布局等,风环境评价是个有效的评价工具[7]。
街道对于城市非常重要[8],由于城市商业街道的建筑使用性质,使得其步行人数众多,因此城市中心区商业街道行人舒适度的问题日渐收到关注[9]。而风环境对于街道行人舒适度的影响又是至关重要的,适宜的风速风向会显著提高行人在街道上行走的舒适度,进而吸引更多行人参与进街道空间,提升城市街道的活力。
在城市设计领域,与街道空间布局相关的主要有3个要素:街道贴线率、界面密度、街道高宽比[10]。目前,街道贴线率的研究主要集中在街道贴线率的概念确定,和街道贴线率在实际设计项目中的应用 [11,12,13,14,15,16]。
总体来讲,目前对于步行街道空间布局要素的研究主要还停留在概念层面,以及对此要素单独的分析和评价,尚没有将这几个因素与建筑风环境的评价相结合,因此,相关性研究成果无法满足城市设计中街道空间布局的复杂性和多样性。
本文将通过比较当这些相关因素变化时,街道在行人高度下的风速,得出在不影响城市街道连续性面貌的前提下,街道贴线率、界面密度、街道高宽比分别和城市街道风环境的相关性,期望为城市设计者在设计之初提供一个重要的参考和评价依据,有效的避免未来可能出现的街道内空气污染物聚集等风环境问题,从规划设计的角度采取措施来优化方案,将有助于建立良好的城市微气候[17]。
杭州市地处夏热冬冷地区,具有典型的气候特征。此地区的人们在室外活动的时间较长,因此研究该地区的室外风环境,对提高该地区街道行人的舒适度起着至关重要的作用。本文通过对杭州市的街道进行调研考察,统计大量城市街道得出出现频次最高的建筑单体沿街立面宽度、高度与街道宽度。鉴于相同面宽的建筑随着进深增加、几何形态变化,建筑迎风面处风速和流场基本不受形态影响[18],本文只考虑统计得出的出现频率最高的建筑形态,进而总结出典型的商业街道模式,这样具有一定的普遍适用性。
本文中所采用的数值模拟软件Phoenics是基于雷诺时均方程开发的,计算所需条件采用软件自带的自动选取功能[19]。初始风的设定如下所述:由于地表摩擦的作用,接近地表的风速随着离地高度的减小而降低。只有离地300~500 m 以上的地方,风速才不受地表的影响,可以在大气梯度的作用下自由流动。因此,来流面风速的变化规律以指数率表示为:
U(z)= UG ×(z/zG)α (1)
式中,U(z)为任意高度z处的平均风速,UG是标准高度zG处的平均风速,指数α为描述地面粗糙度的参数。模拟中标准高度zG设定为400 m,该高度处平均风速UG为13 m/s,α为0.25。湍流强度假定为地面52 m以上12%[20]。
建筑群中交通干道方向与风向相同时会使该交通干道内风速加大,交通干道方向与风向垂直时则该交通干道的风速比较小。此外,交通干道方向与风的夹为45°时,建筑群内风速较为均匀[21]。由此说明,街道方向与风向相同或垂直时,方向这个因子对风速的影响作用明显,在这两种情况下研究公共建筑的排布对风速的影响作用不大。然而,当街道方向与风向夹角为45°时,由于风速稳定均匀,方向这个因子对街道风速的影响较小,故在这种情况研究公共建筑围合的街道轮廓的形态因子,比较适合[22]。为了让模拟结果更直观,风速大小取杭州市冬季较大风速10 m/s进行模拟。
《建筑间距和退距管理技术规定》第三条规定,非居住建筑的间距,除经批准的详细规划另有规定外应符合下列规定多层平行布置时,其间距不小于较高建筑高度的1.0倍,并不小于6 m;垂直布置时,其间距不小于9 m,山墙间距不宜小于6 m。根据以上规定,本文模型中建筑间距大于或等于6 m。
绿色建筑设计标准[23]中规定:建筑覆盖区域小于整个计算域面积3%;以目标建筑为中心,半径 5H 范围内为水平计算域。建筑上方计算区域要大于3H,其中H 为建筑主体高度,因此本文中模拟区域大小为1 200 m×600 m×100 m。由于本文只研究商业街道内部的风环境,为使模拟结果更具有倾向性,不考虑街区外界环境的影响,因此模拟区域只建立典型的商业街道模式简化模型。
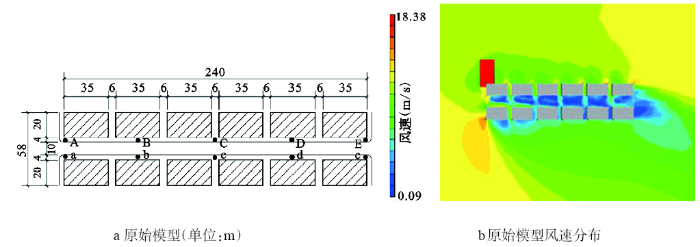
据此建立以下原始模型并得到原始模拟图像(图1),并分别选取了北侧人行道A、B、C、D、E5个点,与南侧人行道a、b、c、d、e5个点作为测点。
为了应对街道界面围合感较低和城市形态不饱满的现状,形成更加完整的城市形态和恢复城市街道围合感,上海市城市规划部门对城市新建区域街道进行强制街道贴线率规定[24],用以规范街道界面。特定街道的两侧城市地块中,紧贴红线的建筑立面所构成的街墙立面长度与建筑控制线长度的比值,被称为街道贴线率[24],即:街道贴线率(P)=街墙立面线长度(B)÷建筑控制线长度(L)×100%。
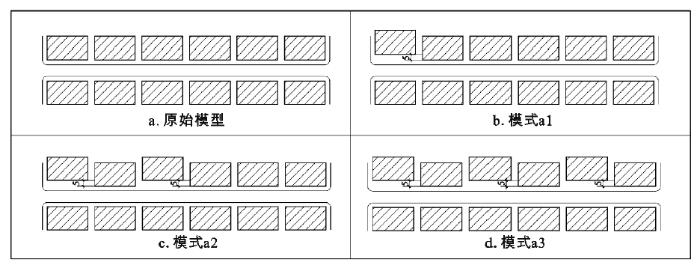
这组模拟实验一共选取了4种不同的街道贴线率,分别是100%(原始模型),85%(模式a1),70%(模式a2),55%(模式a3)。建筑后退距离为5 m,得到以下街道空间布局(图2)。
街道界面的围合程度可用现有的“界面密度”来衡量:界面密度是指街道一侧建筑物沿街道投影总面宽(N)与该段街道的长度(M)之比[15]。界面密度显然取决于围合街道的建筑物的多寡,而进一步与街区建筑密度相联系。
据此建立以下模型(图3),减少下风处建筑的数量,以达到减少界面密度的目的。界面密度的取值分别为87.5%(原始模型),73%(模式b1),58%(模式b2),43%(模式b3)。
图3 不同界面密度对应的街道空间布局
Fig.3 The layout types of different street interface density
街道高宽比指的是将街道的宽度设为D,街道两侧建筑外墙的高度设为H,两者之间的比值H:D。通过对传统街道两侧建筑高度和空间宽度的比值(H:D)和视觉作分析比较,可以看出不同的比值会引起不同的心理反应。一般而言,1.5∶1~1∶2的高宽比较为宜人;商业街道可适度紧凑,较窄的商业街高宽比可达到3∶1;交通性街道和综合性街道两侧可适度开敞,高宽比可控制在1∶1~1∶2[16]。
因此,建立4个模型(图4),分别对应高宽比为2∶1(模式c1),1.5∶1(模式c2),1∶1.5(模式c3),1∶2(模式c4)4种情况,并且和高宽比为1∶1的原始模型同时比较。
图4 不同街道高宽比对应的街道空间布局
图中数字单位为m
Fig.4 The layout types of different street aspect ratios
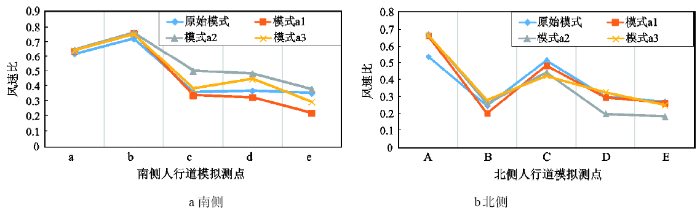
由模拟结果(图5)可以看出,在街道贴线率不断变化的情况下,a、b测点风速比变化不明显,较为稳定,a、b测点是南侧人行道上的模拟测点,大致位于来风口的非风影区。并且在模式a2街道贴线率为70%的模拟条件下,各个点的风速比都较其他模拟条件高一些,因此可初步推断街道贴线率为70%时,城市街道内风速较大,有利于通风和空气质量更新。
图5 人行道模拟测点的风速比
Fig.5 The wind velocity ratio on the measure points on the sidewalk
综合南侧人行道和北侧人行道两组测点的模拟数据可以看出,在街道贴线率不断变化的情况下,各个测点风速比的变化幅度均不是很明显,而每个测点的风速比却表现出稳定的差异性,这说明,在其他条件均稳定不变的前提下,街道贴线率的变化并不会造成街道内风环境的变化,影像街道内不同位置的风环境有差异性的原因主要还是所处区域位置不同。
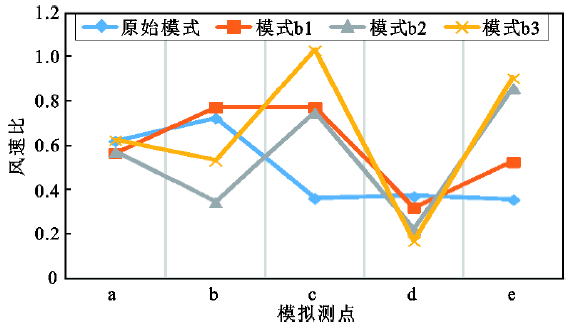
北侧测点由于北侧界面密度的变化,失去了测量的意义,此处仅对南侧测点进行分析。由模拟结果(图6)可以看出,在原始模式(界面密度为87.5%)的风环境模拟条件下,城市街道内各个测点的风速比波动幅度最小,在模式b3(界面密度为43%)的风环境模拟条件下,城市街道内各个测点的风速比波动幅度最大。
图6 南侧人行道模拟测点的风速比
Fig.6 The wind velocity ratio of the measure points on the south sidewalk
为了使模拟试验数据更加直观准确,将各个测点的风速做了方差统计,并得出不同模式下测点风速变化波动幅度的折线图(图7),可直观的看出随着界面密度的不断减小,城市街道内各个测点的波动幅度越来越大,这样会让在街道中行走的行人感受到强烈的风速变化,导致其舒适度大为下降。
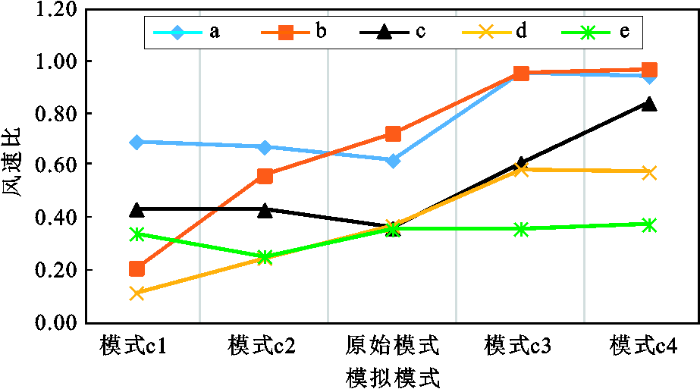
由模拟结果(图8)可以看出,随着街道的高宽比的减少,街道内各个测点的风速比也都逐渐增大,通过这种趋势,可以大胆的推断出,城市街道内的风速比和街道高宽比成反比例关系。因此要有意识的控制街道高宽比,尽量避免城市街道内的风速过大或过小。北侧测点由于街道宽度的变化,失去了测量的意义,此处仅对南侧测点进行分析。
图8 南侧人行道模拟测点的风速比
Fig.8 The wind velocity ratio of the measure points on the south sidewalk
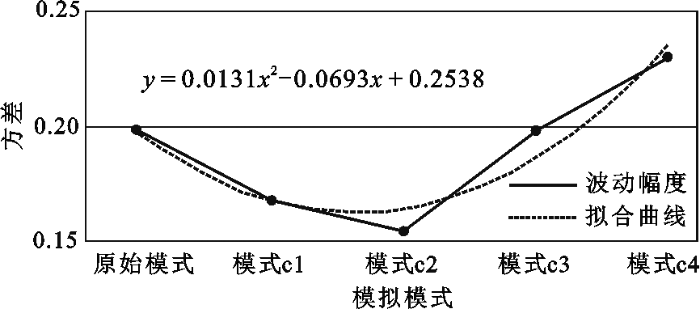
为了使模拟试验数据更加直观准确,将各个测点的风速做了方差统计,试图将其与街道高宽比联系起来,并得出不同街道高宽比模式下测点风速变化波动幅度的折线图(图9)。通过计算散点分布情况,然后进行曲线拟合,可以得到街道高宽比x与不同街道高宽比模式下测点风速变化波动幅度(方差)y之间的曲线。曲线公式为:
y = 0.1305x2-0.6931x + 2.5376 (2)
曲线表明,y值先随着x值增大而减小。当x= 2.6时,y值达到最小值1.62。随后,当x值继续增大,y值随之缓慢增大。因此可以初步推断,在高宽比为的值接近1∶1时,街道内的风环境变化幅度最小最稳定,进而给行人提供更舒适的外部空间环境。
通过计算机模拟方式,分别改变了街道贴线率、界面密度、街道高宽比的数值,将模拟得到的风环境进行对比分析,得出城市步行街道空间布局的这3个要素与街道风环境的相关性。具体结论如下:
1) 综合城市商业街道空间布局的3个要素来看,根据当要素的大小发生变化时,各个测点相对应的风速比变化可以看出,界面密度这一要素对于街道风环境的影响最为明显。随着界面密度的不断减小,城市街道内各个测点的波动幅度越来越大,这样会让在街道中行走的行人感受到强烈的风速变化,导致其舒适度大为下降。
2) 在其他条件均稳定不变的前提下,街道贴线率的变化并不会造成街道内风环境的变化,影像街道内不同位置的风环境有差异性的原因主要还是所处区域位置不同。当街道贴线率为70%时,城市街道内风速较大,有利于通风和空气质量更新。
3) 随着街道的高宽比的减少,街道内各个测点的风速比也都逐渐增大,大致呈反比例关系。在高宽比为的值接近1∶1时,街道内的风环境变化幅度最小最稳定,进而给行人提供更舒适的外部空间环境。
虽然本研究发现了风环境与街道空间布局之间的关系,但还缺乏对街道空间布局其他方面的研究。例如,容积率,景观绿化等。并且,由于模拟模型数量有限,结果会有不可避免地具有一些局限。本研究结果明确了未来对街道空间布局更广的研究范围,在未来的研究中会进一步进行实验模拟,从而对街道空间布局规划进行更全面的指导。
The authors have declared that no competing interests exist.
| [1] |
Computational wind engineering: Past achievements and future challenges [J].https://doi.org/10.1016/S0167-6105(97)00097-4 URL [本文引用: 1] 摘要
The paper reviews the current state of the art in computational wind engineering, particularly as it relates to applications of numerical flow modelling for the evaluation of wind effects on buildings and their environment. The variability of computational results is presented and compared with that of wind tunnel measurements. Concerns are expressed regarding the current application of the numerical approach in the design practice in cases for which the computational results may not be adequate. Future challenges regarding the improvement of computational wind engineering methodologies are discussed and the importance of identifying resolution and numerical errors is emphasized.
|
| [2] |
Wind tunnel experiments on how thermal stratification affects flow in and above urban street canyons [J].https://doi.org/10.1016/S1352-2310(99)00410-0 URL [本文引用: 1] 摘要
The effects of atmospheric stability on flow in urban street canyons were studied using a stratified wind tunnel. We conducted experiments using a model that represented city streets with simply shaped block forms, while varying atmospheric stability across seven stages from stable ( Rb=0.79) to unstable ( Rb=610.21). We used a laser Doppler anemometer (LDA) and a cold wire to measure the flow field and temperature within and above the street canyon. In addition to mean values of wind speed components and temperatures, we measured turbulence intensity, shear stress, and heat flux distribution. Our results led to the following conclusions: Cavity eddies that arose in the street canyon tended to be weak when the atmosphere was stable and strong when unstable. Stable atmospheric conditions led to a positive feedback effect in which the downward flow into the street canyon weakened due to buoyancy, which facilitated the formation of a more highly stable stratification. As a result, when stability exceeded a certain threshold (somewhere in the range of Rb=0.4–0.8), the wind speed in the street canyon dropped nearly to zero.
|
| [3] |
中国沿海地区近20年台风灾害风险评价 [J].
The risk assessment method of typhoon disasters was proposed according to the nature disaster system theory and considering the characteristics of hazard factor and bearing body. And in the GIS environment the hazard, vulnerability and risk of typhoon disasters in China coastal area were assessed. The assessment result showed that the hazard of typhoon disaster is higher in Hainan Province, Shanghai and the coastal areas of Guangdong, Fujian, Zhejiang provinces. The vulnerability of bearing body is higher in Beijing, Tianjin, Shanghai, the most parts of Jiangsu, Shandong provinces, and the coastal areas of Guangdong, Fujian, Zhejiang, Hebei Provinces. The risk of typhoon disaster is higher in Hainan Province, Shanghai and the coastal areas of Guangdong, Fujian, Zhejiang provinces, while in Beijing, Tianjin and the the most parts of Hebei, Liaoning, Shandong provinces, it is lower the risk.
Risk assessment of typhoon disasters in China coastal area during last 20 years .
The risk assessment method of typhoon disasters was proposed according to the nature disaster system theory and considering the characteristics of hazard factor and bearing body. And in the GIS environment the hazard, vulnerability and risk of typhoon disasters in China coastal area were assessed. The assessment result showed that the hazard of typhoon disaster is higher in Hainan Province, Shanghai and the coastal areas of Guangdong, Fujian, Zhejiang provinces. The vulnerability of bearing body is higher in Beijing, Tianjin, Shanghai, the most parts of Jiangsu, Shandong provinces, and the coastal areas of Guangdong, Fujian, Zhejiang, Hebei Provinces. The risk of typhoon disaster is higher in Hainan Province, Shanghai and the coastal areas of Guangdong, Fujian, Zhejiang provinces, while in Beijing, Tianjin and the the most parts of Hebei, Liaoning, Shandong provinces, it is lower the risk.
|
| [4] |
都市气候图及风环境评价标准——可行性研究(最终报告) [R].Feasibility study on urban climate map and wind environment evaluation criteria (final report) . |
| [5] |
科学发展实现中国特色建筑节能 [J].https://doi.org/10.3969/j.issn.1671-3915.2008.03.007 URL [本文引用: 1] 摘要
发达国家实现的是建立在高资源消耗基础上的现代化道路,我国很难借鉴。我们应该坚持科学发展观,实现中国特色的建筑节能。在我国依靠"机械方式"营造人居环境难以实现可持续发展,必须探讨"与自然和谐"的新途径。
https://doi.org/10.3969/j.issn.1671-3915.2008.03.007 URL [本文引用: 1] 摘要
发达国家实现的是建立在高资源消耗基础上的现代化道路,我国很难借鉴。我们应该坚持科学发展观,实现中国特色的建筑节能。在我国依靠"机械方式"营造人居环境难以实现可持续发展,必须探讨"与自然和谐"的新途径。
|
| [6] |
|
| [7] |
Using computational tools to factor wind into architectural environment design [J].https://doi.org/10.1016/j.enbuild.2003.10.013 URL [本文引用: 1] 摘要
Wind can have many positive attributes in an architectural environment such as providing a comfortable and healthy indoor environment and that can also save energy, by means of passive cooling or natural ventilation. However, wind can also cause discomfort to pedestrians if its speed around a building is too high, and it can also increase energy loss in the winter. Firstly, this paper will discuss the design strategies for wind in environmental and building design. It will then compare the available techniques used to study the wind effect in building design, such as a model mockup, wind tunnel, nodal/zonal models, and computational fluid dynamics (CFD). Among the techniques studied, CFD seems to be one of the most attractive for building environment design, since it is the most affordable, accurate, and informative method. This chapter will also illustrate a number of architectural indoor and outdoor environment designs that have utilized CFD. These include: 61 airflow around a building complex; 61 using building shape to prevent draft due to cold wind in a high rise building site; 61 cross natural ventilation in a building; 61 single-sided natural ventilation design.
|
| [8] |
|
| [9] |
|
| [10] |
|
| [11] |
高街道贴线率城市规划条件下的街道界面设计研究 [D].Research on the street interface design under the conditions of high near-line rate . |
| [12] |
街道界面形态规划控制之“街道贴线率”探讨 [J]. |
| [13] |
度尺构形——对街道空间尺度的研究 [D].Construct form by rulers—Study on the scale of street space . |
| [14] |
|
| [15] |
街道界面密度与城市形态的规划控制 [J].
街道界面密度是用于表征街道界面围合程度的量化指标。通过分析城市实例,发现街道界面密度与街区建筑密度存在近似正相关关系,街区建筑密度与街廓尺度存在近似负相关关系。通过分析街道实例,发现街道的密度表征比尺度表征更为有效。结合分析我国主要大城市的商业步行街,认为小尺度街廓是形成优秀街道空间的必要条件。
Street interface density and planning control of urban form .
街道界面密度是用于表征街道界面围合程度的量化指标。通过分析城市实例,发现街道界面密度与街区建筑密度存在近似正相关关系,街区建筑密度与街廓尺度存在近似负相关关系。通过分析街道实例,发现街道的密度表征比尺度表征更为有效。结合分析我国主要大城市的商业步行街,认为小尺度街廓是形成优秀街道空间的必要条件。
|
| [16] |
|
| [17] |
中国城市人居环境质量特征与时空差异分析 [J].https://doi.org/10.7666/d.Y2234642 URL Magsci [本文引用: 1] 摘要
<p>城市人居环境已成为推动城市化发展进程,衡量城市化发展水平的重要因素。以社会经济环境、居住环境、基础设施和公共服务环境、生态环境4 个一级指标,28 个二级指标构建了城市人居环境质量综合评价指标体系,运用熵值法对中国286 个地级以上城市在2000 年、2003 年、2006 年和2009 年4 个时间断面的人居环境质量特征和时空差异变化进行了分析。结果表明:中国城市人居环境质量整体在逐步提高,城市之间人居环境质量得分差值缩小,各城市排名基本保持在一定范围;城市人居环境质量级别差异明显;城市人居环境质量时空差异显著,呈现出与经济发展水平相似的从东部到中、西部依次递减的地带性空间分布特征以及南高北低的分布状况,且各地区城市级别分布不均衡;人居环境质量水平较高的城市呈“团”状分布,与国家“十二五”规划纲要中城市化战略格局基本吻合;城市人居环境质量与城市规模无对应关系。</p>
Characteristics and spatial-temporal differences of urban human settlement environment in China .https://doi.org/10.7666/d.Y2234642 URL Magsci [本文引用: 1] 摘要
<p>城市人居环境已成为推动城市化发展进程,衡量城市化发展水平的重要因素。以社会经济环境、居住环境、基础设施和公共服务环境、生态环境4 个一级指标,28 个二级指标构建了城市人居环境质量综合评价指标体系,运用熵值法对中国286 个地级以上城市在2000 年、2003 年、2006 年和2009 年4 个时间断面的人居环境质量特征和时空差异变化进行了分析。结果表明:中国城市人居环境质量整体在逐步提高,城市之间人居环境质量得分差值缩小,各城市排名基本保持在一定范围;城市人居环境质量级别差异明显;城市人居环境质量时空差异显著,呈现出与经济发展水平相似的从东部到中、西部依次递减的地带性空间分布特征以及南高北低的分布状况,且各地区城市级别分布不均衡;人居环境质量水平较高的城市呈“团”状分布,与国家“十二五”规划纲要中城市化战略格局基本吻合;城市人居环境质量与城市规模无对应关系。</p>
|
| [18] |
|
| [19] |
Wind-direction effects on urban-type flows [J].https://doi.org/10.1007/s10546-009-9434-y URL [本文引用: 1] 摘要
Recently, several attempts have been made to model the wind velocity in an urban canopy in order to accurately predict the mixing and transport of momentum, heat, and pollutants within and above the canopy on an urban scale. For this purpose, unverified assumptions made by Macdonald (Boundary-Layer Meteorol 97:25–45, 2000) to develop a model for the profile of the mean wind velocity within an urban canopy have been used. In the present study, in order to provide foundations for improving the urban canopy models, the properties of the spatially-averaged mean quantities used to make these assumptions have been investigated by performing large-eddy simulations (LES) of the airflow around square and staggered arrays of cubical blocks with the following plan area densities: λ p =020.05, 0.11, 0.16, 0.20, 0.25, and 0.33. The LES results confirm that the discrepancy between the spatial average of wind velocity and Macdonald’s five-point average of wind velocity can be large in both types of arrays for large λ p . It is also confirmed that Prandtl’s mixing length varies significantly with height within the canopy, contrary to Macdonald’s assumption for both types of arrays and for both small and large λ p . On the other hand, in accordance with Macdonald’s assumption, the sectional drag coefficient is found to be almost constant with height except in the case of staggered arrays with high λ p .
|
| [20] |
Wind tunnel tests on the relationship between building density and pedestrian-level wind velocity: Development of guidelines for realizing acceptable wind environment in residential neighborhoods [J].https://doi.org/10.1016/j.buildenv.2007.10.015 URL [本文引用: 1] 摘要
The main purpose of this study is to reveal the relationship between the building density and the average wind velocity at pedestrian level in residential neighborhoods. This paper firstly presents the results of wind tunnel tests on 22 residential neighborhoods selected from actual Japanese cities. The results show that there is a strong relationship between the gross building coverage ratio and the mean wind velocity ratio. Secondly, the wind environment evaluation for case study areas is performed by using the wind tunnel results and the climatic conditions of several major Japanese cities. The development method of guidelines for realizing acceptable wind environment in residential neighborhoods using the gross building coverage ratio is proposed.
|
| [21] |
Numerical simulation of the wind field around different building arrangement [J].https://doi.org/10.1016/j.jweia.2005.09.001 URL [本文引用: 1] 摘要
A numerical model with the RNG κ61 ε turbulence closure model and a pressure correction algorithm of SIMPLEC is used to examine three different building configuration effects on wind flow. Comparisons of computational results with experimental data have been carried out for the vertical velocity profiles at some measurement points. For the experimental study, the building arrangements were presented by 1:150 scale models and tested in a low-speed wind tunnel. It was found that the wind environment for two improved arrangements with lower interval-to-height ratio is better than that for the reference layout with higher aspect ratio in terms of the natural ventilation. The interference effect is more obvious for two improved arrangements than the reference one. The numerical results also show that changing wind direction from perpendicular to the building facades to a 45°-incidence angle has significant effect on the flow field for different configurations.
|
| [22] |
建筑室外风环境和室内通风的试验和数值模拟研究 [D].Wind tunnel experiment and optimization design of wind environment around buildings with parallel layout . |
| [23] |
DB 11 /938-2012绿色建筑设计标准 [S]. |
| [24] |
上海市城市规划管理技术规定 [EB/OL]. , 2003-10-18.-10-18 . |

/
| 〈 |
|
〉 |


