许红师 , 练继建, 宾零陵, 徐奎
天津大学水利工程仿真与安全国家重点实验室,天津 300350
Xu Hongshi, Lian Jijian, Bin Lingling, Xu Kui
中图分类号: P458.1+24
文献标识码: A
文章编号: 1000-0690(2018)12-2118-07
通讯作者:
收稿日期: 2018-01-24
修回日期: 2018-04-27
网络出版日期: 2018-12-20
版权声明: 2018 《地理科学》编辑部 本文是开放获取期刊文献,在以下情况下可以自由使用:学术研究、学术交流、科研教学等,但不允许用于商业目的.
基金资助:
作者简介:
作者简介:许红师(1992-),男,安徽阜阳人,博士研究生,主要从事自然灾害研究。E-mail:lig@nwu.edu.cn
展开
摘要
以沿海城市海口为例,运用三维Copula函数构建台风灾害多元致灾因子联合分布模型,开展多元致灾因子相互作用下的台风灾害事件联合重现期和失效概率的分析,提出全面评估台风灾害影响的研究思路。结果表明:三维Gumbel Copula函数能够合理描述台风灾害多元致灾因子之间的联合分布,以单变量作为设计依据会低估具有一定严重程度的台风灾害发生频次,相对于单变量重现期和二维联合重现期,三变量联合重现期的计算结果更加贴近实际情况。防台措施设计标准的制定应全面考虑台风灾害多元致灾因子,且应充分考虑各致灾因子间的相互作用以及设计期内的失效概率。研究成果可为中国沿海省市的可持续发展以及减灾、防灾政策的制定等提供重要的科学依据。
关键词:
Abstract
Coastal cities are highly vulnerable to typhoons due to the special geographical location. A typhoon is often accompanied by strong winds, heavy rains and high tide events. Strong winds, heavy rains and high tides are three disaster-causing factors of typhoon. Current studies of typhoon most focus on univariate and bivariate frequency analysis of disaster-causing factors. If only the joint characteristics of univariate or bivariate functions are analyzed, the factual hazard mechanism of typhoon in coastal zones cannot be explored. However, until now, there is some lack of knowledge about multivariate joint probability distribution of winds, rainfall and storm tides. The joint probability distribution can reveal the occurrence probability of multiple variables. Therefore, it is meaningful to investigate the trivariate joint probability distribution of winds, rainfall and storm tides for typhoon disaster management in coastal zones. Taking the Haikou city as an example, this paper uses the three-dimensional Copula function to construct the joint distribution model of multiple hazard factors of typhoon disasters and analyzes the joint return period of typhoon disasters and failure probability under the interaction of multiple hazard factors. The results show that the three-dimensional Gumbel Copula function can reasonably describe the joint distribution of multiple hazard factors of typhoon disasters. Multivariate return period analysis can provide more adequate and comprehensive information about risks than univariate return period analysis. Univariate design analysis will underestimate the occurrence frequency of typhoon disasters with a certain degree of severity, and the design standard of prevention measures should consider the multiple hazard factors of typhoon disasters comprehensively, and give full consideration to the failure probability during the design period. The research results can provide important scientific evidences for the sustainable development of China's coastal provinces and cities and the formulation of disaster prevention and disaster prevention policies.
Keywords:
台风是一种发生在热带或副热带海洋上的气旋性涡旋,常通过狂风、暴雨和风暴潮致灾[1]。台风灾害发生频率高、影响范围广、破坏强度大,是人类面临的最严重环境问题之一。沿海城市因其地理位置特殊,极易遭受台风灾害影响。一场台风往往伴随着强风、暴雨和高潮位事件的同时发生,强风、暴雨和高潮位分别从不同的方面给沿海城市带来严重的灾害,台风带来的风速、降雨和潮位均为台风灾害的致灾因子。现有的针对台风灾害的研究主要集中在单致灾因子或两致灾因子分析。如国内一些学者[2,3]对台风的极值风速进行研究,以确定台风多发区建筑结构的设计风速。任锦亮等[4]利用Copula函数建立了上海市台风降雨与黄浦江潮位的联合分布模型,分析了不同频率台风降雨和高潮位组合事件的联合概率。武占科等[5]和Dong等[6]运用Gumbel Copula函数构建了台风条件下风速和雨强联合概率分布函数模型。王灶平等[7]基于超越概率理论,选取最优Copula函数建立了潮位和风速的联合分布函数。以上研究均是基于单变量或双变量的台风灾害分析,鲜有全面考虑风速、降雨和潮位开展台风灾害多维致灾因子联合分布的研究。但单一的致灾因子分析不足以综合反应台风灾害影响,本文综合风速、降雨和潮位多元台风灾害致灾因子,通过构建多元致灾因子联合分布,探究多元致灾因子间的相关特征,提出全面评估台风灾害影响的研究思路。
Copula函数能够有效描述水文特征变量间的相依性,可构造任意边缘分布的联合分布,并且可以较好地刻画变量间的相关结构。随着其理论和方法的逐步完善,Copula函数被越来越多的应用到多变量事件分析中[8,9,10]。在利用Copula 函数进行多变量事件分析的研究中,往往涉及重现期的概念。传统的多变量重现期计算可利用Copula 函数得到联合概率,再进行联合重现期计算。近年来,国外学者[11,12,13,14]考虑到重现期不能反映工程实施期内危险事件的发生概率,又提出了危险事件的失效概率(Failure probability)概念,为工程设计提供新的依据。
本文以沿海城市海口为研究区域,运用Copula函数构建了台风灾害多元致灾因子联合概率分布,分析了台风灾害事件的三维联合重现期和失效概率,以期为沿海城市台风灾害管理提供科学依据。
Copula函数在构造联合分布的过程中不要求变量具有相同的边缘分布,近年来被逐渐应用于多变量分析中。设变量X1, X2,…, Xn的边缘分布为F1, F2,…, Fn,联合分布为F(x1, x2,…, xn)。按照Sklar理论,存在一个n维Copula函数C,使得对任意
本文采用常用的二维Gaussian Copula,Student’s t-Copula,Gumbel Copula,Clayton Copula和Frank Copula构建风速-降雨、风速-潮位和降雨-潮位两变量间的联合分布,采用三维Gaussian Copula,Student’s t-Copula和Gumbel Copula函数构建风速-降雨-潮位联合分布。
采用最大似然函数估计法对上述Copula函数进行参数估计,运用K-S检验法进行拟合优度检验,运用AIC准则和离差平方和准则(OLS)法进行拟合优度评价,从而比选出各变量间最优Copula函数。
设风速变量T、降雨变量H和潮水位变量Z的联合分布函数为
式中,N为观测样本时间长度,n0为观测时段内超越某一样本出现的次数。
失效概率(Failure probability)是指在设计期内潜在的灾害事件至少发生一次的概率[11,12]。对于一般情景,失效概率(PT)可以表述为[11,12]:
式中,
式中,
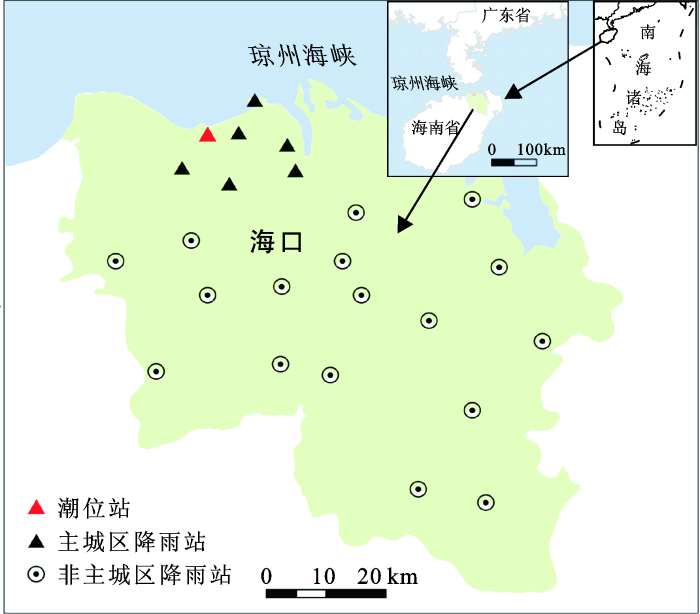
本文研究区域为海口市主城区(图1),位于海口市北部,面积约150 km2,地势较为平缓,西南较高、东北较低。海口市北部临海,属太平洋台风区,是台风频繁侵袭的地区之一。主城区北部、东部临海临江区域,由于地势平缓,受台风侵袭时,台风带来的狂风对建筑物、树木及行人安全极为不利,高潮位极易造成外江水位倒灌,同时台风伴随的强降雨天气因潮位顶托也易导致严重的洪涝灾害。
本研究选取台风带来的日降雨量、日最高潮位及当日最大台风风速进行分析。降雨和潮位资料选取海口市主城区1974~2012年间降雨测站日降雨资料和潮位测站日最高潮位资料,最大风速资料来源于中国气象局上海台风研究所热带气旋最佳路径数据集资料。其中对海口市主城区有影响的台风参考文献[15,16]将其定义为距离海口测站500 km以内的台风。
首先,运用Lognorm分布、Gamma分布、Weibull分布、Generalized Extreme Value(GEV)分布、Pearson-III分布分别构建风速、降雨、潮位的边缘分布函数,并从中选择拟合效果最好的分布函数。通过K-S检验和AIC、OLS值比选,Pearson-III分布、Gamma分布和GEV分布分别为三者的最优边缘分布函数。
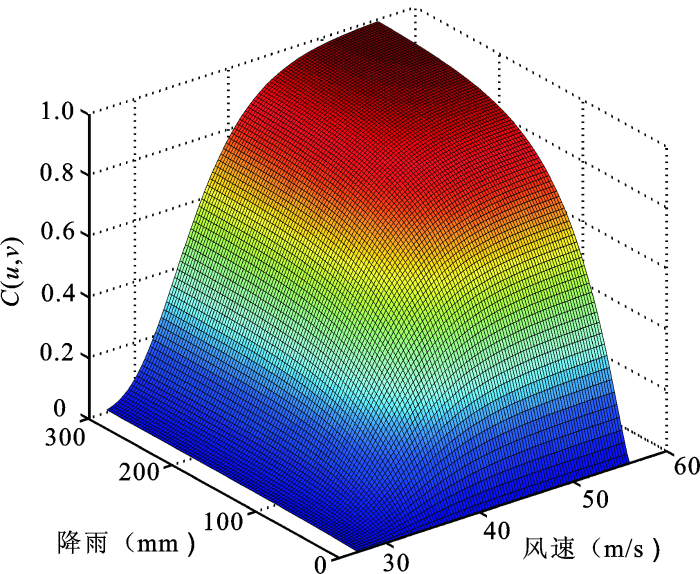
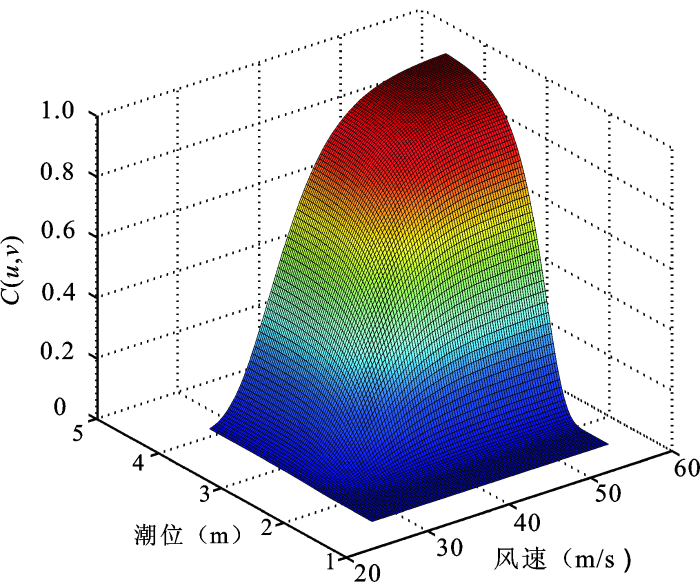
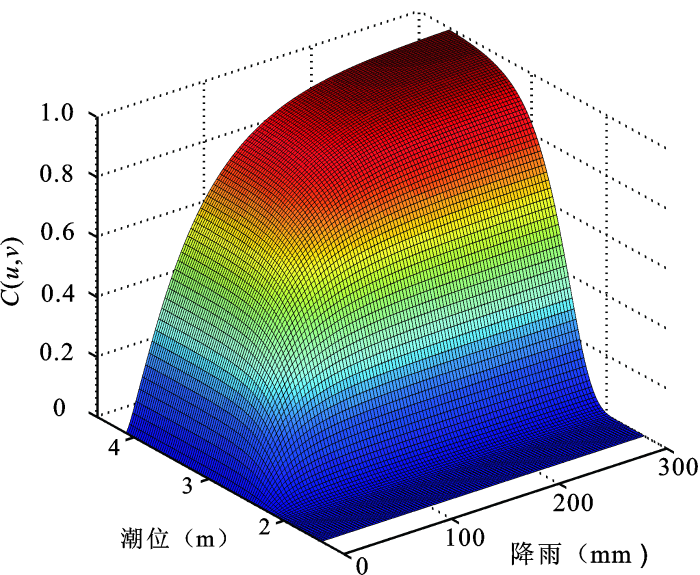
然后,运用常用的二维Copula函数构建风速-降雨,风速-潮位及降雨-潮位间的二维联合概率分布模型。对于风速-潮位, Gumbel Copula函数具有最小的AIC值和OLS值,所以Gumbel Copula函数为风速-潮位的最优联合概率分布模型;同理,对于风速-降雨变量和降雨-潮位变量,Frank Copula为相应的最优联合概率分布模型。图2~4分别为风速-降雨,风速-潮位,降雨-潮位二维联合概率分布图,由图可以得出任意变量间的不同组合的联合概率分布值。
图2 风速降雨二维联合概率分布
Fig.2 Joint probability distribution of wind speed and rainfall
图3 风速潮位二维联合概率分布
Fig.3 Joint probability distribution of wind speed and storm tide
图4 降雨潮位二维联合概率分布
Fig.4 Joint probability distribution of rainfall and storm tide
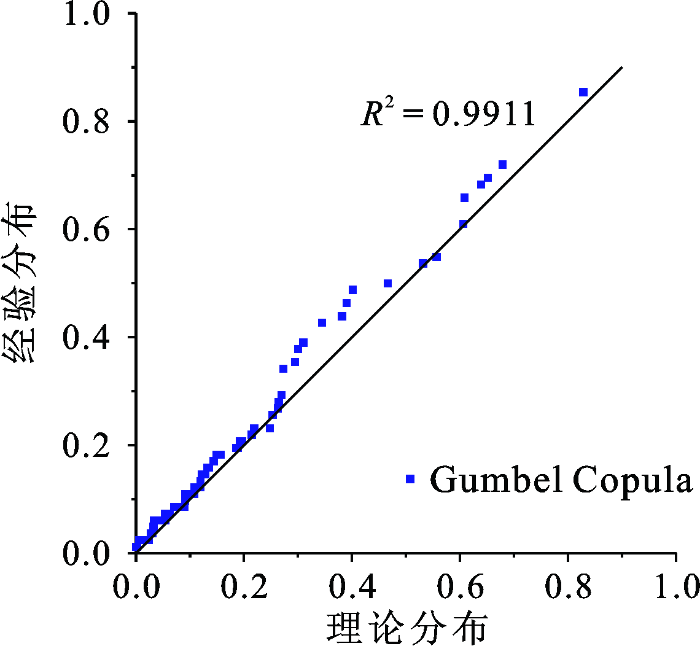
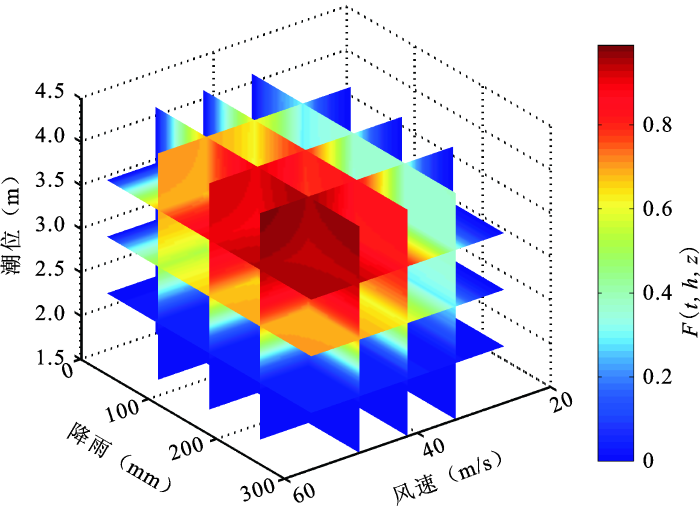
最后,运用三维Gaussian Copula,Student’s t-Copula和Gumbel Copula函数分别构建风速-降雨-潮位三维联合概率分布模型,并计算各Copula函数的拟合优度评价指标值(表1)。由表1可知,上述Copula函数均通过K-S检验,且Gumbel Copula函数具有最小的AIC值,因此Gumbel Copula函数建立的三维联合分布模型对于描述风速-降雨-潮位的拟合效果最好。图5为Gumbel Copula分布函数和经验分布函数的P-P图,二者R2大于0.95,表明上述Copula函数拟合效果较好。图6为风速-降雨-潮位联合分布四维切片图。从图中可以查出给定不同变量组合的联合概率分布值。随着风速、降雨和潮位值的增加,三者的联合概率分布值增大。
表1 三变量联合分布函数拟合优度检验
Table 1 Goodness of fit of the trivariate distributions based on Copulas
| 分布 | Gaussian Copula | Student’s t-Copula | Gumbel Copula |
|---|---|---|---|
| K-S | 0.149 | 0.149 | 0.118 |
| OLS | 0.048 | 0.046 | 0.046 |
| AIC | -135.353 | -138.304 | -142.219 |
图5 风速-降雨-潮位三维联合分布P-P图
Fig.5 P-P plot of the joint distribution of wind speed, rainfall and storm tide
图6 风速-降雨-潮位联合分布四维轴切图
Fig.6 Trivariate joint probability distribution of wind speed, rainfall and storm tide
根据1.1的公式,计算台风灾害事件的单变量重现期、二维联合重现期及三维联合重现期(表2)。由表2可知,单致灾因子重现期大于两致灾因子联合重现期,且二者都大于三变量联合重现期。如当单变量重现期为100 a时,风速-降雨-潮位组合事件的联合重现期仅为16.7 a,而当三者中任一变量发生超阈值事件时都有可能引起台风灾害,仅以单变量作为设计依据会低估具有一定严重程度的灾害发生频次。
表2 台风灾害事件单变量重现期、二维联合重现期及三维联合重现期
Table 2 Univariate, bivariate and trivariate return period (RP) of typhoon disaster events
| 单变量重 现期(a) | 风速 T(m/s) | 降雨 H(mm) | 潮位 Z(m) | 联合重现期(a) | |||
|---|---|---|---|---|---|---|---|
| T-H | T-Z | H-Z | T-H-Z | ||||
| 5 | 40.56 | 95.73 | 2.94 | 1.33 | 1.34 | 1.51 | 1.06 |
| 10 | 43.92 | 132.14 | 3.16 | 2.51 | 2.55 | 2.74 | 1.90 |
| 20 | 47.08 | 167.93 | 3.37 | 4.88 | 4.97 | 5.14 | 3.58 |
| 50 | 51.07 | 214.64 | 3.65 | 12.02 | 12.26 | 12.30 | 8.53 |
| 100 | 53.98 | 249.68 | 3.85 | 23.91 | 24.39 | 24.19 | 16.70 |
与单变量重现期和两变量联合重现期相比,三变量联合重现期的计算结果更加贴近实际情况,这一结论和目前已有的研究相一致[8~10,17]。结合历史台风资料,对影响研究区域的重大台风灾害事件实际发生的重现期与三维致灾因子联合分布模型计算结果进行比较分析。2014年7月18日威马逊台风侵袭海口,台风带来的当日最大风速为60 m/s (中国气象局热带气旋资料中心),日降雨量为225.3 mm (海口市大致坡站),日最高潮位3.83 m (海口站),威马逊台风为41 a来影响海口最严重的台风[18,19,20]。根据本文构建的风速、降雨和潮位的边缘分布、二维Copula分布以及三维Copula联合分布模型,得到风速、降雨和潮位对应的单变量重现期分别为498.7 a、61.7 a和92.6 a;基于风速-降雨、风速-潮位、降雨-潮位的二维联合重现期分别为54.9 a、79.4 a和45.1 a;基于风速-降雨-潮位三维联合重现期为39.5 a,相对于单变量重现期和二维联合重现期,三维联合重现期更加接近实际情况。实际工程设计中要充分考虑各种台风致灾因子间的关联特性,漏掉任一变量对台风灾害风险管理都是不利的。
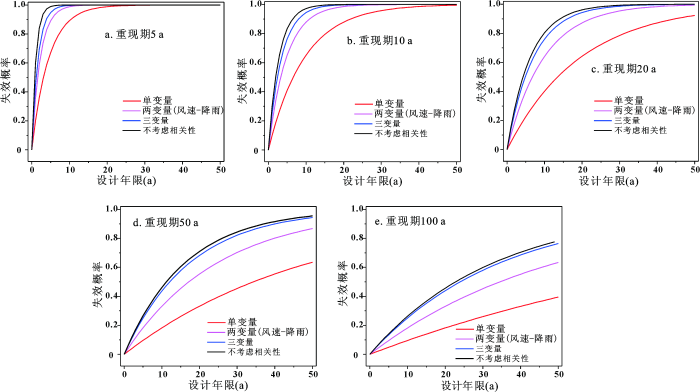
图7为台风灾害单变量、两变量联合事件、三变量联合事件的失效概率随设计年限的变化图。由图可知:① 随着重现期水平的增加,单变量、两变量及三变量台风灾害事件的失效概率逐渐减小。② 随着设计年限的增加,失效概率逐渐增加,如对于100 a一遇的单变量事件,10 a内该事件的失效概率为0.095,50 a内该事件的失效概率增加为0.395,由此可见,仅以重现期作为设计依据未考虑工程的设计年限,不能准确反映设计期内灾害事件发生的概率。③ 单变量事件失效概率<两变量联合事件失效概率<三变量联合事件失效概率,仅以单变量作为设计依据会低估工程实施期内灾害事件的失效概率,对工程产生不利影响。④ 在联合事件情景下,不考虑变量间的相关性会高估灾害事件的失效概率,这与Moftakhari[11]的分析结论一致,说明工程设计中要运用合适的模型来反应变量间的相关性,对于台风风速-降雨-潮位而言,三维Gumbel Copula能充分反映三者之间的相关性。
图7 不同重现期水平组合事件的失效概率
Fig.7 The failure probability of typhoon disaster scenarios in different return periods
以沿海城市海口市为例,运用三维Copula函数构建了台风灾害多元致灾因子联合分布模型,分析了多元致灾因子相互作用下的台风灾害事件联合重现期以及失效概率,得出主要结论如下:
1) 对于两变量概率分布,Gumbel Copula函数为风速-潮位的最优联合概率分布模型,Frank Copula函数对风速-降雨和降雨-潮位的拟合效果较好。通过对比3种三维Copula函数的拟合精度,选取三维Gumbel Copula函数来构建风速-降雨-潮位三变量联合概率分布,模型拟合精度较高,结果可靠。
2) 单变量重现期大于两变量联合重现期,且二者都大于三变量联合重现期,与单变量重现期和两变量联合重现期相比,三变量联合重现期的计算结果更加贴近实际情况。仅以单变量作为设计依据会低估具有一定严重程度的台风灾害发生频次,实际工程设计中要充分考虑各种台风致灾因子间的关联特性,漏掉任一变量对台风灾害风险管理都是不利的。
3) 随着设计年限的增加,失效概率逐渐增加,仅以重现期作为设计依据未考虑工程的设计年限,不能准确反映设计期内灾害事件发生的概率。单变量事件失效概率<两变量联合事件失效概率<三变量联合事件失效概率,仅以单变量作为设计依据会低估工程实施期内灾害事件的失效概率,对工程产生不利影响。实际工程设计中,应充分考虑多元台风灾害致灾因子进行多变量频率分析,同时考虑设计期内灾害事件的发生概率。
The authors have declared that no competing interests exist.
| [1] |
中国沿海地区近20年台风灾害风险评价 [J].
The risk assessment method of typhoon disasters was proposed according to the nature disaster system theory and considering the characteristics of hazard factor and bearing body. And in the GIS environment the hazard, vulnerability and risk of typhoon disasters in China coastal area were assessed. The assessment result showed that the hazard of typhoon disaster is higher in Hainan Province, Shanghai and the coastal areas of Guangdong, Fujian, Zhejiang provinces. The vulnerability of bearing body is higher in Beijing, Tianjin, Shanghai, the most parts of Jiangsu, Shandong provinces, and the coastal areas of Guangdong, Fujian, Zhejiang, Hebei Provinces. The risk of typhoon disaster is higher in Hainan Province, Shanghai and the coastal areas of Guangdong, Fujian, Zhejiang provinces, while in Beijing, Tianjin and the the most parts of Hebei, Liaoning, Shandong provinces, it is lower the risk.
Risk assessment of typhoon disasters in China coastal area during last 20 years .
The risk assessment method of typhoon disasters was proposed according to the nature disaster system theory and considering the characteristics of hazard factor and bearing body. And in the GIS environment the hazard, vulnerability and risk of typhoon disasters in China coastal area were assessed. The assessment result showed that the hazard of typhoon disaster is higher in Hainan Province, Shanghai and the coastal areas of Guangdong, Fujian, Zhejiang provinces. The vulnerability of bearing body is higher in Beijing, Tianjin, Shanghai, the most parts of Jiangsu, Shandong provinces, and the coastal areas of Guangdong, Fujian, Zhejiang, Hebei Provinces. The risk of typhoon disaster is higher in Hainan Province, Shanghai and the coastal areas of Guangdong, Fujian, Zhejiang provinces, while in Beijing, Tianjin and the the most parts of Hebei, Liaoning, Shandong provinces, it is lower the risk.
|
| [2] |
应用台风风场经验模型的台风极值风速预测 [J].https://doi.org/10.11918/j.issn.0367-6234.2016.02.024 URL Magsci [本文引用: 1] 摘要
为准确、高效地进行台风多发地区建筑结构设计风速的预测,利用中国东南沿海1949—2012年的台风历史数据进行了香港地区台风关键参数概率分布的研究,提出了基于新的Holland径向气压分布参数B表达式的台风风场经验模型.在此基础上结合Monte Carlo数值模拟技术,利用台风极值风速分析方法完成了不同重现期下香港地区台风极值风速的预测,并与观测数据、香港风荷载规范计算结果进行对比分析,验证了利用此台风风场经验模型进行台风极值风速预测的有效性.
Prediction typhoon design wind speed with empirical typhoon wind field model .https://doi.org/10.11918/j.issn.0367-6234.2016.02.024 URL Magsci [本文引用: 1] 摘要
为准确、高效地进行台风多发地区建筑结构设计风速的预测,利用中国东南沿海1949—2012年的台风历史数据进行了香港地区台风关键参数概率分布的研究,提出了基于新的Holland径向气压分布参数B表达式的台风风场经验模型.在此基础上结合Monte Carlo数值模拟技术,利用台风极值风速分析方法完成了不同重现期下香港地区台风极值风速的预测,并与观测数据、香港风荷载规范计算结果进行对比分析,验证了利用此台风风场经验模型进行台风极值风速预测的有效性.
|
| [3] |
上海近海海上最大风速的估算及数值模拟 [J].
基于上海近海测风塔测风数据和上海气象站历史风速资料,利用数理统计分析方法和TAPM模式模拟技术开展上海近海不同重现期最大风速的估算、数值模拟与测风塔观测的最大风速的对比验证以及上海近海最大风速的高度变化和空间分布特征研究。结果表明,上海近海10 m高度50 a和100 a一遇的最大风速分别为35.1和37.7 m/s,TAPM模式能较好地模拟出台风大风影响时近海风速的变化特征,在近海10~100 m层间风切变指数取0.08是适宜的,上海最大风速基本呈从东到西递减的分布,在沿海和长江口的海(江)岸带风速变化梯度最大。
Estimation and numerical simulation of maximum wind speed in shanghai offshore. Taiyangneng Xuebao/acta
基于上海近海测风塔测风数据和上海气象站历史风速资料,利用数理统计分析方法和TAPM模式模拟技术开展上海近海不同重现期最大风速的估算、数值模拟与测风塔观测的最大风速的对比验证以及上海近海最大风速的高度变化和空间分布特征研究。结果表明,上海近海10 m高度50 a和100 a一遇的最大风速分别为35.1和37.7 m/s,TAPM模式能较好地模拟出台风大风影响时近海风速的变化特征,在近海10~100 m层间风切变指数取0.08是适宜的,上海最大风速基本呈从东到西递减的分布,在沿海和长江口的海(江)岸带风速变化梯度最大。
|
| [4] |
上海市台风降雨和潮位遭遇组合概率研究 [J].
针对台风期间上海市城市防洪涝安全风险问题,基于1970~2011年徐家汇气象站日降雨资料和黄浦江吴淞潮位站日潮位资料,采用P-Ⅲ型分布拟合了台风降雨和潮位的概率分布,利用Copula函数建立了上海市台风降雨与黄浦江潮位的联合分布模型,并定义和分析了台风降雨与潮位的组合风险概率及两变量重现期。结果表明,上海市台风降雨达到50mm,与年最高潮位达到警戒水位的联合重现期约为2年;10年一遇台风降雨与5年一遇或20年一遇的年高潮位的同现重现期分别为111、303年;20年一遇的台风降雨与20年一遇的年高潮位的同现重现期为625年;上海市10年一遇以上台风降雨遭遇到5年一遇以上的年高潮位的机率很小。
Joint probability investigation of encounter typhoon rainfall and tide level in Shanghai City .
针对台风期间上海市城市防洪涝安全风险问题,基于1970~2011年徐家汇气象站日降雨资料和黄浦江吴淞潮位站日潮位资料,采用P-Ⅲ型分布拟合了台风降雨和潮位的概率分布,利用Copula函数建立了上海市台风降雨与黄浦江潮位的联合分布模型,并定义和分析了台风降雨与潮位的组合风险概率及两变量重现期。结果表明,上海市台风降雨达到50mm,与年最高潮位达到警戒水位的联合重现期约为2年;10年一遇台风降雨与5年一遇或20年一遇的年高潮位的同现重现期分别为111、303年;20年一遇的台风降雨与20年一遇的年高潮位的同现重现期为625年;上海市10年一遇以上台风降雨遭遇到5年一遇以上的年高潮位的机率很小。
|
| [5] |
上海地区台风条件风速和雨强联合概率分布统计 [J].https://doi.org/10.3969/j.issn.0258-1825.2010.04.005 URL Magsci [本文引用: 1] 摘要
选取上海市崇明岛侯家镇气象站纪录的47个台风最大10min时距平均风速和最大雨强作为样本,使用不同的概率分布模型分别对风速和雨强的概率分布参数进行拟合并作拟合优度比较,提出台风条件下风速和雨强联合概率分布函数.优化结果表明,Gumbel Copula函数联合概率分布模型和极值Ⅰ型联合概率分布模型适合描述台风条件下风速和雨强联合概率分布,其中Gumbel Copula函数联合概率分布模型中风速和雨强各自的概率分布模型分别采用极值Ⅲ型概率分布模型和Gamma分布模型.
Statistical analysis of wind velocity and rainfall intensity joint probability distribution of Shanghai area in typhoon condition .https://doi.org/10.3969/j.issn.0258-1825.2010.04.005 URL Magsci [本文引用: 1] 摘要
选取上海市崇明岛侯家镇气象站纪录的47个台风最大10min时距平均风速和最大雨强作为样本,使用不同的概率分布模型分别对风速和雨强的概率分布参数进行拟合并作拟合优度比较,提出台风条件下风速和雨强联合概率分布函数.优化结果表明,Gumbel Copula函数联合概率分布模型和极值Ⅰ型联合概率分布模型适合描述台风条件下风速和雨强联合概率分布,其中Gumbel Copula函数联合概率分布模型中风速和雨强各自的概率分布模型分别采用极值Ⅲ型概率分布模型和Gamma分布模型.
|
| [6] |
Joint return probability analysis of wind speed and rainfall intensity in typhoon-affected sea area. Nat .https://doi.org/10.1007/s11069-016-2736-8 URL [本文引用: 1] 摘要
Abstract Strong wind and rainfall induced by extreme meteorological processes such as typhoons have a serious impact on the safety of bridges and offshore engineering structures. A new bivariate compound extreme value distribution is proposed to describe the probability dependency structure of annual extreme wind speed and concomitant process maximum rainfall intensity in typhoon-affected area. This probability model takes full account of the case that there may be no rainfall in a typhoon process. A case study based on the observation data of typhoon maximum wind speed and maximum rainfall intensity in Shanghai is conducted to testify the efficiency of the model. Weibull distributions with two parameters are applied to fit respective probability margins, and the joint probability distribution is constructed by Gumbel鈥揌ougaard copula. The fitting results and K tests show that these models describe the original data well. The joint return periods are calculated by Poisson bivariate compound extreme value distribution we have proposed. They indicate that typhoons with no rain have smaller joint return periods, and wind speed is the main factor which impacts the change of the joint return periods.
|
| [7] |
考虑风、潮联合概率分布的海堤超越频率分析 [J].https://doi.org/10.3880/j.issn.10067647.2014.06.004 URL [本文引用: 1] 摘要
基于超越概率理论,选取最优Copula函数建立潮位和风速的联合分布函数,对江苏沿海条子泥匡围工程1989-2008年的实测年最高潮位和年最大风速资料进行分析,发现两者存在较弱的正相关关系;选取GH-Copula函数作为联合分布函数,计算得到风、潮组合的联合概率,进而求解其超越累积概率,发现风潮相关情况下的超越累积概率比风潮相互独立情况下高,认为工程中需考虑其联合概率。
Exceeding cumulative probability analysis of seawall considering the joint probability distribution of tide level and wind speed .https://doi.org/10.3880/j.issn.10067647.2014.06.004 URL [本文引用: 1] 摘要
基于超越概率理论,选取最优Copula函数建立潮位和风速的联合分布函数,对江苏沿海条子泥匡围工程1989-2008年的实测年最高潮位和年最大风速资料进行分析,发现两者存在较弱的正相关关系;选取GH-Copula函数作为联合分布函数,计算得到风、潮组合的联合概率,进而求解其超越累积概率,发现风潮相关情况下的超越累积概率比风潮相互独立情况下高,认为工程中需考虑其联合概率。
|
| [8] |
基于Copula函数的暴雨要素三维联合分布——以宽甸县为例 [J].
以辽宁省宽甸县为例,利用1955-2012年逐日降水数据,提取年暴雨日数(D50)、年暴雨量(P50)、年均暴雨强度(I)和暴雨比(R)共4个暴雨要素,运用K-S法确定各单要素最优概率分布函数;针对暴雨要素多面性,通过引入Copula函数,构建三维联合分布并进行AIC和RMSE优度检验,确定适合暴雨要素的最优Copula函数,分析多要素联合后暴雨的概率和重现期特征。研究表明:1单变量拟合仅反映暴雨单个要素本身的信息,无法涉及要素间的联系;三维Copula联合可从3方面呈现暴雨要素间的内在信息,更贴近实际;暴雨本身的多要素性,为Copula函数在暴雨分析上提供了广阔前景;2年暴雨日数、年暴雨量和年均暴雨强度的联合适合反映宽甸县暴雨重现期;宽甸县暴雨联合重现期短,多为0-2 a,同现重现期较长,集中于200 a左右;2种重现期变化趋势一致,存在同步效应,反映了暴雨要素的不可分割性。
The three-dimensional joint distributions of rainstorm factors based on Copula function: A case in Kuandian County, Liaoning Province .
以辽宁省宽甸县为例,利用1955-2012年逐日降水数据,提取年暴雨日数(D50)、年暴雨量(P50)、年均暴雨强度(I)和暴雨比(R)共4个暴雨要素,运用K-S法确定各单要素最优概率分布函数;针对暴雨要素多面性,通过引入Copula函数,构建三维联合分布并进行AIC和RMSE优度检验,确定适合暴雨要素的最优Copula函数,分析多要素联合后暴雨的概率和重现期特征。研究表明:1单变量拟合仅反映暴雨单个要素本身的信息,无法涉及要素间的联系;三维Copula联合可从3方面呈现暴雨要素间的内在信息,更贴近实际;暴雨本身的多要素性,为Copula函数在暴雨分析上提供了广阔前景;2年暴雨日数、年暴雨量和年均暴雨强度的联合适合反映宽甸县暴雨重现期;宽甸县暴雨联合重现期短,多为0-2 a,同现重现期较长,集中于200 a左右;2种重现期变化趋势一致,存在同步效应,反映了暴雨要素的不可分割性。
|
| [9] |
沙尘暴灾害致灾因子三维联合分布与重现期探索 [J].https://doi.org/10.11867/j.issn.1001-8166.2013.04.0490 URL Magsci [本文引用: 1] 摘要
<p>探讨多致灾因子对Copula联合分布模型在三维多致灾因子综合分析中的扩展。针对沙尘暴形成的3个基本条件:大风、丰富的沙尘源和不稳定的大气层结,以内蒙古镶黄旗1990—2008年的强沙尘暴灾害事件为案例,建立了经向环流指数、地面平均最大风速和地表土壤湿度3个基本特征变量的联合分布,计算了基于联合分布的联合重现期。研究表明,镶黄旗强沙尘暴事件的三维致灾因子符合Frank Copula函数构建条件,该函数能够很好地描述强沙尘暴灾害3个基本特征变量的联合分布,具备扩展到三维的能力。相对于二维Copula函数拟合效果,三维Frank Copula在中高尾部分的拟合有很大提高。三变量联合重现期的计算结果更加贴近实际情况。</p>
Return period analysis based on joint distribution of three hazards in dust strom disaster .https://doi.org/10.11867/j.issn.1001-8166.2013.04.0490 URL Magsci [本文引用: 1] 摘要
<p>探讨多致灾因子对Copula联合分布模型在三维多致灾因子综合分析中的扩展。针对沙尘暴形成的3个基本条件:大风、丰富的沙尘源和不稳定的大气层结,以内蒙古镶黄旗1990—2008年的强沙尘暴灾害事件为案例,建立了经向环流指数、地面平均最大风速和地表土壤湿度3个基本特征变量的联合分布,计算了基于联合分布的联合重现期。研究表明,镶黄旗强沙尘暴事件的三维致灾因子符合Frank Copula函数构建条件,该函数能够很好地描述强沙尘暴灾害3个基本特征变量的联合分布,具备扩展到三维的能力。相对于二维Copula函数拟合效果,三维Frank Copula在中高尾部分的拟合有很大提高。三变量联合重现期的计算结果更加贴近实际情况。</p>
|
| [10] |
Copula based drought frequency analysis considering the spatio-temporal variability in Southwest China [J].https://doi.org/10.1016/j.jhydrol.2015.05.030 URL [本文引用: 2] 摘要
Drought frequency analysis is a prerequisite for drought resistance planning and drought risk management. Drought is a spatio-temporal dynamic process, usually characterized by its duration, spatial extent, and severity. Copula based multivariate frequency analysis has been widely used to calculate drought frequency. However, the spatial extent is scarcely considered in previous studies, due to the fact that drought event is usually identified either for a fixed spatial scale or for a fixed temporal scale. This study develops a regional drought frequency analysis model based on trivariate copulas by considering the spatio-temporal variations of drought events. Drought duration, drought affect area, and drought severity are identified first, and their trivariate joint distribution is constructed later. The model is applied for drought frequency analysis in Southwest China during 1961 2012. A variety of probability distribution functions and copula functions (including elliptical, symmetric and asymmetric Archimedean) are used as candidate choices, and the most appropriate ones are selected based on goodness of fit using different methods. The robustness of drought frequency analysis is then evaluated and discussed. The results show that drought frequency analysis needs to fully consider the three characteristic parameters (duration, affect area, and severity) reflecting drought spatio-temporal variability. And the drought return period estimated by the copula-based trivariate frequency analysis appropriately integrates the effects of drought duration, affect area and severity, which is a reliable drought statistical measurement. The 2009 2010 drought, which has a return period of about 94years, is the most severe one in Southwest China during the period of 1961 2012. The Joe and Gumbel copulas are found to be more suitable to estimate the joint distribution of drought duration, affect area and severity, and the Asymmetric (nested) function forms perform better than the symmetric functions.
|
| [11] |
Compounding effects of sea level rise and fluvial flooding [J].https://doi.org/10.1073/pnas.1620325114 URL PMID: 28847932 [本文引用: 6] 摘要
Sea level rise (SLR), a well-documented and urgent aspect of anthropogenic global warming, threatens population and assets located in low-lying coastal regions all around the world. Common flood hazard assessment practices typically account for one driver at a time (e.g., either fluvial flooding only or ocean flooding only), whereas coastal cities vulnerable to SLR are at risk for flooding from multiple drivers (e.g., extreme coastal high tide, storm surge, and river flow). Here, we propose a bivariate flood hazard assessment approach that accounts for compound flooding from river flow and coastal water level, and we show that a univariate approach may not appropriately characterize the flood hazard if there are compounding effects. Using copulas and bivariate dependence analysis, we also quantify the increases in failure probabilities for 2030 and 2050 caused by SLR under representative concentration pathways 4.5 and 8.5. Additionally, the increase in failure probability is shown to be strongly affected by compounding effects. The proposed failure probability method offers an innovative tool for assessing compounding flood hazards in a warming climate.
|
| [12] |
A multivariate Copula‐based framework for dealing with Hazard Scenarios and Failure Probabilities [J].https://doi.org/10.1002/2015WR017225 URL [本文引用: 5] 摘要
This paper is of methodological nature, and deals with the foundations of Risk Assessment. Several international guidelines have recently recommended to select appropriate/relevant Hazard Scenarios in order to tame the consequences of (extreme) natural phenomena. In particular, the scenarios should be multivariate, i.e., they should take into account the fact that several variables, generally not independent, may be of interest. In this work, it is shown how a Hazard Scenario can be identified in terms of (i) a specific geometry and (ii) a suitable probability level. Several scenarios, as well as a Structural approach, are presented, and due comparisons are carried out. In addition, it is shown how the Hazard Scenario approach illustrated here is well suited to cope with the notion of Failure Probability, a tool traditionally used for design and risk assessment in engineering practice. All the results outlined throughout the work are based on the Copula Theory, which turns out to be a fundamental theoretical apparatus for doing multivariate risk assessment: formulas for the calculation of the probability of Hazard Scenarios in the general multidimensional case ( ) are derived, and worthy analytical relationships among the probabilities of occurrence of Hazard Scenarios are presented. In addition, the Extreme Value and Archimedean special cases are dealt with, relationships between dependence ordering and scenario levels are studied, and a counter鈥恊xample concerning Tail Dependence is shown. Suitable indications for the practical application of the techniques outlined in the work are given, and two case studies illustrate the procedures discussed in the paper.
|
| [13] |
Dismissing return periods! [J]. |
| [14] |
Reliability, return periods, and risk under nonstationarity [J].https://doi.org/10.1002/2015WR017089 URL [本文引用: 1] 摘要
Abstract Water resources design has widely used the average return period as a concept to inform management and communication of the risk of experiencing an exceedance event within a planning horizon. Even though nonstationarity is often apparent, in practice hydrologic design often mistakenly assumes that the probability of exceedance, p , is constant from year to year which leads to an average return period To equal to 1/ p ; this expression is far more complex under nonstationarity. Even for stationary processes, the common application of an average return period is problematic: it does not account for planning horizon, is an average value that may not be representative of the time to the next flood, and is generally not applied in other areas of water planning. We combine existing theoretical and empirical results from the literature to provide the first general, comprehensive description of the probabilistic behavior of the return period and reliability under nonstationarity. We show that under nonstationarity, the underlying distribution of the return period exhibits a more complex shape than the exponential distribution under stationary conditions. Using a nonstationary lognormal model, we document the increased complexity and challenges associated with planning for future flood events over a planning horizon. We compare application of the average return period with the more common concept of reliability and recommend replacing the average return period with reliability as a more practical way to communicate event likelihood in both stationary and nonstationary contexts.
|
| [15] |
Contribution of tropical cyclones to the global precipitation from eight seasons of TRMM data: regional, seasonal, and interannual variations [J].https://doi.org/10.1175/2009JCLI3303.1 URL [本文引用: 1] 摘要
Based on the University of Utah Tropical Rainfall Measuring Mission (TRMM) precipitation feature (PF) database, tropical cyclone PFs (TCPFs) are identified for over 600 storms that reached tropical storm intensity level or above around the globe during eight TC seasons from the period of 1998-2006. Each TC season includes 6 months yr-1. Six basins are considered: Atlantic (ATL), east-central Pa...
|
| [16] |
Contributions of Atlantic tropical cyclones to monthly and seasonal rainfall in the eastern United States 1960-2007 [J].https://doi.org/10.1007/s00704-010-0292-9 URL [本文引用: 1] 摘要
Tropical cyclone activity in the North Atlantic Basin experiences great variability on intra-annual, interannual, and interdecadal timescales. George Cry found that TC rainfall presents an...
|
| [17] |
Joint risk of rainfall and storm surges during typhoons in a coastal city of Haidian Island, China [J].https://doi.org/10.3390/ijerph15071377 URL [本文引用: 1] 摘要
Public health risks from urban floods are a global concern. A typhoon is a devastating natural hazard that is often accompanied by heavy rainfall and high storm surges and causes serious floods in coastal cities. Affected by the same meteorological systems, typhoons, rainfall, and storm surges are three variables with significant correlations. In the study, the joint risk of rainfall and storm surges during typhoons was investigated based on principal component analysis, copula-based probability analysis, urban flood inundation model, and flood risk model methods. First, a typhoon was characterized by principal component analysis, integrating the maximum sustained wind (MSW), center pressure, and distance between the typhoon center and the study area. Following this, the Gumbel copula was selected as the best-fit copula function for the joint probability distribution of typhoons, rainfall, and storm surges. Finally, the impact of typhoons on the joint risk of rainfall and storm surges was investigated. The results indicate the following: (1) Typhoons can be well quantified by the principal component analysis method. (2) Ignoring the dependence between these flood drivers can inappropriately underestimate the flood risk in coastal regions. (3) The co-occurrence probability of rainfall and storm surges increases by at least 200% during typhoons. Therefore, coastal urban flood management should pay more attention to the joint impact of rainfall and storm surges on flood risk when a typhoon has occurred. (4) The expected annual damage is 0.82 million dollars when there is no typhoon, and it rises to 3.27 million dollars when typhoons have occurred. This indicates that typhoons greatly increase the flood risk in coastal zones. The obtained results may provide a scientific basis for urban flood risk assessment and management in the study area.
|
| [18] |
超强台风“威马逊”近海急剧加强特征及诊断分析 [J].
利用NCEP/NCAR提供的全球客观分析资料对1409号超强台风"威马逊"近海急剧加强的特征进行了诊断分析.结果表明:南海较高的海表温度、中低层丰富的水汽净流入为"威马逊"增强提供了有利的能量条件;维持近22 h对流层深层、高层及低层介于0~4 m/s弱环境风垂直切变是"威马逊"两次以超强台风登陆的必要条件;台风中心附近对流层高层强烈辐散、中低层正涡度值的增大和正涡度柱向对流层上层的伸展导致"威马逊"急剧增强;"威马逊"台风急剧增强具有一定前兆性,急剧增强与环境风垂直切变及对流层中低层涡度值的响应时间分别为12h和9h.
Features and diagnostic analysis of rapid intensity change of super typhoon Rammasun over China offshore waters .
利用NCEP/NCAR提供的全球客观分析资料对1409号超强台风"威马逊"近海急剧加强的特征进行了诊断分析.结果表明:南海较高的海表温度、中低层丰富的水汽净流入为"威马逊"增强提供了有利的能量条件;维持近22 h对流层深层、高层及低层介于0~4 m/s弱环境风垂直切变是"威马逊"两次以超强台风登陆的必要条件;台风中心附近对流层高层强烈辐散、中低层正涡度值的增大和正涡度柱向对流层上层的伸展导致"威马逊"急剧增强;"威马逊"台风急剧增强具有一定前兆性,急剧增强与环境风垂直切变及对流层中低层涡度值的响应时间分别为12h和9h.
|
| [19] |
超强台风“威马逊”(2014)云微物理特征的模拟与对比分析 [J].https://doi.org/10.11676/qxxb2016.058 URL [本文引用: 1] 摘要
采用中尺度数值模式WRFv3.5对2014年超强台风"威马逊"进行数值模拟。利用雷达、卫星、自动站逐时降水资料,对比单参数WSM6云方案和双参数WDM6云方案在模拟台风路径、强度、降水分布及水成物含量上的差异,分析雨滴粒子的谱型特征及微物理源、汇项对云中雨水含量的影响。与上海台风研究所的最佳路径数据对比显示,两方案均较好地模拟出了台风"威马逊"的移动路径,WDM6方案的整体路径误差更小;模拟的强度差异则较为显著,WDM6方案的海平面最低气压值偏高,强度偏弱。两方案模拟的累积降雨分布虽与自动站实测资料基本一致,但WDM6方案模拟的强降水概率偏高,弱降水概率偏低。两方案模拟的对流区雪、霰、雨水含量均大于TRMM卫星反演结果,且WDM6方案的对流云较多,总体雨水含量偏高;两方案均模拟出了雷达回波分布的整体特征,但眼区尺度偏大,WDM6方案在融化层以下缺少眼墙之外的弱回波区且大于39 dBz的强回波区偏多,同样显示了雨水含量(或尺度)偏大。由于WDM6方案为暖雨(云、雨水)双参数模式,对云滴活化、云雨转换及云、雨谱型有一定的改进,其能较合理地模拟出雨滴谱随台风发展的演变特征;模拟显示,云、雨滴的收集碰并及固态粒子的融化是雨水的主要源项,WDM6方案增加了云雨水自动转化率及雨水碰并云水率,导致该方案的空中雨水含量偏高,且随高度的降低快速减小;此外,由于WDM6方案使用简单的寇拉公式进行云滴活化,初始云凝结核数的变化即可造成雪、霰、云雨水含量的改变,故建议在具体大气气溶胶条件下,对方案中的云滴生成参数化过程做相应的调整。
Numerical simulation and comparison of cloud microphysical features of super typhoon Rammasun(2014) .https://doi.org/10.11676/qxxb2016.058 URL [本文引用: 1] 摘要
采用中尺度数值模式WRFv3.5对2014年超强台风"威马逊"进行数值模拟。利用雷达、卫星、自动站逐时降水资料,对比单参数WSM6云方案和双参数WDM6云方案在模拟台风路径、强度、降水分布及水成物含量上的差异,分析雨滴粒子的谱型特征及微物理源、汇项对云中雨水含量的影响。与上海台风研究所的最佳路径数据对比显示,两方案均较好地模拟出了台风"威马逊"的移动路径,WDM6方案的整体路径误差更小;模拟的强度差异则较为显著,WDM6方案的海平面最低气压值偏高,强度偏弱。两方案模拟的累积降雨分布虽与自动站实测资料基本一致,但WDM6方案模拟的强降水概率偏高,弱降水概率偏低。两方案模拟的对流区雪、霰、雨水含量均大于TRMM卫星反演结果,且WDM6方案的对流云较多,总体雨水含量偏高;两方案均模拟出了雷达回波分布的整体特征,但眼区尺度偏大,WDM6方案在融化层以下缺少眼墙之外的弱回波区且大于39 dBz的强回波区偏多,同样显示了雨水含量(或尺度)偏大。由于WDM6方案为暖雨(云、雨水)双参数模式,对云滴活化、云雨转换及云、雨谱型有一定的改进,其能较合理地模拟出雨滴谱随台风发展的演变特征;模拟显示,云、雨滴的收集碰并及固态粒子的融化是雨水的主要源项,WDM6方案增加了云雨水自动转化率及雨水碰并云水率,导致该方案的空中雨水含量偏高,且随高度的降低快速减小;此外,由于WDM6方案使用简单的寇拉公式进行云滴活化,初始云凝结核数的变化即可造成雪、霰、云雨水含量的改变,故建议在具体大气气溶胶条件下,对方案中的云滴生成参数化过程做相应的调整。
|
| [20] |
2014年“威马逊”超强台风作用下建筑结构灾损调查与分析:轻钢结构 [J].
"威马逊"超强台风中心附近最大风力为17级,最大持续风速为60m/s,台风强度高于海南省北部建筑50年重现期设计台风,造成了严重的建筑结构灾损。通过14个建筑项目中64个轻钢结构的台风灾损情况,初步分析和总结了引起结构灾损的内在原因,并对改进轻钢结构的抗风设计提出了建议措施。主要结论为:经过正规设计、结构体系和连接构造合理的轻钢结构,其承重结构均安全地抵御了"威马逊"台风;在"威马逊"台风中轻钢结构的承重结构的受损主要是因结构自身存在明显缺陷而引起的;轻钢结构围护结构的灾损比承重结构的灾损更普遍和严重,引起围护结构灾损的主要原因为围护结构自身的缺陷和在设计中风荷载取值偏低。
Reconnaissance and analysis of building structure damages caused by super typhoon Rammasun in 2014: light steel structures .
"威马逊"超强台风中心附近最大风力为17级,最大持续风速为60m/s,台风强度高于海南省北部建筑50年重现期设计台风,造成了严重的建筑结构灾损。通过14个建筑项目中64个轻钢结构的台风灾损情况,初步分析和总结了引起结构灾损的内在原因,并对改进轻钢结构的抗风设计提出了建议措施。主要结论为:经过正规设计、结构体系和连接构造合理的轻钢结构,其承重结构均安全地抵御了"威马逊"台风;在"威马逊"台风中轻钢结构的承重结构的受损主要是因结构自身存在明显缺陷而引起的;轻钢结构围护结构的灾损比承重结构的灾损更普遍和严重,引起围护结构灾损的主要原因为围护结构自身的缺陷和在设计中风荷载取值偏低。
|

/
| 〈 |
|
〉 |