王苗苗 , 周蕾, 王绍强
Wang Miaomiao, Zhou Lei, Wang Shaoqiang
中图分类号: Q14
文献标识码: A
文章编号: 1000-0690(2018)02-0284-09
通讯作者:
收稿日期: 2017-02-17
修回日期: 2017-03-21
网络出版日期: 2018-04-10
版权声明: 2018 《地理科学》编辑部 本文是开放获取期刊文献,在以下情况下可以自由使用:学术研究、学术交流、科研教学等,但不允许用于商业目的.
基金资助:
作者简介:
作者简介:王苗苗(1991-),女,福建古田人,博士研究生,主要从事生态遥感及生态模型研究。E-mail:wangmm.16b@igsnrr.ac.cn
展开
摘要
基于生态过程机理模型BEPS(Boreal Ecosystem Productivity Simulator)和卫星遥感资料模拟了2001~2010年中国东北地区陆地生态系统总初级生产力(GPP)的时空分布特征,分析了生长季长度变化及其对东北地区陆地生态系统GPP的影响。研究表明:① 2001~2010年东北地区生长季开始时间、结束时间及生长季长度均没有显著的变化趋势,生长季长度的变化主要受到春季温度的影响。② 东北地区陆地生态系统年均GPP总值为1 057.8±44.6 TgC,其中生长季内GPP值约占总GPP值的97.57%,即东北地区GPP主要是在生长季内固定的碳量。③ 东北地区GPP主要受降水量的调节,而生长季长度变化对GPP的影响并不显著。
关键词:
Abstract
The globally averaged combined land and ocean surface temperature show a warming of 0.85℃ over the period 1880 to 2012. This phenomenon is mainly due to the burning of oil, gas, coal and wood for energy since the industrial age. Climate change has already affected the carbon cycle of terrestrial ecosystems. An obviously observable effect of such ongoing changes is the timing of phenology events, such as bud-burst, flowering, leaf unfolding, and leaf coloration. Phenology studies based on ground and remote sensing observation indicate that the length of vegetation growing season has significantly increased over the past decades, principally through an earlier beginning and a later termination. So it is necessary to study the effects of changes in growing season length on gross primary productivity (GPP) of terrestrial ecosystem under the global warming in the middle and high latitude. Northeast China is located at middle latitudes in the northern Hemisphere and is an area that exhibits prominent climate changes. Boreal Ecosystem Productivity Simulator (BEPS) is an ecological process based model, which originally stemmed from the FOREST Bio-Geochemical Cycles (FOREST-BGC) model. This model includes photosynthesis, energy balance, hydrological, and soil biogeochemical modules. Stratifying canopies into sunlit and shaded leaves, it incorporates a new temporal and spatial scaling scheme into Farquhar’s instantaneous leaf biochemical model to calculate daily carbon fixation. In this article, firstly, we run BEPS model, combined with meteorological data (including maximum and minimum air temperatures, precipitation, relative humidity and solar radiation), remote sensing data and soil data to simulate the spatial and temporal distribution of GPP in Northeast China during 2001-2010. Then, we analyzed the change of growing season length and its effect on GPP in Northeast China from 2001 to 2010. The results show that: ① There are no significant trends in the start, end and length of growing season in 2001-2010 (R2≤0.22,P≥0.17) in Northeast China. The length of growing season is more affected by the start of growing season, and the start of growing season have a significant correlation with spring temperature (R2=0.74,P=0.001), so we can conclude that the length of growing season is mainly affected by spring temperature. ② The terrestrial ecosystem’s annual mean GPP is about 1 057.8±44.6 TgC in Northeast China. There is about 1 032.2±45.8 TgC GPP in growing season, accounting for 97.5% in total. It means that Northeast China’s GPP is mainly sequestered in growing season. ③ The interannual variation of GPP is not significantly affected by the change of growing season length, it is mainly regulated by precipitation in Northeast China. And the response of the main vegetation type to phenology is consistent with that of the whole Northeast China. However, there are also some uncertainties in GPP simulation and in growing season length definition, so we should take more models to simulate GPP and use more methods to define the length of growing season in the future research.
Keywords:
IPCC第五次评估报告指出,全球平均气温在过去130 a间升高了0.85℃[1],而气候变暖将显著影响陆地生态系统的结构和功能[2]。在过去几十年里,基于地面和卫星的观测都表明北半球中高纬度地区生长季长度有明显的增加趋势[3,4]。生长季是生态系统功能发挥的重要控制因素,其长度变化通过改变陆地与大气间的相互作用[5],从而改变生态系统碳水循环[6]。因此,研究生长季长度变化及其对陆地生态系统碳水循环的影响对应对未来气候变化有重要的意义。
目前大多数研究认为植被的生产力受到温度的影响,一方面温度升高会在一定程度上促进植被的光合作用,增加陆地生态系统生产力;另一方面,温度升高会使生长季延长[7],增加植被的生长时间,从而提高陆地生态系统的生产力[8,9]。但是植被光合作用受到多种因素的共同作用,气温升高在延长生长季的同时所引发的干旱也会限制植被的光合速率,导致植被的生产力降低,从而影响全年陆地生态系统生产力[10,11]。因此,全球气候变暖导致的生长季长度变化对陆地生态系统生产力的影响还存在很大的不确定性。
生长季长度变化对植被生长有重要的影响[12,13,14,15],可以直接影响陆地生态系统碳循环[16]。东北地区是中国森林、草地资源最为丰富的地区之一[17],其中森林面积占全国森林总面积的30%,森林碳储量占全国碳储量的24%~31%[18]。因此东北地区陆地生态系统碳循环对中国陆地生态系统的演化、区域气候以及碳收支等方面都有较大的影响[19]。生态过程机理模型BEPS(Boreal Ecosystem Productivity Simulator),从植被的生长机理出发,结合气候及遥感等数据,能够实时反映气候变化状态下陆地生态系统生产力的变化。因此,本文通过生态过程模型BEPS,结合气象、卫星遥感等数据模拟2000~2010年东北地区陆地生态系统总初级生产力(gross primary productivity,GPP)时空分布特征,并分别从时间和空间尺度上分析中国东北地区生长季长度变化及其对陆地生态系统GPP的影响。
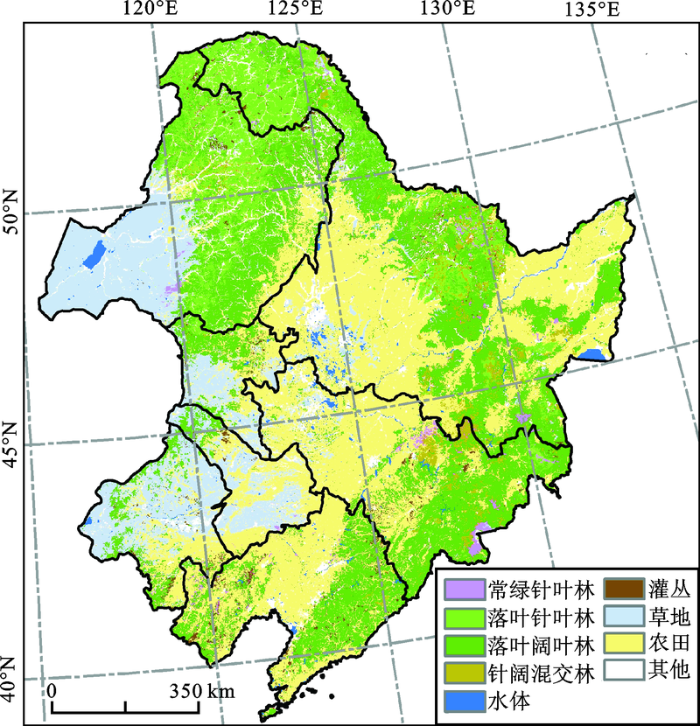
中国东北地区位于115°5'~135°2'E和38°40'~53°30'N之间[20](图1)。研究区总面积为124.3×10⁴km2,约占中国国土面积的12.9%。研究区属大陆性季风型气候,夏季温暖湿润,冬季寒冷干燥。年均温度为-7.3℃~12℃,年总降水量范围为180~926 mm(在东部高海拔地区降水量可达到1 336 mm),主要植被类型为落叶阔叶林、落叶针叶林、针阔混交林和草地。
图1 中国东北地区2010年土地覆被类型的空间分布
Fig.1 The spatial distribution of land cover in Northeast China in 2010
BEPS模型是Liu和Chen等人在FOREST-BGC模型的基础上发展起来的生态过程模型[21,22,23],Farquhar把叶片尺度瞬时光合作用模型[24]扩展到冠层尺度实现遥感数据与机理生态模型的结合[25],能够反映实际条件下植被的光合作用和蒸腾作用的变化,可用于模拟陆地生态系统每日碳水通量,并被广泛应用于估算中国陆地生态系统碳水通量[26,27,28,29,30]。
GPP的计算如公式1~3所示。
式中,
阳叶的叶面积指数:
式中,θ为太阳高度角;
阴叶的叶面积指数:
BEPS模型主要的输入数据包括每日气象数据(日最高温度、日最低温度、日降水量、日相对湿度及日总辐射)、叶面积指数数据、土地覆盖数据及土壤质地数据等,输出数据为陆地生态系统每日GPP。
1.3.1 气象数据
本研究使用的气象数据下载自中国气象科学数据共享服务网(http://www.escience.gov.cn/metdata/page/index.html),包括东北地区内气象站点(共101个)。逐日气象数据(包括日最高气温、日最低气温、日降水量、日均相对湿度),利用ANUSPLIN软件[31,32]插值成1 km空间分辨率的栅格数据。由于东北地区辐射气象站点较少,故首先下载气象站点日照时数数据,通过太阳总辐射与日照时数的关系,再通过ANUSPLIN算法插值成1 km空间分辨率的辐射数据[33]。
1.3.2 叶面积指数数据
叶面积指数(Leaf Area Index,LAI) 通常定义为单位地表面积上绿叶总面积的一半[34],作为表征冠层结构的关键参数,LAI是BEPS模型的重要输入参数。本研究使用的LAI数据采用 MOD09A1 及 MCD43A1 数据和基于4尺度几何光学模型的反演算法生成2001~2010年每8 d的500 m空间分辨率数据产品,该LAI指数质量较高,在全国范围内,验证精度大于70% [35]。
1.3.3 土地覆盖数据
土地覆盖数据既为BEPS模型模拟不同土地覆盖类型的生态系统生产力赋予特定的生理生态参数,也为典型森林生态系统的划分提供了依据。本研究选用中国科学院遥感与数字地球研究所提供的中国土地覆盖数据China Cover 2010。数据空间分辨率为250 m [36]。东北地区各土地覆盖类型的空间分布如图1所示,其中农田受人为因素影响大,所以本文暂不研究生长季长度对农田生态系统的影响。
1.3.4 土壤质地数据
土壤质地数据来源于北京师范大学全球变化与地球系统科学研究院陆面过程和资源生态实验室的数据网站(http://globalchange.bnu.edu.cn/research/)。
上述BEPS模型的输入数据都处理成具有相同的行列号及投影坐标,以保证像元一一对应。本研究统一采用Albers投影(第一标准纬线、第二标准纬线以及中央经线分别为25°N、47°N、110°E),空间分辨率为1 km。
1.4.1 生长季长度
研究中将生长季长度定义为某年日连续5 d滑动平均温度大于5℃到日平均温度连续5 d小于5℃时间段的总天数[37]。生长季开始定义为某年日连续5 d滑动平均温度大于5℃的时间,某年日连续5 d滑动平均温度低于5℃的时间定义为生长季结束,生长季长度为生长季结束时间与生长季开始时间之差。
5 d滑动平均温度采用如下公式计算[38]:
式中,RTN为第N天的5 d滑动平均温度,TN为原始的日均温度,若N为每年的1月1日或1月2日以及每年的12月30或31日时,RTN等于TN。
1.4.2 距平值计算方法
式中,△Xi为i年(i=2001, 2002……, 2010)GPP、生长季长度及降水量距平值;Xi为i年的GPP、生长季长度及降水量;
1.4.3 空间相关性拟合方法
为了研究东北地区陆地生态系统GPP与生长季长度及降水量的空间相关性,研究中分别以生长季长度及降水量为自变量x,以GPP为因变量y,线性拟合GPP与生长季长度及降水量的空间相关性。
2.1.1 模拟结果验证
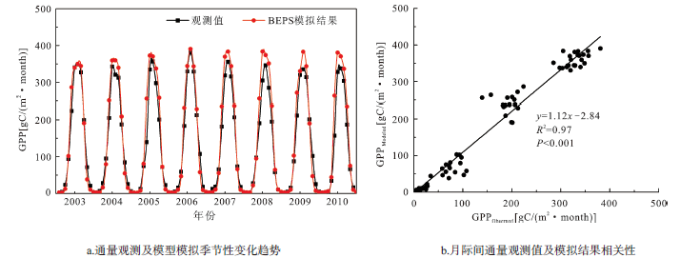
为了验证本次模拟结果的可靠性,研究中将BEPS模型的模拟结果与2003~2010年ChinaFlux的长白山站针阔混交林通量月尺度数据对比分析,以此验证模型模拟结果的可靠性。2003~2010年长白山站GPP模拟结果与通量观测值的季节性动态变化趋势一致(图2a),且模拟结果与观测值呈显著相关(P<0.01,R2 =0.97)(图2b)。这表明BEPS模型能够较好地模拟东北地区陆地生态系统GPP季节变异,可用于分析生长季长度变化对陆地生态系统GPP的影响。
图2 2003~2010年长白山站模型模拟结果验证
Fig.2 Simulation results validation in Changbai Mountains site in 2003-2010
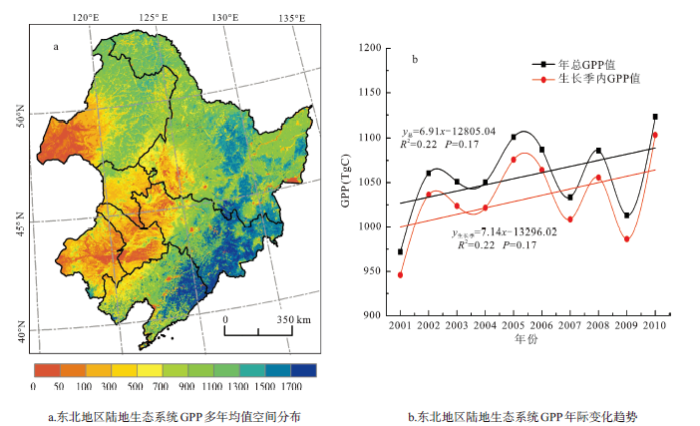
2.1.2 2001~2010年年总GPP时空分布规律
东北地区陆地生态系统2001~2010年年总GPP空间分布特点是东部地区高于西部地区(图3a)。2001~2010年东北地区陆地生态系统GPP呈波动上升趋势,年均GPP值为1 057.8±44.6 TgC,平均每年以6.9 TgC的速率增加。生长季内GPP值变化趋势与全年GPP变化趋势相同,生长季内GPP 10 a均值为1 032.2±45.8 TgC,每年以7.1 TgC的速率波动上升(图3b)。生长季内GPP约占总GPP值的97.6%,即东北地区陆地生态系统GPP主要是在生长季内所固定的碳量。
图3 中国东北地区陆地生态系统年均GPP时空分布格局
Fig.3 The spatial distribution of mean annual GPP of terrestrial ecosystem in Northeast China
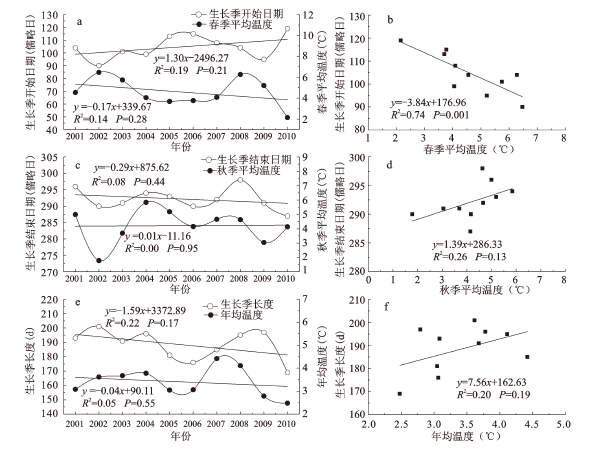
中国东北地区生长季一般在春季开始,在秋季结束,因此生长季开始时间及结束时间主要受春季及秋季温度的影响。因此本文分析了2001~2010年中国东北地区生长季开始时间与春季温度、生长季结束时间与秋季温度以及生长季长度与年均温的变化趋势及相关性,如图4所示。
图4 2001~2010年生长季长度与温度相关性
Fig.4 The correlation between length of growing season and temperature
由图4a可知,2001~2010年东北地区生长季开始时间以及春季温度都没有显著的变化趋势(R2<0.19,P>0.21);生长季开始时间为每年的第90~119天,变化较大,对生长季长度影响较大;生长季开始时间与春季温度呈显著相关(R2=0.74,P=0.001),说明东北地区生长季开始时间主要受春季温度的影响(图4b)。生长季结束时间及秋季温度均没有显著的变化趋势(R2≤0.08,P≥0.44)(图4c),生长季结束日期为每年的第287~298天,变化较小,对生长季长度影响小,且生长季结束时间与秋季温度间没有显著的相关性(R2=0.26,P=0.13)(图4d),说明秋季温度的变化对生长季长度的影响较小;2001~2010年东北地区年均生长季长度约为188±10 d,变化趋势不显著(R2=0.22,P=0.17)(图4e),且生长季长度与年均温度的相关性并不显著(R2=0.20,P=0.19)(图4f)。
综上所述,2001~2010年中国东北地区生长季开始时间、生长季结束时间以及生长季长度均没有显著的变化趋势;生长季开始时间对生长季长度的影响较大,且生长季开始时间与春季温度间有显著的相关性,因此表明东北地区生长季长度主要受春季温度的影响。
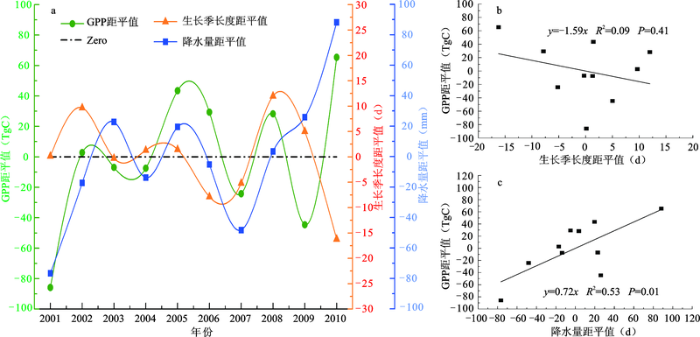
为了研究生长季长度变化对东北地区陆地生态系统GPP的影响,分析了2001~2010年东北地区陆地生态系统GPP距平值与生长季长度距平值及降水量距平值间的关系,如图5所示。
图5 GPP距平值与生长季长度及降水量距平值间的相关性
Fig.5 The correlation between GPP anomaly and anomaly of growing season length and precipitation
由图5a可知,2001、2002及2004年生长季长度都接近或高于10 a的均值,但受到降水量的限制,使其GPP值均较低。其中,2001年东北地区生长季长度接近10 a均值,但是降水量为10 a最低值,使GPP值为10 a间最低值。另外,2010年生长季长度最短,但降水量为10 a间最大值,最终使东北地区GPP总值达到10 a间最大值。2001~2010年东北地区陆地生态系统GPP距平值与生长季长度距平值间的相关性较低(图5b),但与降水距平值间呈显著相关(图5c)。说明2001~2010年东北地区陆地生态系统GPP变化主要受降水量的影响。
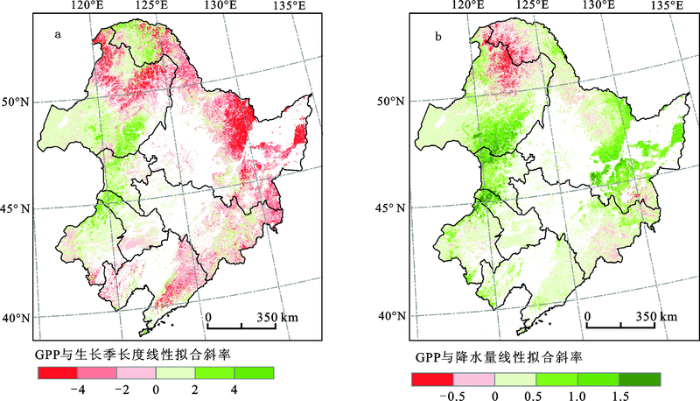
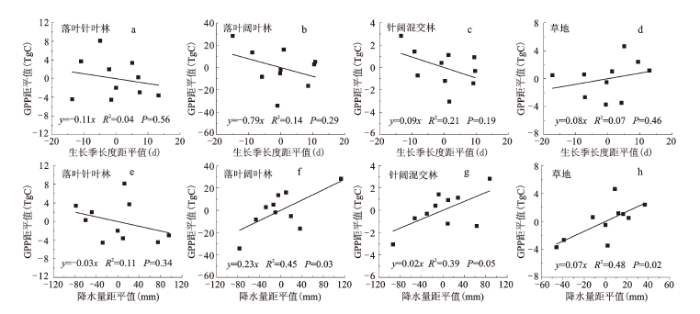
在GPP与生长季长度的线性拟合中,植被覆盖范围内有44.24%区域的GPP与生长季长度呈现正相关,主要分布在大兴安岭南部及内蒙古草原区域,其余大部分区域GPP与生长季长度间呈现负相关性(图6a)。而在GPP与降水量的空间相关性上,植被覆盖范围内有81.22%区域的GPP与降水量间都呈正相关关系(图6b)。其中GPP与生长季长度呈现负相关的大部分区域与降水量呈现正相关关系,占比45.63%。其中,东北地区主要植被类型的GPP距平值与生长季长度及降水量距平值的相关性如图7所示。2001~2010年东北地区4种主要植被类型GPP距平值与生长季长度距平值间的相关性均不显著(R2≤0.21,P≥0.19),而落叶阔叶林、针阔混交林及草地的GPP距平值与降水量距平值都有较为显著的相关性(R2≥0.39,P≤0.05)。因此,综合上述分析表明2001~2010年中国东北地区陆地生态系统GPP的年际变化趋势主要受年际间降水量变化的影响,生长季长度变化对GPP的影响受到降水量的限制。
图6 GPP与生长季长度(a)及降水量(b)空间相关性
Fig.6 The spatial correlation between GPP and the length of growing season(a) and precipitation (b)
图7 不同植被类型GPP与生长季长度及降水量距平值间相关性
Fig.7 The correlation between GPP and growing season length and precipitation anomaly in different vegetation type
本文利用生态过程模型BEPS,模拟了2001~2010年中国东北地区陆地生态系统GPP时空分布特征,分析东北地区生长季长度变化及其对东北地区陆地生态系统GPP的影响。研究结果表明:
1) 2001~2010年中国东北地区生长季开始时间、生长季结束时间及生长季长度均没有显著的变化趋势(R2≤0.22,P≥0.17),生长季长度受生长季开始时间影响较大,而生长季开始时间与春季温度呈显著相关性(R2=0.74,P=0.001),表明东北地区生长季长度主要受春季温度的影响。
2) 东北地区陆地生态系统GPP总的分布特点是东部地区高于西部地区,年均GPP总值为1 057.8±44.6 TgC,平均每年以6.91 TgC的速率增加。其中生长季内GPP值约占总GPP值的97.57%,表明东北地区陆地生态系统GPP主要是在生长季内所固定的碳量。
3) 在时间尺度上,东北地区大多数年份GPP主要受到降水量的影响,GPP距平值与生长季长度距平值相关性较低(R2=0.09,P=0.41),而与降水量距平值呈显著相关(R2=0.53,P=0.01);在空间尺度上,东北地区大部分区域GPP与生长季长度呈负相关(56.1%),而与降水量呈正相关(83.0%),且与生长季长度呈现负相关的大部分区域都与降水量呈现正相关;另外,东北地区4种主要植被类型的GPP距平值与生长季距平值的相关性不显著(R2≤0.21,P≥0.19),而与降水量距平值呈显著相关(R2≥0.39,P≤0.05),综合分析表明2001~2010年中国东北地区生长季长度对GPP的影响受到降水量的限制。
由于条件限制,本文仅选用一种方法定义生长季长度,分析结果可能存在一定偏差;而且本文仅选择了BEPS模型进行试验分析,没有采用更多的模型模拟结果进行对比分析,并缺乏对模型模拟结果的不确定性分析,因此今后的工作中将加强这一方面的研究。
The authors have declared that no competing interests exist.
| [1] |
Working Group I contributionto the IPCC Fifth assessment report, Final Draft Underlying Scientific-Technical Assessment(7 June,2013). change 2013: the physical science basis. Working Group I contributionto the IPCC Fifth assessment report, Final Draft Underlying Scientific-Technical Assessment(7 June, |
| [2] |
Ecological responses to recent climate change [J].https://doi.org/10.1038/416389a URL [本文引用: 1] |
| [3] |
The phenological calendar of Estonia and its correlation with mean air temperature [J].https://doi.org/10.1007/s004840000069 URL [本文引用: 1] |
| [4] |
European plant phenology and climateas seen in a 20-year AVHRR land-surface parameter dataset [J].https://doi.org/10.1080/01431160310001618149 URL [本文引用: 1] 摘要
Vegetation distribution and state have been measured since 1981 by the AVHRR (Advanced Very High Resolution Radiometer) instrument through satellite remote sensing. In this study a correction method is applied to the Pathfinder NDVI (Normalized Difference Vegetation Index) data to create a continuous European vegetation phenology dataset of a 10-day temporal and 0.1° spatial resolution; additionally, land surface parameters for use in biosphere–atmosphere modelling are derived. The analysis of time-series from this dataset reveals, for the years 1982–2001, strong seasonal and interannual variability in European land surface vegetation state. Phenological metrics indicate a late and short growing season for the years 1985–1987, in addition to early and prolonged activity in the years 1989, 1990, 1994 and 1995. These variations are in close agreement with findings from phenological measurements at the surface; spring phenology is also shown to correlate particularly well with anomalies in winter temperature and winter North Atlantic Oscillation (NAO) index. Nevertheless, phenological metrics, which display considerable regional differences, could only be determined for vegetation with a seasonal behaviour. Trends in the phenological phases reveal a general shift to earlier (610.5465days65year611) and prolonged (0.9665days65year611) growing periods which are statistically significant, especially for central Europe.
|
| [5] |
Role of land-surface changes in Arctic summer warming [J].https://doi.org/10.1126/science.1117368 URL PMID: 16179434 [本文引用: 1] 摘要
Abstract A major challenge in predicting Earth's future climate state is to understand feedbacks that alter greenhouse-gas forcing. Here we synthesize field data from arctic Alaska, showing that terrestrial changes in summer albedo contribute substantially to recent high-latitude warming trends. Pronounced terrestrial summer warming in arctic Alaska correlates with a lengthening of the snow-free season that has increased atmospheric heating locally by about 3 watts per square meter per decade (similar in magnitude to the regional heating expected over multiple decades from a doubling of atmospheric CO2). The continuation of current trends in shrub and tree expansion could further amplify this atmospheric heating by two to seven times.
|
| [6] |
Relating tree phenology with annual carbon fluxes at Tharandt forest [J].https://doi.org/10.1127/0941-2948/2005/0022 URL [本文引用: 1] 摘要
Within climate change research vegetation plays an important role in both indicating climate change by plant phenology and mitigating climate change by carbon sequestration. A 41-year study period of phenological observations at Tharandt International Phenological Garden and an 8-year study period of continuous flux measurements of carbon dioxide above Norway spruce ( L. [Karst.]) in the Tharandt forest were used to investigate long-term trends of phenological observations concurrent with climatic trends and to assess the importance of phenological changes for annual carbon gain of the forest. It could be shown that length of growing season determined from phenology was less variable than determined from temperature levels and significantly correlated with mean annual temperature. The slight increase in the length of growing season (LGS) (0.14 d/a) resulted from an earlier onset of spring (610.32 d/a) and of autumn phases (610.18 d/a). Obviously, this reflected regional climatic trends with significant temperature increase in spring and slight decrease in autumn. The pronounced effect in spring is also reflected by strongest correlation of annual carbon gain with the emergence of May shoot while the correlation with LGS was less significant. It was therefore concluded that earlier emergence of May shoot was more important for annual carbon gain (22.4 gC/m/d gross uptake) than the increase in total LGS (17.1 gC/m/d gross uptake). However, positive effects of premature phenological stages on carbon gain may be reduced by drought effects during summer as observed for the study year 2003. Im Rahmen der Forschung über Klima01nderungen spielt die Vegetation eine wichtige Rolle als Indikator von Klima01nderungen und als gegensteuernde Komponente durch ihren Entzug von Kohlendioxid aus der Atmosph01re. Eine 41-j01hrige Reihe ph01nologischer Daten des Internationalen Ph01nologischen Gartens Tharandt und 8-j01hrige kontinuierliche Messungen der Kohlendioxidflüsse über einem Fichtenbestand (L. [Karst.]) im Tharandter Wald wurden herangezogen, um langzeitliche Trends in ph01nologischen Phasen einhergehend mit klimatischen Trends sowie ihre Bedeutung für den j01hrlichen Kohlenstoffgewinn des Waldes zu untersuchen. Es konnte gezeigt werden, dass die L01nge der Vegetationsperiode bestimmt durch die ph01nologischen Daten im Vergleich zur L01nge bestimmt über Temperaturkriterien weniger variierte und signifikant mit der mittleren j01hrlichen Lufttemperatur korrelierte. Die leichte Zunahme der L01nge der Vegetationsperiode (0,14 d/a) beruhte auf einer deutlichen Verfrühung der Phasen im Frühling (610,32 d/a) und einer geringen Verfrühung der Phasen im Herbst (610,18 d/a). Dies reflektiert offensichtlich regionale Klimatrends, die sich durch deutliche Temperaturanstiege im Frühling und leichte Temperaturabnahmen im Herbst auszeichnen. Der st01rkere Effekt im Frühling spiegelt sich in der engsten Korrelation des j01hrlichen Kohlenstoffgewinns mit dem Erscheinen des Maitriebes wieder, w01hrend die Korrelation mit der L01nge der Vegetationsperiode weniger signifikant war. Es wurde daher gefolgert, dass das frühere Erscheinen des Maitriebes für den j01hrlichen Kohlenstoffgewinn (22,4 gC/m/d Bruttoaufnahme) wichtiger ist als die Verl01ngerung der gesamten Vegetationsperiode (17,1 gC/m/d Bruttoaufnahme). Wie für das Jahr 2003 beobachtet, k02nnen jedoch positive Effekte verfrühter ph01nologischer Stadien auf den Kohlenstoffgewinn durch Trockenheitseffekte w01hrend des Sommers wieder herabgesetzt werden.
|
| [7] |
Net carbon uptake has increased through warming-induced changes in temperate forest phenology [J].https://doi.org/10.1038/nclimate2253 URL [本文引用: 1] 摘要
The timing of phenological events exerts a strong control over ecosystem function and leads to multiple feedbacks to the climate system. Phenology is inherently sensitive to temperature and recent warming is reported to have led to earlier spring, later autumn and increased vegetation activity. Such greening could be expected to enhance ecosystem carbon uptake, although reports also suggest decreased uptake for boreal forests. Here we assess changes in phenology of temperate forests over the eastern US during the past two decades, and quantify the resulting changes in forest carbon storage. We combine long-term ground observations of phenology, satellite indices, and ecosystem-scale carbon dioxide flux measurements, along with 18 terrestrial biosphere models. We observe a strong trend of earlier spring and later autumn. In contrast to previous suggestions we show that carbon uptake through photosynthesis increased considerably more than carbon release through respiration for both an earlier spring and later autumn. The terrestrial biosphere models tested misrepresent the temperature sensitivity of phenology, and thus the effect on carbon uptake. Our analysis of the temperature-phenology-carbon coupling suggests a current and possible future enhancement of forest carbon uptake due to changes in phenology. This constitutes a negative feedback to climate change, and is serving to slow the rate of warming.
|
| [8] |
Growing season extension and its impact on terrestrial carbon cycle in the Northern Hemisphere over the past 2 decades [J].https://doi.org/10.1029/2006GB002888 URL [本文引用: 1] 摘要
[1] A number of studies have suggested that the growing season duration has significantly lengthened during the past decades, but the connections between phenology variability and the terrestrial carbon (C) cycle are far from clear. In this study, we used the 090008ORganizing Carbon and Hydrology In Dynamic Ecosystems090009 (ORCHIDEE) process based ecosystem model together with observed climate data to investigate spatiotemporal changes in phenology and their impacts on carbon fluxes in the Northern Hemisphere (>2500°N) during 19800900092002. We found that the growing season length (GSL) has increased by 0.30 days yr0908081 (R2 = 0.27, P = 0.010), owing to the combination of an earlier onset in spring (0.16 days yr0908081) and a later termination in autumn (0.14 days yr0908081). Trends in the GSL are however highly variable across the regions. In Eurasia, there is a significant trend toward earlier vegetation green-up with an overall advancement rate of 0.28 days yr0908081 (R2 = 0.32, P = 0.005), while in North America there is a significantly delayed vegetation senescence by 0.28 days yr0908081 (R2 = 0.26, P = 0.013) during the study period. Our results also suggested that the GSL strongly correlates with annual gross primary productivity (GPP) and net primary productivity (NPP), indicating that longer growing seasons may eventually enhance vegetation growth. A 1-day extension in GSL leads to an increase in annual GPP of 5.8 gC m0908082 yr0908081 (or 0.6% per day), and an increase in NPP of 2.8 gC m0908082 yr0908081 per day. However, owing to enhanced soil carbon decomposition accompanying the GPP increase, a change in GSL correlates only poorly with a change in annual net ecosystem productivity (NEP).
|
| [9] |
Influence of spring and autumn phenological transitions on forest ecosystem productivity [J].https://doi.org/10.1098/rstb.2010.0102 URL PMID: 20819815 [本文引用: 1] 摘要
We use eddy covariance measurements of net ecosystem productivity (NEP) from 21 FLUXNET sites (153 site-years of data) to investigate relationships between phenology and productivity (in terms of both NEP and gross ecosystem photosynthesis, GEP) in temperate and boreal forests. Results are used to evaluate the plausibility of four different conceptual models. Phenological indicators were derived from the eddy covariance time series, and from remote sensing and models. We examine spatial patterns (across sites) and temporal patterns (across years); an important conclusion is that it is likely that neither of these accurately represents how productivity will respond to future phenological shifts resulting from ongoing climate change. In spring and autumn, increased GEP resulting from an 'extra' day tends to be offset by concurrent, but smaller, increases in ecosystem respiration, and thus the effect on NEP is still positive. Spring productivity anomalies appear to have carry-over effects that translate to productivity anomalies in the following autumn, but it is not clear that these result directly from phenological anomalies. Finally, the productivity of evergreen needleleaf forests is less sensitive to phenology than is productivity of deciduous broadleaf forests. This has implications for how climate change may drive shifts in competition within mixed-species stands.
|
| [10] |
Earlier springs decrease peak summer productivity in North American boreal forests [J]. |
| [11] |
Reduction in carbon uptake during turn of the century drought in western North America [J].https://doi.org/10.1038/ngeo1529 URL [本文引用: 1] 摘要
Fossil fuel emissions aside, temperate North America is a net sink of carbon dioxide at present1–3. Year-to-year variations in this carbon sink are linked to variations in hydroclimate that affect net ecosystem productivity3,4. The severity and incidence of climatic extremes, including drought, have increased as a result of climate warming5–8. Here, we examine the effect of the turn of the century drought in western North America on carbon uptake in the region, using reanalysis data, remote sensing observations and data from global monitoring networks.We show that the area-integrated strength of the western North American carbon sink declined by 30–298 Tg C yr''1 during the 2000–2004 drought. We further document a pronounced drying of the terrestrial biosphere during this period, together with a reduction in river discharge and a loss of cropland productivity. We compare our findings with previous palaeoclimate reconstructions7 and show that the last drought of this magnitude occurred more than 800 years ago. Based on projected changes in precipitation and drought severity, we estimate that the present mid-latitude carbon sink of 177–623 Tg C yr''1 in western North America could disappear by the end of the century.
|
| [12] |
The impact of growing season length variability on carbon assimilation andevapotranspiration over 88 years in the eastern US deciduousforest [J].https://doi.org/10.1007/s004840050097 URL PMID: 10083835 [本文引用: 1] 摘要
Recent research suggests that increases in growing-season length (GSL) in mid-northern latitudes may be partially responsible for increased forest growth and carbon sequestration. We used the BIOME-BGC ecosystem model to investigate the impacts of including a dynamically regulated GSL on simulated carbon and water balance over a historical 88-year record (1900 1987) for 12 sites in the eastern USA deciduous broadleaf forest. For individual sites, the predicted GSL regularly varied by more than 15 days. When grouped into three climatic zones, GSL variability was still large and rapid. There is a recent trend in colder, northern sites toward a longer GSL, but not in moderate and warm climates. The results show that, for all sites, prediction of a long GSL versus using the mean GSL increased net ecosystem production (NEP), gross primary production (GPP), and evapotranspiration (ET); conversely a short GSL is predicted to decrease these parameters. On an absolute basis, differences in GPP between the dynamic and mean GSL simulations were larger than the differences in NEP. As a percentage difference, though, NEP was much more sensitive to changes in GSL than were either GPP or ET. On average, a 1-day change in GSL changed NEP by 1.6%, GPP by 0.5%, and ET by 0.2%. Predictions of NEP and GPP in cold climates were more sensitive to changes in GSL than were predictions in warm climates. ET was not similarly sensitive. First, our results strongly agree with field measurements showing a high correlation between NEP and dates of spring growth, and second they suggest that persistent increases in GSL may lead to long-term increases in carbon storage.
|
| [13] |
A comparison of growing season indices for the Greater Baltic Area [J].https://doi.org/10.1007/s00484-006-0048-5 URL PMID: 16932889 [本文引用: 1] 摘要
Predictions of the effects of global warming suggest that climate change may have large impacts on ecosystems. The length of the growing season is predicted to increase in response to increasing global temperatures. The object of this study was to evaluate different indices used for calculating the thermal growing season for the Greater Baltic Area (GBA). We included established indices of growing season start, end and length, as well as new and modified indices. Based on the results, the GBA can be divided into a maritime western part and a more continental eastern part, with the western part reacting more sensitively to the use of different indices. The eastern part is more stable, but even here the index-to-index differences are large. It was found that including or excluding a frost criterion had a significant influence on the initiation of the growing season in the western, maritime, parts of the GBA. Frost has not the same importance for the end of the growing season. However, some end indices can result in a “never ending” growing season. When looking at twentieth century trends in growing season parameters, it was found that, when averaged over the whole GBA, there was little difference in trends depending on the indices used. The general mean trend in the GBA for the twentieth century discloses an earlier onset of c. 1202days, a delayed end of c. 802days and consequently a lengthening of the growing season of about 2002days.
|
| [14] |
全球变暖对太行山植被生产力及土壤水分的影响 [J].
将相同的自然植被用Lysimeter从高海拔下移至低海拔,温度升高2℃,同时设置平均降水、增加 10%降水、增加20%降水、减少10%降水和减少20%降水5个降水处理,模拟全球变暖带来的温度升高和降水变化对植被生产力和土壤水分的影响.两年的 野外实验表明,温度升高造成生态适应性差的野古草(Arundinelia hirta)生产力显著下降,致使整个测试群落生产力降低,低海拔实验点生产力显著低于高海拔实验点,温度升高对铁杆蒿(Artemisia sacrorum)和黄背草(Themeda japonica)的影响较小.太行山区的植被对降水的变化反映敏感,降水增加使植被的生产力水平显著提高,其中降水增加20%的处理生产力比平均降水处 理的生产力增加22%.增加降水处理的土壤含水量显著高于平均降水和降水减少的实验处理.由于植被的减少,温度升高的实验点从第二年开始土壤水分较高.
Yasuo SAKURA et al. Effects of global warming on productivity and soil moisture in Taihang Mountain:A transplant study .
将相同的自然植被用Lysimeter从高海拔下移至低海拔,温度升高2℃,同时设置平均降水、增加 10%降水、增加20%降水、减少10%降水和减少20%降水5个降水处理,模拟全球变暖带来的温度升高和降水变化对植被生产力和土壤水分的影响.两年的 野外实验表明,温度升高造成生态适应性差的野古草(Arundinelia hirta)生产力显著下降,致使整个测试群落生产力降低,低海拔实验点生产力显著低于高海拔实验点,温度升高对铁杆蒿(Artemisia sacrorum)和黄背草(Themeda japonica)的影响较小.太行山区的植被对降水的变化反映敏感,降水增加使植被的生产力水平显著提高,其中降水增加20%的处理生产力比平均降水处 理的生产力增加22%.增加降水处理的土壤含水量显著高于平均降水和降水减少的实验处理.由于植被的减少,温度升高的实验点从第二年开始土壤水分较高.
|
| [15] |
Climate change effects on vegetation distribution and carbon budget in the United States [J].https://doi.org/10.1007/s10021-001-0002-7 URL [本文引用: 1] |
| [16] |
A large and persistent carbon sink in the world’s forests [J].https://doi.org/10.1126/science.1201609 URL PMID: 21764754 [本文引用: 1] 摘要
The terrestrial carbon sink has been large in recent decades, but its size and location remain uncertain. Using forest inventory data and long-term ecosystem carbon studies, we estimate a total forest sink of 2.4 ± 0.4 petagrams of carbon per year (Pg C year(-1)) globally for 1990 to 2007. We also estimate a source of 1.3 ± 0.7 Pg C year(-1) from tropical land-use change, consisting of a gross tropical deforestation emission of 2.9 ± 0.5 Pg C year(-1) partially compensated by a carbon sink in tropical forest regrowth of 1.6 ± 0.5 Pg C year(-1). Together, the fluxes comprise a net global forest sink of 1.1 ± 0.8 Pg C year(-1), with tropical estimates having the largest uncertainties. Our total forest sink estimate is equivalent in magnitude to the terrestrial sink deduced from fossil fuel emissions and land-use change sources minus ocean and atmospheric sinks.
|
| [17] |
过去300年东北地区林地和草地覆盖变化 [J].https://doi.org/10.1016/j.elecom.2008.10.019 URL [本文引用: 1] Coverage changes of forestland and grassland in northeastern China during the past 300 years .https://doi.org/10.1016/j.elecom.2008.10.019 URL [本文引用: 1] |
| [18] |
Changes in forest biomass carbon storage in China between 1949 and 1998 [J].https://doi.org/10.1126/science.1058629 URL PMID: 11423660 [本文引用: 1] 摘要
Abstract The location and mechanisms responsible for the carbon sink in northern mid-latitude lands are uncertain. Here, we used an improved estimation method of forest biomass and a 50-year national forest resource inventory in China to estimate changes in the storage of living biomass between 1949 and 1998. Our results suggest that Chinese forests released about 0.68 petagram of carbon between 1949 and 1980, for an annual emission rate of 0.022 petagram of carbon. Carbon storage increased significantly after the late 1970s from 4.38 to 4.75 petagram of carbon by 1998, for a mean accumulation rate of 0.021 petagram of carbon per year, mainly due to forest expansion and regrowth. Since the mid-1970s, planted forests (afforestation and reforestation) have sequestered 0.45 petagram of carbon, and their average carbon density increased from 15.3 to 31.1 megagrams per hectare, while natural forests have lost an additional 0.14 petagram of carbon, suggesting that carbon sequestration through forest management practices addressed in the Kyoto Protocol could help offset industrial carbon dioxide emissions.
|
| [19] |
内蒙古典型草地CO2、N2O、CH4通量的同时观测及其日变化 [J].https://doi.org/10.3321/j.issn:0023-074X.2000.03.018 URL Magsci [本文引用: 1] 摘要
<p>利用黑色不透光气体采集箱, 沿450~200 mm 年降水梯度剖面对内蒙古温带草原典型草地 3 种主要温室气体CO<sub>2</sub>, N<sub>2</sub>O, CH<sub>4</sub> 通量进行现场测定. 结果表明, 内蒙古草地CO<sub>2</sub>, N<sub>2</sub>O, CH<sub>4</sub> 通量平均值分别为(1 180.4 ± 308.7), (0.010 ± 0.004), (-0.039 ± 0.016) mg·m<sup>-2</sup>· h<sup>-1</sup>, 3 种温室气体通量随着草地降水量的减少呈现降低的变化趋势, 人类活动放牧和草地开垦利用均表现对草地温室气体通量的明显影响, 揭示了草地温室气体通量的日变化特征及其与温度的正相关关系.</p>
CO2, N2O, CH4 fluxes observation and diurnal variation in Inner Mongolia grass land .https://doi.org/10.3321/j.issn:0023-074X.2000.03.018 URL Magsci [本文引用: 1] 摘要
<p>利用黑色不透光气体采集箱, 沿450~200 mm 年降水梯度剖面对内蒙古温带草原典型草地 3 种主要温室气体CO<sub>2</sub>, N<sub>2</sub>O, CH<sub>4</sub> 通量进行现场测定. 结果表明, 内蒙古草地CO<sub>2</sub>, N<sub>2</sub>O, CH<sub>4</sub> 通量平均值分别为(1 180.4 ± 308.7), (0.010 ± 0.004), (-0.039 ± 0.016) mg·m<sup>-2</sup>· h<sup>-1</sup>, 3 种温室气体通量随着草地降水量的减少呈现降低的变化趋势, 人类活动放牧和草地开垦利用均表现对草地温室气体通量的明显影响, 揭示了草地温室气体通量的日变化特征及其与温度的正相关关系.</p>
|
| [20] |
Climatic control of primary forest structure and DBH-heightallometry in Northeast China [J].https://doi.org/10.1016/j.foreco.2006.07.007 URL [本文引用: 1] 摘要
Northeast (NE) China harbors all major forest types in northern East Asia. We sampled 68 plots from all primary forest types across NE China to characterize the regional pattern of forest structure in relation to climate. The results indicated that forest structure and biomass differed greatly among forest types, and these differences were mainly a result of heat gradient. As heat increased, stem density decreased while diameter at breast height (DBH), tree height, total basal area, stand volume and biomass increased. Local site condition also had an important effect on forest structure. DBH–height relationship was significantly modulated by climate. With increasing winter coldness stress, a higher proportion of biomass was allocated for diameter growth than height growth. Our results provide evidences for climatic control of forest structure and DBH–height allometry across large scale.
|
| [21] |
A process-based boreal ecosystem productivity simulator using remote sensing inputs [J].https://doi.org/10.1016/S0034-4257(97)00089-8 URL [本文引用: 1] 摘要
This paper describes a boreal ecosystems productivity simulator (BEPS) recently developed at the Canada Centre for Remote Sensing to assist in natural resources management and to estimate the carbon budget over Canadian landmass (10-10km). BEPS uses principles of FOREST biogeochemical cycles (FOREST-BGC) (Running and Coughlan, 1988) for quantifying the biophysical processes governing ecosystems productivity, but the original model is modified to better represent canopy radiation processes. A numerical scheme is developed to integrate different data types: remote sensing data at 1-km resolution in lambert conformal conic projection, daily meteorological data in Gaussian or longitude-latitude gridded systems, and soil data grouped in polygons. The processed remote sensing data required in the model are leaf area index (LAI) and land-cover type. The daily meteorological data include air temperature, incoming shortwave radiation, precipitation, and humidity. The soil-data input is the available water-holding capacity. The major outputs of BEPS include spatial fields of net primary productivity (NPP) and evapotranspiration. The NPP calculated by BEPS has been tested against biomass data obtained in Quebec, Canada. A time series of LAI over the growing season of 1993 in Quebec was derived by using 10-day composite normalized difference vegetation index images acquired by the advanced very high resolution radiometer at 1-km resolution (resampled). Soil polygon data were mosaicked, georeferenced, and rasterized in a geographic information system (ARC/INFO). With the use of the process-based model incorporating all major environmental variables affecting plant growth and development, detailed spatial distributions of NPP (annual and four seasons) in Quebec are shown in this paper. The accuracy of NPP calculation is estimated to be 60% for single pixels and 75% for 3x3 pixel areas (9 km). The modeled NPP ranges from 0.6 kg C/m/year at the southern border to 0.01 kg C/m/year at the northern limit of the province. The total annual NPP in Quebec is estimated to be 0.24 Gt C in 1993, which is about 0.3-0.4% of the global NPP.
|
| [22] |
Net primary productivity distribution in the BOREAS region from a process model using satellite andsurface data [J].https://doi.org/10.1029/1999JD900768 URL [本文引用: 1] 摘要
The purpose of this paper is to upscale tower measurements of net primary productivity (NPP) to the Boreal Ecosystem-Atmosphere Study (BOREAS) study region by means of remote sensing and modeling. The Boreal Ecosystem Productivity Simulator (BEPS) with a new daily canopy photosynthesis model was first tested in one coniferous and one deciduous site. The simultaneous CO2 flux measurements above and below the tree canopy made it possible to isolate daily net primary productivity of the tree canopy for model validation. Soil water holding capacity and gridded daily meteorological data for the region were used as inputs to BEPS, in addition to 1 km resolution land cover and leaf area index (LAI) maps derived from the advanced very high resolution radiometer (AVHRR) data. NPP statistics for the various cover types in the BOREAS region and in the southern study area (SSA) and the northern study area (NSA) are presented. Strong dependence of NPP on LAI was found for the three major cover types: coniferous forest, deciduous forest and cropland. Since BEPS can compute total photosynthetically active radiation absorbed by the canopy in each pixel, light use efficiencies for NPP and gross primary productivity could also be analyzed. From the model results, the following area-averaged statistics were obtained for 1994: (1) mean NPP for the BOREAS region of 217 g C m0908082 yr0908081; (2) mean NPP of forests (excluding burnt areas in the region) equal to 234 g C m0908082 yr0908081; (3) mean NPP for the SSA and the NSA of 297 and 238 g C m0908082 yr0908081, respectively; and (4) mean light use efficiency for NPP equal to 0.40, 0.20, and 0.33 g C (MJ APAR)0908081 for deciduous forest, coniferous forest, and crops, respectively.
|
| [23] |
A general model of forest ecosystem processes for regional applications. I.Hydrologic balance, canopy gas exchange and primary production processes [J].https://doi.org/10.1016/0304-3800(88)90112-3 URL [本文引用: 1] 摘要
An ecosystem process model is described that calculates the carbon, water and nitrogen cycles through a forest ecosystem. The model, FOREST-BGC, treats canopy interception and evaporation, transpiration, photosynthesis, growth and maintenance respiration, carbon allocation above and below-ground, litterfall, decomposition and nitrogen mineralization. The model uses leaf area index ( lai) to quantify the forest structure important for energy and mass exchange, and this represents a key simplification for regional scale applications. FOREST-BGC requires daily incoming short-wave radiation, air temperature, dew point, and precipitation as driving variables. The model was used to simulate the annual hydrologic balance and net primary production of a hypothetical forest stand in seven contrasting environments across North America for the year 1984. Hydrologic partitioning ranged from 14/86/0% for evaporation, transpiration and outflow, respectively, in Fairbanks, AK (annual precipitation of 313 mm) to 10/27/66% in Jacksonville, FL (annual ppt of 1244 mm), and these balances changed as lai was increased from 3 to 9 in successive simulations. Net primary production ( npp) ranged from 0.0 t C ha 611 year 611 at Tucson, AZ, to 14.1 t C ha 611 year 611 at Knoxville, TN and corresponded reasonably with observed values at each site. The sensitivity of ecosystem processes to varying lai in different climates was substantial, and underscores the utility of parameterizing this model at regional scales in the future with forest lai measurements derived from satellite imagery.
|
| [24] |
A biochemical-model of photosynthetic CO2 assimilation in leaves of C3 species [J].https://doi.org/10.1007/BF00386231 URL PMID: 24306196 [本文引用: 1] 摘要
Various aspects of the biochemistry of photosynthetic carbon assimilation in C 3 plants are integrated into a form compatible with studies of gas exchange in leaves. These aspects include the kinetic properties of ribulose bisphosphate carboxylase-oxygenase; the requirements of the photosynthetic carbon reduction and photorespiratory carbon oxidation cycles for reduced pyridine nucleotides; the dependence of electron transport on photon flux and the presence of a temperature dependent upper limit to electron transport. The measurements of gas exchange with which the model outputs may be compared include those of the temperature and partial pressure of CO 2 ( p (CO 2 )) dependencies of quantum yield, the variation of compensation point with temperature and partial pressure of O 2 ( p (O 2 )), the dependence of net CO 2 assimilation rate on p (CO 2 ) and irradiance, and the influence of p (CO 2 ) and irradiance on the temperature dependence of assimilation rate.
|
| [25] |
Daily canopy photosynthesis model through temporal and spatial scaling for remote sensing applications [J].https://doi.org/10.1016/S0304-3800(99)00156-8 URL [本文引用: 1] 摘要
Because Farquhar’s photosynthesis model is only directly applicable to individual leaves instantaneously, considerable skill is needed to use this model for regional plant growth and carbon budget estimations. In many published models, Farquhar’s equations were applied directly to plant canopies by assuming a plant canopy to function like a big-leaf. This big-leaf approximation is found to be acceptable for estimating seasonal trends of canopy photosynthesis but inadequate for simulating its day-to-day variations, when compared with eddy-covariance and gas-exchange chamber measurements from two boreal forests. The daily variation is greatly dampened in big-leaf simulations because the original leaf-level model is partially modified through replacing stomatal conductance with canopy conductance. Alternative approaches such as separating the canopy into sunlit and shaded leaf groups or stratifying the canopy into multiple layers can avoid the problem. Because of non-linear response of leaf photosynthesis to meteorological variables (radiation, temperature and humidity), considerable errors exist in photosynthesis calculation at daily steps without considering the diurnal variability of the variables. To avoid these non-linear effects, we have developed an analytical solution to a simplified daily integral of Farquhar’s model by considering the general diurnal patterns of meteorological variables. This daily model not only captures the main effects of diurnal variations on photosynthesis but is also computationally efficient for large area applications. Its application is then not restricted by availability of sub-daily meteorological data. This scheme has been tested using measured CO2 data from the Boreal Ecosystem–Atmosphere Study (BOREAS), which took place in Manitoba and Saskatchewan in 1994 and 1996
|
| [26] |
Spatial distribution of net primary productivity and evapotranspiration in Changbaishan Natural Reserve, China, using Landsat ETM plus data [J].https://doi.org/10.5589/m04-040 URL [本文引用: 1] 摘要
Remote sensing has been a useful tool to monitor net primary productivity (NPP) and evapotranspiration (ET). In this paper, based on field measurements and Landsat enhanced thematic mapper plus (ETM+) data, NPP and ET are estimated in 2001 in the Changbaishan Natural Reserve, China. Maps of land cover, leaf area index, and biomass of this forested region are first derived from ETM+ data. With these maps and additional soil texture and daily meteorological data, NPP and ET maps are produced for 2001 using the boreal ecosystem productivity simulator (BEPS). The results show that the estimated and observed NPP values for forest agree fairly well, with a mean relative error of 8.6%. The NPP of mixed forests is the highest, with a mean of 500 g C m090009200·a0900091, and that of alpine tundra and shrub is the lowest, with a mean of 136 g C m090009200·a0900091. Unlike the spatial pattern of NPP, the annual ET changes distinctly with altitude from greater than 600 mm at the foot of the mountain to about 200 mm at the top of the mountain. ET is highest for broadleaf forests and lowest for urban and built-up areas.
|
| [27] |
Simulating the exchanges of carbon dioxide, water vapor and heat over Changbai Mountains temperate broad leaved Korean pine mixed forest ecosystem [J].https://doi.org/10.1360/05zd0015 URL [本文引用: 1] 摘要
process-based ecosystem productivity model BEPS (Boreal Ecosystem Productivity Simulator) was updated to simulate half-hourly exchanges of carbon, water and energy between the atmosphere and terrestrial ecosystem at a temperate broad-leaved Korean pine forest in the Changbai Mountains, China. The BEPSh model is able to capture the diurnal and seasonal variability in carbon dioxide, water vapor and heat fluxes at this site in the growing season of 2003. The model validation showed that the simulated net ecosystem productivity (NEP), latent heat flux (LE), sensible heat flux (Hs) are in good agreement with eddy covariance measurements with an R2 value of 0.68, 0.86 and 0.72 for NEP, LE and Hs, respectively. The simulated annual NEP of this forest in 2003 was 300.5 gC/m2, and was very close to the observed value. Driving this model with different climate scenarios, we found that the NEP in the Changbai Mountains temperate broad-leaved Korean pine mixed forest ecosystem was sensitive to climate variability
|
| [28] |
Net primary productivity of China’s terrestrial ecosystems from a process model driven by remote sensing [J].https://doi.org/10.1016/j.jenvman.2006.09.021 URL PMID: 17234327 [本文引用: 1] 摘要
The terrestrial carbon cycle is one of the foci in global climate change research. Simulating net primary productivity (NPP) of terrestrial ecosystems is important for carbon cycle research. In this study, China's terrestrial NPP was simulated using the Boreal Ecosystem Productivity Simulator (BEPS), a carbon-water coupled process model based on remote sensing inputs. For these purposes, a national-wide database (including leaf area index, land cover, meteorology, vegetation and soil) at a 102km resolution and a validation database were established. Using these databases and BEPS, daily maps of NPP for the entire China's landmass in 2001 were produced, and gross primary productivity (GPP) and autotrophic respiration (RA) were estimated. Using the simulated results, we explore temporal–spatial patterns of China's terrestrial NPP and the mechanisms of its responses to various environmental factors. The total NPP and mean NPP of China's landmass were 2.23502GtC and 235.202gC02m 612 02yr 611 , respectively; the total GPP and mean GPP were 4.41802GtC and 46502gC02m 612 02yr 611 ; and the total RA and mean RA were 2.22702GtC and 23402gC02m 612 02yr 611 , respectively. On average, NPP was 50.6% of GPP. In addition, statistical analysis of NPP of different land cover types was conducted, and spatiotemporal patterns of NPP were investigated. The response of NPP to changes in some key factors such as LAI, precipitation, temperature, solar radiation, VPD and AWC are evaluated and discussed.
|
| [29] |
Combining an ecological model with remote sensing and GIS techniques to monitor soil water content of croplands with a monsoon climate [J].https://doi.org/10.1016/j.agwat.2009.12.007 URL [本文引用: 1] 摘要
Soil water is an important factor affecting photosynthesis, transpiration, growth, and yield of crops. Accurate information on soil water content (SWC) is crucial for practical agricultural water management at various scales. In this study, remotely sensed parameters (leaf area index, land cover type, and albedo) and spatial data manipulated using the geographic information system (GIS) technique were assimilated into the boreal ecosystem productivity simulator (BEPS) model to monitor SWC dynamics of croplands in Jiangsu Province, China. The monsoon climate here is characterized by large interannual and seasonal variability of rainfall causing periods of high and low SWC. Model validation was conducted by comparing simulated SWC with measurements by a gravimetric method in the years 2005 and 2006 at nine agro-meteorological stations. The model-to-measurement R 2 values ranged from 0.40 to 0.82. Nash-Sutcliffe efficiency values were in the range from 0.10 to 0.80. Root mean square error (RMSE) values ranged from 0.028 to 0.05602m 3 02m 613 . Simulated evapotranspiration (ET) was consistent with ET estimated from pan evaporation measurements. The BEPS model successfully tracked the dynamics and extent of the serious soil water deficit that occurred during September–November 2006. These results demonstrate the applicability of combining process-based models with remote sensing and GIS techniques in monitoring SWC of croplands and improving agricultural water management at regional scales in a monsoon climate.
|
| [30] |
Changes of net primary productivity in China during recent 11 years detectedusing an ecological model driven by MODIS data [J].https://doi.org/10.1007/s11707-012-0348-5 URL [本文引用: 1] 摘要
Net primary productivity (NPP) is an important component of the terrestrial carbon cycle. Accurately mapping the spatial-temporal variations of NPP in China is crucial for global carbon cycling study. In this study the process-based Boreal Ecosystem Productivity Simulator (BEPS) was employed to study the changes of NPP in China’s ecosystems for the period from 2000 to 2010. The BEPS model was first validated using gross primary productivity (GPP) measured at typical flux sites and forest NPP measured at different regions. Then it was driven with leaf area index (LAI) inversed from the Moderate Resolution Imaging Spectroradiometer (MODIS) reflectance and land cover products and meteorological data interpolated from observations at 753 national basic meteorological stations to simulate NPP at daily time steps and a spatial resolution of 500 m from January 1, 2000 to December 31, 2010. Validations show that BEPS is able to capture the seasonal variations of tower-based GPP and the spatial variability of forest NPP in different regions of China. Estimated national total of annual NPP varied from 2.63 to 2.84Pg C·yr 611 , averaging 2.74 Pg C·yr 611 during the study period. Simulated terrestrial NPP shows spatial patterns decreasing from the east to the west and from the south to the north, in association with land cover types and climate. South-west China makes the largest contribution to the national total of NPP while NPP in the North-west account for only 3.97% of the national total. During the recent 11 years, the temporal changes of NPP were heterogamous. NPP increased in 63.8% of China’s landmass, mainly in areas north of the Yangtze River and decreased in most areas of southern China, owing to the low temperature freezing in early 2008 and the severe drought in late 2009.
|
| [31] |
Interpolating mean rainfall using thin platesmoothing splines [J].https://doi.org/10.1080/02693799508902045 URL [本文引用: 1] 摘要
Thin plate smoothing splines provide accurate, operationally straightforward and computationally efficient solutions to the problem of the spatial interpolation of annual mean rainfall for a standard period from point data which contains many short period rainfall means. The analyses depend on developing a statistical model of the spatial variation of the observed rainfall means, considered as noisy estimates of standard period means. The error structure of this model has two components which allow separately for strong spatially correlated departures of observed short term means from standard period means and for uncorrelated deficiencies in the representation of standard period mean rainfall by a smooth function of position and elevation. Thin plate splines, with the degree of smoothing determining by minimising generalised cross validation, can estimate this smooth function in two ways. First, the spatially correlated error structure of the data can be accommodated directly by estimating the corresponding non-diagonal error covariance matrix. Secondly, spatial correlation in the data error structure can be removed by standardising the observed short term means to standard period mean estimates using linear regression. When applied to data both methods give similar interpolation accuracy, and error estimates of the fitted surfaces are in good agreement with residuals from withheld data. Simplified versions of the data error model, which require only minimal summary data at each location, are also presented. The interpolation accuracy obtained with these models is only slightly inferior to that obtained with more complete statistical models. It is shown that the incorporation of a continuous, spatially varying, dependence on appropriately scaled elevation makes a dominant contribution to surface accuracy. Incorporating dependence on aspect, as determined from a digital elevation model, makes only a marginal further improvement.
|
| [32] |
ANUSPLIN Version 4.2 User Guide. Centre for resource and environment studies [J]. |
| [33] |
近50年中国光合有效辐射的时空变化特征 [J].Liu Min et al. Spatio-temporal variation characteristics of photo synthetically active radiation in China in recent 50 years . |
| [34] |
Defining leaf area index for non-flatleaves, Plant [J].https://doi.org/10.1111/j.1365-3040.1992.tb00992.x URL [本文引用: 1] 摘要
To eliminate the confusion in the definition of leaf area index ( L ) for non-flat leaves, the projection coefficients of several objects including spheres, cylinders, hemicircular cylinders, and triangular and square bars are investigated through mathematical derivation and numerical calculation for a range of ellipsoidal angular distributions. It is shown that the projection coefficient calculated based on half the total intercepting area is close to a constant of 0.5 when the inclination angle of the objects is randomly (spherically) distributed, whereas the calculated results based on the object's largest projected area are strongly dependent on the shape of the objects. Therefore, it is suggested that the leaf area index of non-flat leaves be defined as half the total intercepting area per unit ground surface area and that the definition of L based on the projected leaf area be abandoned.
|
| [35] |
2000-2010年中国森林叶面积指数时空变化特征 [J].
森林是重要的陆地生态系统, 其叶面积指数(leaf area index, LAI)是决定该生态系统与大气之间物质和能量交换的关键参数. 利用MOD 09A1 及MCD 43A1 数据和基于4 尺度几何光学模型的反演算法, 生成了中国森林2000~2010 年每8 天的500 m LAI 产品, 并利用6 个典型森林样区的LAI 观测数据对该LAI 产品进行了验证. 在此基础上, 分析了2000~2010 年间我国森林LAI 的时空分布特征及其与温度和降水之间关系. 结果表明, 利用MODIS 数据反演生成的500 m LAI 产品具有可靠的质量, 6 个典型森林样区的验证精度达到70%以上; 2000~2010 年间,我国东北、华北、中南部地区森林LAI 呈增加趋势, 但在东南部和西南地区森林LAI 呈下降趋势, 主要原因是2008~2010 年该地区的LAI 明显下降. 森林LAI 年平均值与年平均气温在东北地区正相关, 在西南地区负相关; 在华北和中南部地区LAI 年平均值与年降水量正相关. 2001 和2009 年的异常气候导致我国秦岭和淮河以南地区的森林LAI 明显低于常年, 部分地区的LAI 年平均值较正常年份下降1.0 左右.
Chen Jingming et al. Spatial and temporal variations of forest LAI in China during 2000-2010 .
森林是重要的陆地生态系统, 其叶面积指数(leaf area index, LAI)是决定该生态系统与大气之间物质和能量交换的关键参数. 利用MOD 09A1 及MCD 43A1 数据和基于4 尺度几何光学模型的反演算法, 生成了中国森林2000~2010 年每8 天的500 m LAI 产品, 并利用6 个典型森林样区的LAI 观测数据对该LAI 产品进行了验证. 在此基础上, 分析了2000~2010 年间我国森林LAI 的时空分布特征及其与温度和降水之间关系. 结果表明, 利用MODIS 数据反演生成的500 m LAI 产品具有可靠的质量, 6 个典型森林样区的验证精度达到70%以上; 2000~2010 年间,我国东北、华北、中南部地区森林LAI 呈增加趋势, 但在东南部和西南地区森林LAI 呈下降趋势, 主要原因是2008~2010 年该地区的LAI 明显下降. 森林LAI 年平均值与年平均气温在东北地区正相关, 在西南地区负相关; 在华北和中南部地区LAI 年平均值与年降水量正相关. 2001 和2009 年的异常气候导致我国秦岭和淮河以南地区的森林LAI 明显低于常年, 部分地区的LAI 年平均值较正常年份下降1.0 左右.
|
| [36] |
21世纪前十年的中国土地覆盖变化 [J].https://doi.org/10.3969/j.issn.1001-7410.2014.04.04 URL Magsci [本文引用: 1] 摘要
土地覆盖变化是陆地生态系统变化的重要组成部分与驱动因素。在全球变化、生态环境建设、经济高速发展等因素的影响下,21世纪前十年中国土地覆盖发生了显著变化,对此变化的监测和分析不但能支持中国碳源/汇的评估和碳收支估算,还可为生态环境变化评估提供基础数据。本研究在面向对象(object-based)的分类技术支持下,利用LandsatTM/ETM数据和HJ-1卫星数据,结合大量外业调查数据生产了30m分辨率的2000年、2010年中国土地覆盖数据(ChinaCover);采用像元二分法生产了植被覆盖度数据。利用这两个数据集对中国土地覆盖10年的变化特点进行了分析。结果表明,人工表面和林地呈增加趋势,而耕地、湿地和草地面积呈减少的趋势;人工表面的快速增加和耕地面积的大规模减少是这一时期中国土地覆盖变化的最主要特点;土地覆盖类型转换中,耕地转换为人工表面的区域主要集中在我国中东部地区,耕地转换为林地和草地的区域主要分布在退耕还林还草的重点区域,耕地的扩张主要来自三江平原和新疆绿洲的农业开发。以植被覆盖度为评估指标显示森林、灌丛和草地质量总体呈上升趋势,但在汶川地震重灾区、横断山以及武夷山等局部地区的森林质量呈退化趋势;塔里木盆地周围、青藏高原东部、太行山、吕梁山等地区的灌丛植被覆盖度有所下降;内蒙古中部、青藏高原西南部、新疆天山南部、呼伦贝尔等地区的草地出现退化现象。
Land cover changes of China from 2000 to 2010 .https://doi.org/10.3969/j.issn.1001-7410.2014.04.04 URL Magsci [本文引用: 1] 摘要
土地覆盖变化是陆地生态系统变化的重要组成部分与驱动因素。在全球变化、生态环境建设、经济高速发展等因素的影响下,21世纪前十年中国土地覆盖发生了显著变化,对此变化的监测和分析不但能支持中国碳源/汇的评估和碳收支估算,还可为生态环境变化评估提供基础数据。本研究在面向对象(object-based)的分类技术支持下,利用LandsatTM/ETM数据和HJ-1卫星数据,结合大量外业调查数据生产了30m分辨率的2000年、2010年中国土地覆盖数据(ChinaCover);采用像元二分法生产了植被覆盖度数据。利用这两个数据集对中国土地覆盖10年的变化特点进行了分析。结果表明,人工表面和林地呈增加趋势,而耕地、湿地和草地面积呈减少的趋势;人工表面的快速增加和耕地面积的大规模减少是这一时期中国土地覆盖变化的最主要特点;土地覆盖类型转换中,耕地转换为人工表面的区域主要集中在我国中东部地区,耕地转换为林地和草地的区域主要分布在退耕还林还草的重点区域,耕地的扩张主要来自三江平原和新疆绿洲的农业开发。以植被覆盖度为评估指标显示森林、灌丛和草地质量总体呈上升趋势,但在汶川地震重灾区、横断山以及武夷山等局部地区的森林质量呈退化趋势;塔里木盆地周围、青藏高原东部、太行山、吕梁山等地区的灌丛植被覆盖度有所下降;内蒙古中部、青藏高原西南部、新疆天山南部、呼伦贝尔等地区的草地出现退化现象。
|
| [37] |
Observed coherent changes in climatic extremes during the second half of the twentieth century [J].https://doi.org/10.3354/cr019193 URL [本文引用: 1] 摘要
Abstract A new global dataset of derived indicators has been compiled to clarify whether frequency and/or severity of climatic extremes changed during the second half of the 20th century, This period provides the best spatial coverage of homogenous daily series, which can be used for calculating the proportion of global land area exhibiting a significant change in extreme or severe weather. The authors chose 10 indicators of extreme climatic events, defined from a larger selection, that could be applied to a large variety of climates. It was assumed that data producers were more inclined to release derived data in the form of annual indicator time series than releasing their original daily observations. The indicators are based on daily maximum and minimum temperature series, as well as daily totals of precipitation, and represent changes in all seasons of the year. Only time series which had 40 yr or more of almost complete records were used, A total of about 3000 indicator time series were extracted from national climate archives and collated into the unique dataset described here. Global maps showing significant changes from one multi-decadal period to another during the interval from 1946 to 1999 were produced. Coherent spatial patterns of statistically significant changes emerge, particularly an increase in warm summer nights, a decrease in the number of frost days and a decrease in intra-annual extreme temperature range. All but one of the temperature-based indicators show a significant change. Indicators based on daily precipitation data show more mixed patterns of change but significant increases have been seen in the extreme amount derived from wet spells and number of heavy rainfall events. We can conclude that a significant proportion of the global land area was increasingly affected by a significant change in climatic extremes during the second half of the 20th century. These clear signs of change are very robust; however, large areas are still not represented, especially Africa and South America.
|
| [38] |
近50年内蒙古地区生长季变化趋势 [J].
<p>以内蒙古地区47 个气象站点1961~2010 年气象数据为基础,应用Mann-Kendall 趋势性检验和线性回归法分析了不同指标下内蒙古地区生长季变化趋势特征以及区域差异。结果表明:1961~2010 年内蒙古地区生长季长度增加趋势明显,增加幅度约为13.0~17.0 d,各指标间差异小、一致性较高,可作为表征该区温度变化的一个重要应用指标;整个内蒙古地区生长季趋势的平均状态很大程度上掩盖了指标间的区域差异,内蒙古中西部地区生长季变化对温度阈值比较敏感,阿拉善盟地区0℃阈值生长季开始时间提前、生长季长度延长较强烈,乌兰察布盟以及锡林郭勒盟等地10℃阈值生长季结束时间延后、生长季长度增加更为突出;有无霜期限制对内蒙古中部大部分地区生长季趋势影响较大,尤其是对生长季开始时间。</p>
Change trends of growing season over Inner Mongolia in the past 50 years .
<p>以内蒙古地区47 个气象站点1961~2010 年气象数据为基础,应用Mann-Kendall 趋势性检验和线性回归法分析了不同指标下内蒙古地区生长季变化趋势特征以及区域差异。结果表明:1961~2010 年内蒙古地区生长季长度增加趋势明显,增加幅度约为13.0~17.0 d,各指标间差异小、一致性较高,可作为表征该区温度变化的一个重要应用指标;整个内蒙古地区生长季趋势的平均状态很大程度上掩盖了指标间的区域差异,内蒙古中西部地区生长季变化对温度阈值比较敏感,阿拉善盟地区0℃阈值生长季开始时间提前、生长季长度延长较强烈,乌兰察布盟以及锡林郭勒盟等地10℃阈值生长季结束时间延后、生长季长度增加更为突出;有无霜期限制对内蒙古中部大部分地区生长季趋势影响较大,尤其是对生长季开始时间。</p>
|

/
| 〈 |
|
〉 |