杨丽 , 傅春
, 傅春
Yang Li, Fu Chun
中图分类号: F301.2;S718.54
文献标识码: A
文章编号: 1000-0690(2018)03-0457-07
收稿日期: 2017-03-7
修回日期: 2017-05-26
网络出版日期: 2018-03-21
版权声明: 2018 《地理科学》编辑部 本文是开放获取期刊文献,在以下情况下可以自由使用:学术研究、学术交流、科研教学等,但不允许用于商业目的.
基金资助:
作者简介:
作者简介:杨丽(1982-),女,山东临沂人,讲师,主要从事资源与环境管理研究。E-mail: yangli46@ncu.edu.cn
展开
摘要
基于2000年和2010年土地利用遥感数据,从自然、区位、交通、人口和经济4个角度选取驱动因子,利用Logistic-CA-Markov土地利用综合模型预测赣南森林有林地、灌木林、疏林地和其它林地4种林地类型在当前模式、规划模式和保护模式3种情景下的空间演变格局。结果表明:① 到2020年,在当前模式和规划模式,林地总面积将减少,在保护模式则出现增加,3种情景都体现出有林地和其它林地增加、疏林地和灌木林缩减的趋势,只是增减幅度不同,但不论何种情形林地的组成结构都将发生较大程度的变化;② 3种情景都是以疏林地→有林地、有林地→其它林地和灌木林→有林地这3种类型的转化为主,向有林地的转化分布都比较分散,而向其它林地的转化却集中在安远、信丰、于都、赣县四县交界处;③ 相较于当前模式,在规划模式下集中在安远县及其周边的有林地向其它林地的转化出现大量缩减,在保护模式下这种缩减更加明显。
关键词:
Abstract
Gannan forest is an important safety barrier in southeast China. It belongs to Nanling Mountain forest and biodiversity reserve of China. To analyze the evolution trend of Gannan forest, driving factors is chosen from the perspectives of natural, geographic, geographic traffic and economic and a Logistic-CA-Markov model is constructed based on land use of the year 2000 and 2010. According to the development status and existing issues in Gannan, three scenes are set to predict the spatial transfer pattern of closed forest land, shrubbery, open forest land and other forest land, which are current pattern, land use planning and forest protecting. The results show that: 1) Key driving forces for forest land use change are human activities, society and economy. Location and environment variables are secondary causes. For the change of closed forest land, shrubbery and other forest land, GDP and population are key explaining variables. For open forest land, the key driving force of its change is gradients. 2) In 2020, the area of total forest land will decrease under current trend scenario and land use planning scenario, while under forest protecting scenario there is an augment. No matter in which scenario, the increase of closed forest land and other forest land and the decline of open forest land and shrubbery are obvious, and the construction of forest land will definitely change a lot. 3) The main transfer trend in 3 scenarios are open forest land to closed forest land, closed forest land to other forest land and shrubbery to closed forest land. The transfer to closed forest land is dispersedly distributed, while the transfer to other forest land is concentrated in Anyuan County and its circum. 4) Compared to current trend scenario, the transfer from closed forest land use to other forest land will have a big shrinkage in land use planning scenario and the shrinkage will be lager in forest protecting scenario. In all, on one hand, the natural forest and planted forest of high canopy density is in a recovery increase, which shows that policies and regulation to protect forest resource has achieved initial success. On the other hand, with the development of urbanization and economic construction, the social and economic factors are posing greater influence to forest. The economy rise will accelerate forest land expansion structural adjustment of agriculture mobilized by forestry and fruit growing leads to rapid expansion of economic forest. But the farmland and construction land will erode the forest land in unavoidable way under urbanization background. The contradiction between forestry development and peasant’s life demand is becoming obvious.
Keywords:
土地利用与土地覆盖变化( Land-Use and Land-Cover Change,LUCC)是影响全球气候变化、生物多样性和生态系统服务的主要环境因素[1],随着人类对土地利用与覆盖的改变速度达到有史以来最高水平,关于LUCC的研究已成为全球变化研究的前沿和热点课题[2]。LUCC的演化趋势以及LUCC是如何受到复杂的自然、经济、社会等因素的影响的是当前研究的热点课题[3]。
在土地利用格局的影响因素识别和不同情景方案下LUCC的模拟研究中,综合模型引起了学者们的重视。除了基于土地利用变化及效应(CLUE)模型[4]构建综合模型外,近年来很多研究基于元胞自动机(Cellular Automata, CA)构建综合模型。CA作为一种经典的土地利用演化模型,具有很强的模拟空间复杂系统时空动态演变的能力,在地理信息系统(Geographic Information System,GIS)中融入CA,可弥补GIS只能提供静态分析的劣势,使复杂空间系统建模成为可能[5]。CA的核心是转换规则[6],模拟结果受转换规则中与空间变量相关的参数的影响显著[7],需结合其他方法对CA进行校正。例如Clarke等[8]提出利用目视模拟结果判断的粗略方法来获取最优参数组合,但该方法过于简单,且当变量集非常大时将导致方法的有效性降低[9]。随后,基于层次分析法(AHP)的启发式的参数确定方式也被应用到CA中来[10]。不久后,逻辑回归(Logistic Regression)也被引入到模型中来获取转移法则[11]。另外,神经网络CA被开发用来处理复杂的变量关系并可以自动获取变量的值[9],Mika等[12]也于1999年在传统的线性Fisher判别法的基础之上提出核Fisher判别方法,实现了向非线性判别的跨越。目前CA方法已被成功地应用到土地利用变化、城市发展、生物繁殖、化学自组织系统、人类移居变化等复杂系统中[13,14],但是国内以森林地区为研究对象、针对不同林地类型对土地利用格局进行模拟预测以描述森林系统变化研究尚不多见。
赣南是赣州市的简称,位于赣江上游, 133°54'~166°38'E,24°29'~27°09'N,堪称“生态王国”和“绿色宝库”,属于国家生态屏障中的南岭山地森林生物多样性保护区。近年来,由于经济发展方式粗放、产业结构不合理和人类强烈不合理的开发活动使赣南生态脆弱性明显[15]。本文以赣南为研究区域,采用比较成熟的Logistic-CA-Markov空间统计综合模型,以2000年和2010年土地利用情况为基准,在当前模式、规划模式和保护模式3种不同的情景下针对不同林地类型对赣南森林土地利用格局进行模拟预测,分析每种情景下林地空间格局演变和有林地、灌木林、疏林地和其它林地4种林地地类的转入转出空间分布特征。
本研究基础数据主要来源于中国科学院资源环境科学数据中心(http://www.resdc.cn),包括2000年和2010年的1∶10万土地利用现状遥感监测数据、人口空间分布网格数据、GDP空间分布公里网格数据、年平均降水量数据、年平均气温数据、海拔高度(DEM)空间分布数据、土壤类型空间分布数据和植被类型空间分布数据;主要交通和河流等矢量数据来源于地球系统科学数据共享平台(www.geodata.cn)。结合林业行业标准和土地利用遥感数据的分类方法,将土地利用类型分为8类:耕地、有林地、疏林地、灌木林、其它林地、草地、水域和城乡工矿居民用地,其中数量极少的裸土地和裸岩石质地被合并到耕地中;根据DEM数据分析地形特征可得到坡向和坡度数据;基于道路、河流等及土地利用数据计算可得各栅格到道路、水系的距离以及到城乡工矿居民用地的距离等距离图层。从研究精度和复杂度上考虑,在后续研究中设置栅格大小为1 000 m×1 000 m。
Logistic-CA-Markov耦合模型兼具Markov模型在时间维度上的模拟能力、CA对复杂系统空间模拟的优势以及Logistic回归对影响因素的辨识能力[16]。研究区8类土地利用类型对应CA元胞的8个状态,整个地区对应的所有的栅格点构成了本文的元胞空间。在Logistic回归驱动因子选取方面,本文以因子的代表性、区域差异性和资料的可获得性为原则,结合现有研究成果和赣南森林的实际情况[17,18],从自然、区位、交通、人口和经济角度选取有代表性的11个指标:到最近的城乡、工矿、居民用地的距离(X1)、到公路的距离(X2)、到河流的距离(X3)、坡向(X4)、坡度(X5)、GDP(X6)、人口(X7)、年平均降水量(X8)、植被类型(X9)、土壤类型(X10)和年平均气温(X11)。
根据未来赣南森林开发与保护的可能性设置了3个情景进行预测:① 当前模式。假设2010~2020年变化趋势与2000~2010年一致。在IDRISI 15.0平台中,将研究区2000年和2010年的土地覆盖遥感数据输入Markov模型,得到转移面积矩阵(表1),当前模式就是根据该转移面积矩阵进行预测。Markov转移矩阵显示,10 a间林地的变化主要是2种:一种是林地内部的相互转化,另一种是林地和耕地之间的相互转化。首先,在林地内部的相互转化中,疏林地和灌木林向有林地转化以及有林地向其它林地转化最为突出。② 规划模式。根据《赣州市土地利用总规划(2006~2020)》[19]土地利用策略中农用地结构调整和建设用地结构调整规划要求:相比2005年,耕地、园地、林地、建设用地分别将净增5 921 hm2、31 836 hm2、3 051 hm2和19 974 hm2,牧草地面积不变;其中耕地主要转出为林地和城乡、建设用地、园地等,转入来源主要为农村居民点、林地、园地和土地开发;园地和林地面积增加主要来自土地开发;新增城镇及农村用地占用农用地12 943 hm2。依此总目标,参照2005年的土地利用类型的面积,可得2020年各土地利用类型面积的目标值,对照当前趋势发现,草地向耕地的转化偏多,其它林地的转入偏多,城乡、工矿、居民用地在限制范围之内,由此调整Markov转移矩阵,主要是减少草地向耕地的转化,减少有林地向其它林地的转化(表1)。③ 保护模式。模拟到2020年封山育林、不进行任何人工砍伐时森林的演变趋势。在当前趋势下,森林资源保护存在的主要问题是郁闭度较高的有林地和灌木林不断被果园或苗圃等经济用地类型侵蚀,另外也存在林地被占用为耕地的问题。因此,假设加强封山育林、增强对天然林的保护,切实落实退耕还林,由此对Markov面积转移矩阵做出以下调整:减少有林地、灌木林、疏林地向耕地、城乡、工矿、居民用地的转出,减少有林地、灌木林向疏林地、其它林地的转出并适当调整其它土地利用类型的转入转出,增加疏林地、其它林地向灌木林、有林地的转出(表1)。
表1 基于Markov转移面积矩阵的3种情景设定(km2)
Table 1 Three scenarios set by Markov Area Transfer Matrix (km2)
| 当前模式 | ||||||||
|---|---|---|---|---|---|---|---|---|
| 土地利用类型 | 耕地 | 有林地 | 灌木林 | 疏林地 | 其它林地 | 草地 | 水域 | 城乡、工矿、居民用地 |
| 耕地 | 6823 | 29 | 0 | 2 | 25 | 0 | 0 | 10 |
| 有林地 | 95 | 20450 | 1 | 24 | 357 | 1 | 0 | 1 |
| 灌木林 | 4 | 121 | 1278 | 0 | 11 | 0 | 0 | 3 |
| 疏林地 | 32 | 577 | 0 | 5877 | 27 | 1 | 0 | 4 |
| 其它林地 | 8 | 28 | 0 | 0 | 603 | 0 | 0 | 0 |
| 草地 | 33 | 27 | 0 | 5 | 6 | 2084 | 0 | 0 |
| 水域 | 1 | 1 | 0 | 0 | 0 | 0 | 369 | 0 |
| 城乡、工矿、居民用地 | 3 | 2 | 0 | 0 | 0 | 0 | 0 | 352 |
| 规划模式 | ||||||||
| 土地利用类型 | 耕地 | 有林地 | 灌木林 | 疏林地 | 其它林地 | 草地 | 水域 | 城乡、工矿、居民用地 |
| 耕地 | 6823 | 29 | 0 | 2 | 25 | 0 | 0 | 10 |
| 有林地 | 95 | 20568 | 1 | 24 | 239 | 1 | 0 | 1 |
| 灌木林 | 4 | 121 | 1278 | 0 | 11 | 0 | 0 | 3 |
| 疏林地 | 32 | 577 | 0 | 5877 | 27 | 1 | 0 | 4 |
| 其它林地 | 8 | 28 | 0 | 0 | 603 | 0 | 0 | 0 |
| 草地 | 4 | 27 | 0 | 5 | 6 | 2133 | 0 | 0 |
| 水域 | 1 | 1 | 0 | 0 | 0 | 0 | 369 | 0 |
| 城乡、工矿、居民用地 | 3 | 2 | 0 | 0 | 0 | 0 | 0 | 352 |
| 保护模式 | ||||||||
| 土地利用类型 | 耕地 | 有林地 | 灌木林 | 疏林地 | 其它林地 | 草地 | 水域 | 城乡、工矿、居民用地 |
| 耕地 | 6823 | 29 | 0 | 2 | 25 | 0 | 0 | 10 |
| 有林地 | 29 | 20739 | 1 | 1 | 157 | 1 | 0 | 1 |
| 灌木林 | 0 | 121 | 1290 | 0 | 6 | 0 | 0 | 0 |
| 疏林地 | 32 | 584 | 0 | 5877 | 20 | 1 | 0 | 4 |
| 其它林地 | 8 | 78 | 0 | 0 | 553 | 0 | 0 | 0 |
| 草地 | 33 | 27 | 0 | 5 | 6 | 2084 | 0 | 0 |
| 水域 | 1 | 1 | 0 | 0 | 0 | 0 | 369 | 0 |
| 城乡、工矿、居民用地 | 3 | 2 | 0 | 0 | 0 | 0 | 0 | 352 |
在ArcGIS 10.2中对Logistic回归解释变量的数据进行标准化,在IDRISI 15.0平台将各驱动因素组成标准化图集,分别以2000~2010年各类林地变化数据为因变量做Logistic回归,从11个自变量中确定显著驱动因子及系数估计值(表2)。利用Pontius[20]提出的ROC( Relative Operating Characteristics)方法进行检验,ROC值都在0.80以上说明回归方程可信。
表2 2000~2010年间的逻辑回归结果
Table 2 Results of Logistic Regression of 2000-2010
| 空间变量 | 常数项 | X1 | X2 | X3 | X4 | X5 | X6 | X7 | X8 | X9 | X10 | X11 | ROC |
|---|---|---|---|---|---|---|---|---|---|---|---|---|---|
| 有林地 | -5.7 | 1.3 | 0.8 | 0.6 | 0.4 | 3.9 | 4.3 | -17.7 | 1.7 | -0.6 | 4.3 | 0.9 | 0.92 |
| 灌木林 | -4.3 | 0.0 | 0.2 | 0.8 | -0.1 | 1.3 | 4.4 | -7.0 | 0.2 | -0.1 | -1.4 | 1.9 | 0.80 |
| 疏林地 | -3.1 | 0.7 | -0.3 | 0.6 | -0.4 | -2.6 | -0.9 | 0.6 | -0.8 | 0.4 | 1.2 | 1.3 | 0.84 |
| 其它林地 | -8.0 | 0.3 | 2.1 | 4.4 | 0.1 | 0.4 | 4.9 | -13.7 | -0.1 | 0.1 | -2.3 | 3.8 | 0.88 |
对有林地、灌木林和其它林地而言, GDP(X6)和人口(X7)是关键解释变量。其中,GDP(X6)对这3种林地类型的回归系数符号都为正,说明林地面积与研究区经济的发展有着密切联系,GDP(X6)越高的区域转化为林地的概率越高;人口(X7)在对这3种林地的回归中,呈现显著的负回归系数,说明人口越多的区域转化为林地的概率越低。疏林地变化的关键驱动因子是坡度(X5),回归系数为负,说明坡度对疏林地的生长有显著影响,坡度越大越不适宜向疏林地转变。坡度(X5)也是对3种林地的变化的重要解释变量,特别是有林地对坡度(X5)的显著正系数说明坡度大有利于向有林地的转化。另外,土壤类型(X10)、年平均气温(X11)、到
河流的距离(X3)和到公路的距离(X2)等自然环境和区位因素也是林地变化的重要驱动因素,对林地变化有着不同程度的影响;到最近的城乡、工矿、居民用地的距离(X1)对林地变化的回归结果表明,到城乡、工矿、居民用地的距离越远,转化为有林地、疏林地和其它林地的概率越高,该变量关于有林地的回归系数最大,说明远离人类活动的地区更有利于有林地的形成。
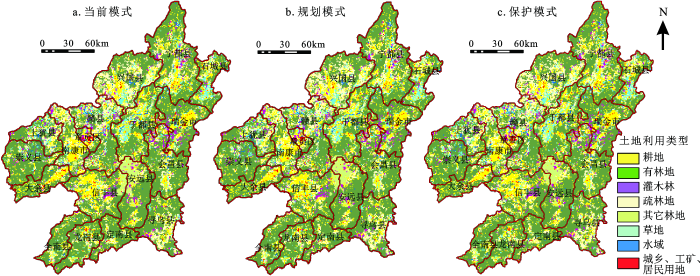
结合3种情景的Markov转移矩阵,以2010年为基期模拟2020年的林地空间分布状况(图1)。
图1 2020年3种情景下赣南土地利用模拟格局
Fig.1 Simulated spatial patterns for three scenarios in 2020
对每种情景下2020年各土地利用类型的面积进行统计(表3)。结果显示:若继续2000~2010年土地覆盖转化方式和速率,到2020年林地总面积将减少50 km2,其它林地和有林地将分别增加390 km2和310 km2;疏林地和灌木林将分别减少620 km2和130 km2,减少比例都接近10%。与《赣州市土地利用总规划(2006~2020)》相比,有林地大量被侵占为其它林地,林地资源保护堪忧。
表3 预测的2020年各土地利用类型的面积(km2)
Table 3 Detailed area and percent of predicted land use in 2020 (km2)
| 土地利用 类型 | 2010年 | 2020年 | ||
|---|---|---|---|---|
| 当前模式 | 规划模式 | 保护模式 | ||
| 耕地 | 6890 | 7000 | 6970 | 6930 |
| 有林地 | 20929 | 21239 | 21359 | 21579 |
| 灌木林 | 1416 | 1286 | 1286 | 1286 |
| 疏林地 | 6518 | 5898 | 5898 | 5888 |
| 其它林地 | 639 | 1029 | 909 | 769 |
| 草地 | 2155 | 2085 | 2115 | 2085 |
| 水域 | 371 | 371 | 371 | 371 |
| 城乡、工矿、居民用地 | 364 | 374 | 374 | 374 |
在规划模式下,到2020年,森林总面积也将减少50 km2。林地的变化也体现为其它林地、有林地的增加和另外两种林地的缩减,其它林地的增加面积(270 km2)只稍低于当前模式,有林地的增加(430 km2)较当前模式偏高。灌木林和疏林地的减少与当前模式相同。另外,耕地面积增加(80 km2)低于当前模式,城乡、工矿、居民用地面积增加幅度与当前模式相同。该情景兼顾了社会经济的发展,同时也考虑了对生态环境的保护,增强了土地的可持续发展性。
在保护模式下,到2020年,林地的总面积将增加20 km2,4类林地增减模式与前2种情景类似,但有林地面积增加(650 km2)更加显著,说明森林保护政策使得封山育林的成效更加凸显,其它林地的增加面积 (130 km2)则大幅减少;由于向有林地的大量转化,灌木林和疏林地的减少仍显著。另外,林地面积的增加压缩了耕地的空间,耕地的面积增量相对于当前模式少了80 km2;虽然在Markov转移面积矩阵中减少了林地向城乡、工矿、居民用地的转化,但城乡、工矿、居民用地面积与当前模式相同。森林资源结构一定程度上得以优化,但仍无法改变灌木林缩减的趋势。
将3幅预测图与2010年土地利用遥感图像进行合并,利用属性表可得主要的转化类型和数目,对栅格点重新分类,分析3种情景下2010~2020年林地转入转出在赣南各区县的空间分布。
当前模式,有林地的转入转出较多,转入(781 km2)大于转出(472 km2),疏林地的转出(640 km2)远大于转入(20 km2),灌木林只有转出(130 km2)无转入,其它林地转入(424 km2)远大于转出(40 km2)。主要的3种转化是:疏林地→有林地、有林地→其它林地和灌木林→有林地。其中,向有林地的转化呈分散分布,主要位于离人类活动区域较远的山区,说明随着城镇化的推进,在人类活动减少的区域有林地出现恢复性增长。有林地→其它林地的大量转化印证了“林地短缺路径”理论[21],经济增长促使林木产品需求增加,价格信号驱动人工林扩张,而在促进生态经济过程中,农业、旅游业等的不断发展使耕地或林地倾向于被改造成柑橘(Citrus reticulate)种植园、茶园、苗圃等以经济效益为主要目的的林种或以休闲旅游为目的的人工景观;该类转化主要集中在脐橙(Citrus sinensis)生产基地安远县及其周边。除了林地内部的相互转化外,还有少量耕地与林地间的转化,耕地转化为林地(50 km2)多分布在安远县,林地转化为耕地(140 km2)则集中在南康县中部和兴国县东南部;这一则体现出经济增长对林地扩张的促进作用,即经济增长使得非农就业机会激增,农业劳动力的减少造成劣质农田的退耕,退耕的田地很可能恢复为森林[22];二则在一定程度上说明人口的增长势必然导致人类居住点和耕地的扩张[23],城镇化进程中耕地和建设用地对林地的侵蚀不可避免。
相较于当前模式,在规划模式,有林地的转入稍有增加,其它林地的转入有68 km2的减少,疏林地、灌木林转入面积未发生改变,疏林地、有林地、灌木林转出不变,其它林地转出多10 km2。该情景下转入转出的空间分布与当前模式基本相同,最大的不同在于集中在安远、信丰、于都、赣县四县交界处的有林地→其它林地的转变有了大量缩减,其它林地过度扩张的势头有所控制,特别是当前趋势情境下转变区域的南端有较大一部分并未向发生其它林地转变。
在保护模式,相对于当前模式,有林地转入增加56 km2,其它林地转入减少206 km2,疏林地转入缩减为0;疏林地转出略有减少,有林地转出减少283 km2,灌木林转出未发生改变,其它林地转出增多48 km2。在赣南各县区,有林地向其它林地转化大幅降低,其它林地向有林地的转化增多;对有林地、疏林地有效的保护措施使其不至于退化或被开发成果园等经济类用地类型,这部分转化的减少主要分布在信丰与安远交界附近、安远与于都交界处以及安远与赣县交界处。
本文主要结论如下:① 人类活动和社会经济等因素是林地变化的关键驱动力,区位和自然环境因素次之;② 在当前模式和规划模式下,林地总面积都将出现减少,而保护模式下的林地总面积则出现增加,但不管是何种情景,森林的结构都将发生较大的变化;③ 3种情景下都是有林地和其它林地增加、疏林地和灌木林缩减,只是增减幅度不同,特别是在保护模式,有林地增长显著,森林保护政策成效显著;④ 相较于当前模式,在规划模式下集中在安远、信丰、于都、赣县4县交界处的有林地→其它林地的转变大量缩减,在保护模式下这种缩减更加明显。总体来看,当前模式和规划模式相差不大,而保护模式则可以有效抑制有林地的退化和林地向耕地的转变;加强森林和林地资源保护将促进在远离人类活动的地区郁闭度较高的天然林和人工林出现恢复性增长;随着城镇化的推进和赣南经济建设的加快,社会经济因素对赣南森林的影响力不断变大,以林果业为带动的农业结构调整将使得园地、苗圃等以经济效益为主要目的的林种迅速扩张。
结合空间地理数据从时间角度对森林覆盖进行分析有助于对其变化特征和变化趋势有一个整体的把握,但CA-Markov模型结合Logistic回归对未来变化进行预测时,在同种地类聚集区会出现一定程度的填充,对驱动因子选择不全面也可能会造成对未来变化趋势的把握不准确从而造成偏差。另外,如何克服政策因素的量化问题及空间差异性描述、准确把握未来变化演变格局并融入到预测方法和模型中,可作为今后的研究方向。
The authors have declared that no competing interests exist.
| [1] |
Global consequences of land use [J].https://doi.org/10.1126/science.1111772 URL [本文引用: 1] |
| [2] |
Issues in spatially explicit statistical Land-Use/Cover Change (LUCC) models: Examples from western Honduras and the central highlands of Vietnam [J].https://doi.org/10.1016/j.landusepol.2005.09.007 URL [本文引用: 1] 摘要
Land-use/cover change (LUCC) results from the complex interaction of social, ecological and geophysical processes. Land users make decisions about their environment that are governed and influenced by political and institutional constraints at local, regional, national and international levels. Statistical analysis of LUCC phenomena is one powerful tool due to its ability to test theoretical assumptions, rank relative factors, and yield rigorous hypotheses test. However, due to the complex nature of coupled human nvironment systems, LUCC statistical modeling presents conceptual as well as technical challenges. Careful consideration of these challenges, as well as implementing approaches to deal with them, is necessary in order for such models to inform policy and practice. As examples, we present illustrations of two statistical models of land use in the mountains of western Honduras and the Central Highlands of Vietnam.
|
| [3] |
Analysis driving forces of LUCC in Heihe middle reaches [J].https://doi.org/10.1016/S1872-2040(06)60047-9 URL [本文引用: 1] 摘要
Based on the24 years' data between 1981 and 2005,this text analyzes the socio-economic and natural driving forces of LUCC in oasis region.In the text,the analyses about correlation,main component and regress are made to all kinds of indexes,and synthetical analyses and contrast are made to the 11 indexes of the socio-economic and natural driving forces,and the main driving factors of LUCC of the oasis region are confirmed,and the driving mechanisms of LUCC of the oasis in the arid region are illustrated.The result indicates that: the contributive rate of the first and second and third main components of LUCC driving forces in this region are50.501% and 17.819%and 17.480% respectively.That reflects the synthesis and complexity of the driving forcing factors of LUCC in the oasis region.The socio-economic driving forces place a dominant role in the LUCC of the oasis region and the function of the natural driving forces is relatively small.
|
| [4] |
基于Markov和CLUE-S模型的浦东新区湿地演变遥感分析与预测 [J].Zhou Yunxuan et al. Wetland change analysis and forecasting in Pudong new area using Markov and CLUE-S model . |
| [5] |
Wu J et al. Cellular automata-based spatial multi-criteria land suitability simulation for irrigated agriculture [J].https://doi.org/10.1080/13658811003785571 URL [本文引用: 1] 摘要
Cellular automata (CA) models are increasingly used to simulate various dynamic courses, e.g. urban spatial growth, forest fire spread and soil desertification. CA can express space structures and patterns of complex systems, which are difficult to perform only with mathematical equations. In this study, a new CA-based spatial multi-criteria evaluation (MCE) methodology was developed to conduct land suitability simulation (LSS). The approach incorporated MATLAB to build the analytical hierarchy procedure (AHP) for criteria weighting. The method is implemented as a tool, called AHP–CA–GIS, using C# .NET computer language in ArcGIS environment. It has adjustable parameter values which allow users to rectify model inputs for deriving different scenarios. It is spatial-based, flexible, low-cost and robust, as well as suitable for long-term evaluation. It has increased the scope of GIS application in MCE and makes the application practical for decision-making. The AHP–CA–GIS model has been applied to simulate an evaluation of irrigated cropland suitability in the Macintyre Brook catchment of southern Queensland, Australia. Five suitability scenarios were generated. The resultant land suitability map was compared with present land use. The analysis has clearly revealed the potential for irrigation expansion in the catchment. It has also represented the possible suitability of spatial distribution in the long run. This, in turn, can help the decision-makers optimise land allocation and make better land-use planning decisions.
|
| [6] |
Calibration of stochastic cellular automata: the application to rural-urban land conversions [J].https://doi.org/10.1080/13658810210157769 URL [本文引用: 1] 摘要
Despite the recognition of cellular automata (CA) as a flexible and powerful tool for urban growth simulation, the calibration of CA had been largely heuristic until recent efforts to incorporate multi-criteria evaluation and artificial neural network into rule definition. This study developed a stochastic CA model, which derives its initial probability of simulation from observed sequential land use data. Furthermore, this initial probability is updated dynamically through local rules based on the strength of neighbourhood development. Consequentially the integration of global (static) and local (dynamic) factors produces more realistic simulation results. The procedure of calibrated CA can be applied in other contexts with minimum modification. In this study we applied the procedure to simulate rural-urban land conversions in the city of Guangzhou, China. Moreover, the study suggests the need to examine the result of CA through spatial, tabular and structural validation.
|
| [7] |
Simulation of land development through the integration of cellular automata and multicriteria evaluation [J].https://doi.org/10.1068/b250103 URL [本文引用: 1] |
| [8] |
A self-modifying cellular automaton model of historical urbanization in the San Francisco bay area [J].https://doi.org/10.1068/b240247 URL [本文引用: 1] 摘要
In this paper we describe a cellular automaton (CA) simulation model developed to predict urban growth as part of a project for estimating the regional and broader impact of urbanization on the San Francisco Bay area's climate. The rules of the model are more complex than those of a typical CA and involve the use of multiple data sources, including topography, road networks, and existing settlement distributions, and their modification over time. In addition, the control parameters of the model are allowed to self-modify: that is, the CA adapts itself to the circumstances it generates, in particular, during periods of rapid growth or stagnation. In addition, the model was written to allow the accumulation of probabilistic estimates based on Monte Carlo methods. Calibration of the model has been accomplished by the use of historical maps to compare model predictions of urbanization, based solely upon the distribution in year 1900, with observed data for years 1940, 1954, 1962, 1974, and 1990. The complexity of this model has made calibration a particularly demanding step. Lessons learned about the methods, measures, and strategies developed to calibrate the model may be of use in other environmental modeling contexts. With the calibration complete, the model is being used to generate a set of future scenarios for the San Francisco Bay area along with their probabilities based on the Monte Carlo version of the model. Animated dynamic mapping of the simulations will be used to allow visualization of the impact of future urban growth.
|
| [9] |
Using neural networks to predict spatial structure in ecological systems [J].https://doi.org/10.1016/j.ecolmodel.2004.05.008 URL [本文引用: 2] 摘要
We describe an approach in which a neural network (NN) can be trained on sets of driving variables (inputs) and output variables relating to spatial structure. The trained NN provides a predictive tool for defining spatial structure in a specified ecological system. We demonstrate the approach using a modified version of the Crawley and May [J. Theor. Biol. 125 (1987) 475] model that describes simplified annual/perennial plant interactions in a disturbed system. The model is implemented within a cellular automaton with randomised start conditions and is run for periods of up to 50 time steps (50 years). Neural networks are trained using a large set of modelled situations, and the ability of the network to predict plant spatial distributions is then measured. Different image analysis methods are applied to the plant array, and the ability of each method to provide an accurate description of the end-state of the modelled system is investigated. Reconstruction of the plant array from these image analysis measurements is carried out using a stochastic error minimisation method. The partial derivatives method is applied to the trained neural network in order to determine which variables input to the model most strongly influence the eventual plant population distribution. In the example presented, it is found that a relatively simple boundary:area ratio measurement provides a rapid and effective method of describing the spatial structure of the plant community, while the variables that are most influential on the system end-state are those describing annual fecundity and perennial mortality rates.
|
| [10] |
SimLand: A prototype to simulate land conversion through the integrated GIS and CA with AHP-derived transition rules [J].https://doi.org/10.1080/136588198242012 URL [本文引用: 1] 摘要
This paper presents a prototype of a simulation model based on cellular automata (CA), and multicriteria evaluation (MCE) and integrated with GIS. Specifically, a method, analytical hierarchy process (AHP), of MCE is used here to derive behaviour-oriented rules of transition in CA. A 090004tight'' integration strategy is adopted, which means that the modules of MCE and CA are written in the C programming language and built within ARC/INFO GIS. Designed to run on a workstation Unix SimL and fully utilizes the graphical user interface (GUI),which allows the modelto be driven by menusand automate the simulation of land conversion in the urban-rural fringe. The combination of three elements, GIS, CA, and MCE, has several advantages: visualization of decision-making, easier access to spatial information, and the more realistic definition of transition rules in CA.
|
| [11] |
DINAMICA - a stochastic cellular automata model designed to simulate the landscape dynamics in an Amazonian colonization frontier [J].https://doi.org/10.1016/S0304-3800(02)00059-5 URL [本文引用: 1] 摘要
dinamica, a spatially explicit simulation model of landscape dynamics has been developed. dinamica is a cellular automata model that presents multi-scale vicinity-based transitional functions, incorporation of spatial feedback approach to a stochastic multi-step simulation engine, and the application of logistic regression to calculate the spatial dynamic transition probabilities. This model was initially conceived for the simulation of Amazonian landscape dynamics, particularly the landscapes evolved in areas occupied by small farms. For testing its performance, the model was used to simulate spatial patterns of land-use and land-cover changes produced by the Amazonian colonists in clearing the forest, cultivating the land, and eventually abandoning it for vegetation succession. The study area is located in an Amazonian colonization frontier in the north of Mato Grosso state, Brazil. The model was run for two sub-areas of colonization projects, using an 8-year time span, from 1986 to 1994. The simulated maps were compared with land-use and land-cover maps, obtained from digital classification of remote sensing images, using the multiple resolution fitting procedure and a set of landscape structure measures, including fractal dimension, contagion index, and the number of patches for each type of land-use and land-cover class. The results from the validation methods for the two areas showed a good performance of the model, indicating that it can be used for replicating the spatial patterns created by landscape dynamics in Amazonian colonization regions occupied by small farms. Possible applications of dinamica include the evaluation of landscape fragmentation produced by different architectures of colonization projects and the prediction of a region's spatial pattern evolution according to various dynamic phases.
|
| [12] |
Fisher discriminant analysis with kernels[C]//Neural Networks for Signal Processing IX . |
| [13] |
Loose-coupling a cellular automaton model and GIS: long-term urban growth prediction for San Francisco and Washington/Baltimore [J].https://doi.org/10.1080/136588198241617 URL PMID: 12294536 [本文引用: 1] 摘要
Prior research developed a cellular automaton model, that was calibrated by using historical digital maps of urban areas and can be used to predict the future extent of an urban area. The model has now been applied to two rapidly growing, but remarkably different urban areas: the San Francisco Bay region in California and the Washington/Baltimore corridor in the Eastern United States. This paper presents the calibration and prediction results for both regions, reviews their data requirements, compares the differences in the initial configurations and control parameters for the model in the two settings, and discusses the role of GIS in the applications. The model has generated some long term predictions that appear useful for urban planning and are consistent with results from other models and observations of growth. Although the GIS was only loosely coupled with the model, the model''s provision of future urban patterns as data layers for GIS description and analysis is an important outcome of this type of calculation.
|
| [14] |
Strategies for landscape ecology: an application using cellular automata models [J].https://doi.org/10.1016/j.progress.2008.05.002 URL [本文引用: 1] 摘要
The countervailing cellular automata (CVCA) is a loose coupled program designed to work in conjunction with SLEUTH (an urban cellular automata simulation model). CVCA operationalises a set of landscape ecological strategies for urban planning. CVCA first assesses a landscape against a set of landscape metrics. It then evaluates the proposed urban cells from SLEUTH against the metrics and allocates future land uses according to a suite of planning strategies (offensive, defensive, protective, opportunistic). This paper describes the development of CVCA, the theory behind the landscape strategies, and the actions taken to bring CVCA into a computable environment. An application of CVCA in two metropolitan areas in Portugal (Porto and Lisbon) is made and discussed. The results of implementing it are then discussed and evaluated. The paper concludes that the implementation of the cellular automata model CVCA, loose coupled with SLEUTH (a cellular automaton urban model), provides a robust and useful application of landscape ecological strategies in metropolitan planning. The applied strategies vary locally as a function of the specifics concerning particular patterns and processes to be promoted. Besides the quantitative analysis they provide, these patterns and processes can also be assessed and compared in terms of the resulting images of urban growth, the location and the shape of corridors, buffers, and the relative importance of the different landscape ecological planning strategies. The paper ends with a comprehensive discussion of the four main subject areas, in the context of cellular automaton and dynamic models: the importance of integrated planning strategies for the territory; the lack of planning tools; the importance of cellular automaton approaches and applications; and the results of applying SLEUTH and CVCA to two metropolitan areas.
|
| [15] |
生态脆弱的经济贫困地区经济林生态经济效率的DEA-Tobit模型研究——以赣南原中央苏区为例 [J].
根据生态脆弱的经济贫困地区特点,从林农视角运用DEA—Tobit模型研究经济林生态经济效率及其影响因素。首先,运用DEA模型对赣南原中央苏区林农经营经济林的生态经济效率进行测算,并分析效率特性。研究表明,赣南原中央苏区经济林资源利用与生态保护的协调程度较低;经济林生态学方面的技术人才缺乏,技术创新能力有待提高;经济林生态规模不够,未实现生态规模经济效应。然后,以测算出的生态经济效率值作为被解释变量的数据,运用Tobit模型找出影响生态经济效率的关键因素,并对其作用机理进行了分析。研究表明,按影响程度从大到小的顺序,经济林生态经济效率的主要影响因素依次为:经济林单产(正向)、林地细碎度(负向)、化肥农药使用量(负向)、政策知晓度(正向)、经营集约度(正向)。而性别、年龄、受教育年限、家庭劳动力、家庭总收入、专业合作度、经济林产品畅销度对生态经济效率没有显著影响。最后,根据以上研究成果,分别从技术、经营、管理、制度等方面提出改进经济林生态经济效率的对策建议。
DEA-Tobit model of economics forests ecology economics efficiency in ecologically fragile and poverty stricken regions: A case study of original central soviet areas of southern Jiangxi .
根据生态脆弱的经济贫困地区特点,从林农视角运用DEA—Tobit模型研究经济林生态经济效率及其影响因素。首先,运用DEA模型对赣南原中央苏区林农经营经济林的生态经济效率进行测算,并分析效率特性。研究表明,赣南原中央苏区经济林资源利用与生态保护的协调程度较低;经济林生态学方面的技术人才缺乏,技术创新能力有待提高;经济林生态规模不够,未实现生态规模经济效应。然后,以测算出的生态经济效率值作为被解释变量的数据,运用Tobit模型找出影响生态经济效率的关键因素,并对其作用机理进行了分析。研究表明,按影响程度从大到小的顺序,经济林生态经济效率的主要影响因素依次为:经济林单产(正向)、林地细碎度(负向)、化肥农药使用量(负向)、政策知晓度(正向)、经营集约度(正向)。而性别、年龄、受教育年限、家庭劳动力、家庭总收入、专业合作度、经济林产品畅销度对生态经济效率没有显著影响。最后,根据以上研究成果,分别从技术、经营、管理、制度等方面提出改进经济林生态经济效率的对策建议。
|
| [16] |
Kainz W et al. Integration of logistic regression, Markov chain and cellular automata models to simulate urban expansion [J].https://doi.org/10.1016/j.jag.2011.12.014 URL [本文引用: 1] 摘要
This research analyses the suburban expansion in the metropolitan area of Tehran, Iran. A hybrid model consisting of logistic regression model, Markov chain (MC), and cellular automata (CA) was designed to improve the performance of the standard logistic regression model. Environmental and socio-economic variables dealing with urban sprawl were operationalised to create a probability surface of spatiotemporal states of built-up land use for the years 2006, 2016, and 2026. For validation, the model was evaluated by means of relative operating characteristic values for different sets of variables. The approach was calibrated for 2006 by cross comparing of actual and simulated land use maps. The achieved outcomes represent a match of 89% between simulated and actual maps of 2006, which was satisfactory to approve the calibration process. Thereafter, the calibrated hybrid approach was implemented for forthcoming years. Finally, future land use maps for 2016 and 2026 were predicted by means of this hybrid approach. The simulated maps illustrate a new wave of suburban development in the vicinity of Tehran at the western border of the metropolis during the next decades.
|
| [17] |
大兴安岭盘古林场森林景观的空间分布格局及其关联性 [J].https://doi.org/10.11707/j.1001-7488.20150704 URL [本文引用: 1] 摘要
【目的】分析大兴安岭地区主要森林景观类型的空间分布格局及其关联性,以期阐明该地区森林景观形成和维持的内在机制,为该地区森林景观的健康经营提供理论依据。【方法】基于塔河林业局盘古林场2008年森林资源二类调查数据,采用Arc Map10.0软件中的核密度分析和Programita软件(2010版)中的O-ring统计方法研究该地区主要森林景观类型(天然落叶松林、天然白桦林、针叶混交林和针阔混交林)的空间分布格局及其关联性。【结果】核密度分析结果表明,该地区各主要森林景观类型在空间上呈明显聚集分布,其平均斑块密度为0.73~1.57 km-2,空间变异系数高达99.75%~119.67%;点格局O-ring分析结果表明,4种景观类型均在小尺度上呈现显著聚集分布,之后随研究尺度的增大逐渐呈随机分布的趋势;各景观类型之间均在小尺度上显著负关联,在中等尺度上呈现出无关联性,而在大尺度上又有显著的正关联性;森林采伐、林火干扰以及道路网等因素是森林景观格局变化的主要驱动因素。【结论】大兴安岭地区由于极端的气候条件以及长期的采伐和林火干扰等因素,森林景观已经呈现出明显的破碎化趋势。为此,对于森林植被的恢复,可在小尺度上采取连片造林方式,而在大尺度上采用随机造林模式;对树种的选择,应优先选择乡土树种,并注重各树种的合理空间配置;而对于森林采伐,则应采取以择伐和间伐为主的方式;同时,严格控制人类自身活动(如采伐方式、道路安排等)对森林景观的影响,进而从景观水平上创建健康、稳定的森林生态系统。
Spatial point patterns and associations of forest landscapes in Pangu forest farm in Daxing’an mountains .https://doi.org/10.11707/j.1001-7488.20150704 URL [本文引用: 1] 摘要
【目的】分析大兴安岭地区主要森林景观类型的空间分布格局及其关联性,以期阐明该地区森林景观形成和维持的内在机制,为该地区森林景观的健康经营提供理论依据。【方法】基于塔河林业局盘古林场2008年森林资源二类调查数据,采用Arc Map10.0软件中的核密度分析和Programita软件(2010版)中的O-ring统计方法研究该地区主要森林景观类型(天然落叶松林、天然白桦林、针叶混交林和针阔混交林)的空间分布格局及其关联性。【结果】核密度分析结果表明,该地区各主要森林景观类型在空间上呈明显聚集分布,其平均斑块密度为0.73~1.57 km-2,空间变异系数高达99.75%~119.67%;点格局O-ring分析结果表明,4种景观类型均在小尺度上呈现显著聚集分布,之后随研究尺度的增大逐渐呈随机分布的趋势;各景观类型之间均在小尺度上显著负关联,在中等尺度上呈现出无关联性,而在大尺度上又有显著的正关联性;森林采伐、林火干扰以及道路网等因素是森林景观格局变化的主要驱动因素。【结论】大兴安岭地区由于极端的气候条件以及长期的采伐和林火干扰等因素,森林景观已经呈现出明显的破碎化趋势。为此,对于森林植被的恢复,可在小尺度上采取连片造林方式,而在大尺度上采用随机造林模式;对树种的选择,应优先选择乡土树种,并注重各树种的合理空间配置;而对于森林采伐,则应采取以择伐和间伐为主的方式;同时,严格控制人类自身活动(如采伐方式、道路安排等)对森林景观的影响,进而从景观水平上创建健康、稳定的森林生态系统。
|
| [18] |
吉林省东部山区近50年森林景观变化及驱动机制研究 [J].https://doi.org/10.3321/j.issn:1000-1522.2006.03.007 URL [本文引用: 1] 摘要
在RS与GIS的支持下,综合集成遥感影像(TM、MSS)与地 形图在专家知识的参与下重建吉林省东部山区1954、1976和2000年土地利用/覆盖变化信息,结合景观生态学理论分析研究区森林景观时空变化特征, 进一步从森林变化的自然因素、空间区位作用因素和社会经济因素3个方面分析森林变化的驱动机制.研究结果表明,吉林省东部山区森林变化总体上呈先减少后增 加的"V"形趋势.由于1976年前的毁林开荒与1976年后"封山育林"的影响,森林景观破碎化程度先增加后减少;研究区以林地-耕地,林地-草地为主 要转换类型,延边朝鲜族自治州是集中变化区域;林地的变化主要发生在坡度较缓、高程较小、土壤条件相对较好的低山或平原区;林地的变化随距离城乡居民地和 道路的距离呈指数衰减.自然保护区与生态功能区建设对森林景观的生态保育功能具有积极的作用.林地变化主要包括3个层次的驱动因素,人口增长与经济发展的 需求以及国家林业政策的失误是林地减少的主要驱动因素;森林生态保育政策的引导是林地增加的最主要的驱动力;自然因素、距离城乡居民用地和道路的距离是林 地变化空间区位选择的重要影响因素.
Zhang Yangzhen et al. Changes of forest landscape and its driving mechanism during the last fifty years in the eastern mountain area of Jilin province .https://doi.org/10.3321/j.issn:1000-1522.2006.03.007 URL [本文引用: 1] 摘要
在RS与GIS的支持下,综合集成遥感影像(TM、MSS)与地 形图在专家知识的参与下重建吉林省东部山区1954、1976和2000年土地利用/覆盖变化信息,结合景观生态学理论分析研究区森林景观时空变化特征, 进一步从森林变化的自然因素、空间区位作用因素和社会经济因素3个方面分析森林变化的驱动机制.研究结果表明,吉林省东部山区森林变化总体上呈先减少后增 加的"V"形趋势.由于1976年前的毁林开荒与1976年后"封山育林"的影响,森林景观破碎化程度先增加后减少;研究区以林地-耕地,林地-草地为主 要转换类型,延边朝鲜族自治州是集中变化区域;林地的变化主要发生在坡度较缓、高程较小、土壤条件相对较好的低山或平原区;林地的变化随距离城乡居民地和 道路的距离呈指数衰减.自然保护区与生态功能区建设对森林景观的生态保育功能具有积极的作用.林地变化主要包括3个层次的驱动因素,人口增长与经济发展的 需求以及国家林业政策的失误是林地减少的主要驱动因素;森林生态保育政策的引导是林地增加的最主要的驱动力;自然因素、距离城乡居民用地和道路的距离是林 地变化空间区位选择的重要影响因素.
|
| [19] |
赣州市国土资源局.赣州市土地利用总规划(2006-2020) [EB/OL]..The overall land use plan of Ganzhou in |
| [20] |
Land-cover change model validation by an ROC method for the Ipswich watershed, Massachusetts, USA [J].https://doi.org/10.1016/S0167-8809(01)00187-6 URL [本文引用: 1] 摘要
Scientists need a better and larger set of tools to validate land-use change models, because it is essential to know a model prediction accuracy. This paper describes how to use the relative operating characteristic (ROC) as a quantitative measurement to validate a land-cover change model. Typically, a crucial component of a spatially explicit simulation model of land-cover change is a map of suitability for land-cover change, for example a map of probability of deforestation. The model usually selects locations for new land-cover change at locations that have relatively high suitability. The ROC can compare a map of actual change to maps of modeled suitability for land-cover change. ROC is a summary statistic derived from several two-by-two contingency tables, where each contingency table corresponds to a different simulated scenario of future land-cover change. The categories in each contingency table are actual change and actual non-change versus simulated change and simulated non-change. This paper applies the theoretical concepts to a model of deforestation in the Ipswich watershed, USA.
|
| [21] |
Moran E et al. Forest transitions: towards a global understanding of land use change [J].https://doi.org/10.1016/j.gloenvcha.2004.11.001 URL [本文引用: 1] 摘要
Places experience forest transitions when declines in forest cover cease and recoveries in forest cover begin. Forest transitions have occurred in two, sometimes overlapping circumstances. In some places economic development has created enough non-farm jobs to pull farmers off of the land, thereby inducing the spontaneous regeneration of forests in old fields. In other places a scarcity of forest products has prompted governments and landowners to plant trees in some fields. The transitions do little to conserve biodiversity, but they do sequester carbon and conserve soil, so governments should place a high priority on promoting them.
|
| [22] |
森林转型、农地边际化与生态恢复 [J].https://doi.org/10.3969/j.issn.1002-2104.2011.10.014 URL [本文引用: 1] 摘要
中国20世纪80年代迎来了国 家土地利用形态的转型,即代表自然生态空间的森林面积降至低谷后反转向上,代表人类干扰较强的耕地面积从扩张到收缩。这是生态状况从整体恶化向整体改善转 变的最直接原因。森林转型对应着国家经济社会发展的阶段性演进过程,存在着必然性。其直接原因,是农林交错带的农业在与森林竞争土地资源的过程中失去优 势。伴随工业化和城市化的劳动力价格上升,生活水平提高带来的林木产品需求增加,是森林竞争力提高和农业竞争力下降的经济驱动力;而转型前农业扩张引起的 生态退化,则是其政策驱动力。在中国森林转型初期,政策起到了关键的促进作用。随着城市化的加速发展,人口年龄结构向老年型转变,中国迎来了劳动力工资持 续上涨的阶段。以坡耕地为代表的劳动力密集型农地利用方式,由于难以实现机械化,劳动生产率与平原区农业的差距将越来越大,被"边际化"的可能性越来越 高。这给森林面积或自然生态空间的进一步扩张提供了机会。
Forest transition, agricultural land marginalization and ecological restoration .https://doi.org/10.3969/j.issn.1002-2104.2011.10.014 URL [本文引用: 1] 摘要
中国20世纪80年代迎来了国 家土地利用形态的转型,即代表自然生态空间的森林面积降至低谷后反转向上,代表人类干扰较强的耕地面积从扩张到收缩。这是生态状况从整体恶化向整体改善转 变的最直接原因。森林转型对应着国家经济社会发展的阶段性演进过程,存在着必然性。其直接原因,是农林交错带的农业在与森林竞争土地资源的过程中失去优 势。伴随工业化和城市化的劳动力价格上升,生活水平提高带来的林木产品需求增加,是森林竞争力提高和农业竞争力下降的经济驱动力;而转型前农业扩张引起的 生态退化,则是其政策驱动力。在中国森林转型初期,政策起到了关键的促进作用。随着城市化的加速发展,人口年龄结构向老年型转变,中国迎来了劳动力工资持 续上涨的阶段。以坡耕地为代表的劳动力密集型农地利用方式,由于难以实现机械化,劳动生产率与平原区农业的差距将越来越大,被"边际化"的可能性越来越 高。这给森林面积或自然生态空间的进一步扩张提供了机会。
|
| [23] |
A reconstruction of global agricultural areas and land cover for the last millennium [J]. |

/
| 〈 |
|
〉 |