刘贤赵 , 高长春
, 高长春
Liu Xianzhao, Gao Changchun
中图分类号: F119
文献标识码: A
文章编号: 1000-0690(2018)05-0681-10
收稿日期: 2017-08-20
修回日期: 2017-12-24
网络出版日期: 2018-05-10
版权声明: 2018 《地理科学》编辑部 本文是开放获取期刊文献,在以下情况下可以自由使用:学术研究、学术交流、科研教学等,但不允许用于商业目的.
基金资助:
作者简介:
作者简介:刘贤赵(1970-),男,湖南隆回人,教授,博士,主要从事资源环境变化研究。E-mail: xianzhaoliu@sina.com
展开
摘要
在估算各省域碳强度的基础上,利用探索性空间数据分析(ESDA)和时空跃迁测度方法以及地理加权回归(GWR)模型分析了1995~2015年中国省域(不包括西藏、港、澳、台地区)能源消费碳强度的空间依赖格局及其驱动因素的空间异质性。结果显示:① 中国省域碳强度存在显著的空间正相关性,表现为先下降后上升再到小幅波动的特征,碳强度相似的省域趋向于集聚,表明中国省域碳强度具有明显的空间依赖特征;②省域碳强度存在不均衡的发展格局,高-高集聚的省域主要分布在中国西北部,低-低集聚的省域多分布于中国东南部。③碳强度空间集聚总体呈优化态势,高-高集聚的省域在减少,低-低集聚的省域在不断增多,但不同省域在碳强度的空间集聚中所起的作用不同。④ 碳强度影响因素(解释变量)的回归系数均为正值,4个解释变量对碳强度的影响程度依次为:能源强度>能源结构>产业结构>人均GDP;且各因素对碳强度的影响在不同省域具有明显的空间异质性。
关键词:
Abstract
The carbon emissions intensities of China’s thirty provinces caused by energy consumption were calculated according to the reference approach provided by IPCC. Exploratory spatial data analysis (ESDA), space-time transition measurement method and geographically weighted regression (GWR) model were employed to analyze the spatial dependence of provincial carbon emissions intensity and spatial heterogeneity of its driving factors from 1995 to 2015. The results were shown as follows: 1) There was a significant positive spatial correlation in carbon emissions intensity among provinces. Global spatial autocorrelation decreased first and then increased and last fluctuated slightly. The provinces with similar carbon intensity tended to be agglomerate, indicating that provincial carbon intensity had an obvious spatial dependence characteristics. 2) An uneven development pattern of carbon emission intensity existed in China's provinces. The provinces with H-H agglomeration were mainly distributed in the northwest of China, while the ones with L-L agglomeration mainly distributed in the southeast of China. 3) The spatial agglomeration of carbon intensity presented an overall trend of optimization, the provinces with H-H agglomeration decreased, while ones with L-L agglomeration increased. However, different provinces played different roles in the spatial agglomeration of carbon intensity. 4) The driving factors of carbon emissions intensity had obvious spatial heterogeneity among China’s provinces, and there was a positive correlation between the 4 explanatory variables and carbon intensity. The influence degree of 4 explanatory variables on carbon intensity was as follows: energy intensity>energy structure>industrial structure>per capita GDP. Different policies of carbon intensity reduction should be formulated according to the actual situation of each province. Therefore, in order to achieve regional differences in carbon emission reduction, it is necessary to take full account of the actual situation of carbon intensity in each province and the spatial differences of carbon intensity affected by different factors.
Keywords:
气候变暖是国际社会公认的全球性环境问题,而化石能源消耗导致的碳排放是温室效应加剧、全球变暖的一个最主要因素[1,2]。如何削减碳排放和发展低碳经济以及促进两者协调发展,不仅是各国政府和学术界关注的焦点,而且也是亟待解决的环境问题。据国际能源署的数据显示,中国自2007年以来碳排放量已超过美国,成为世界上最大的碳排放国,且随着经济和城市化的快速发展,未来一段时间内能源消费和碳排放还会持续增长,这无疑将使中国面临巨大的减排压力。作为负责任的大国,中国政府承诺到2020年碳排放强度(简称碳强度,下同)在2005年的基础上下降40%~45%,并将其作为约束性指标纳入国民经济和社会发展的中长期规划。然而,此目标的实现不仅需要国家层面的产业转型升级和能源结构的优化,更依赖于省域层面具体的节能减排行动。由于中国地域辽阔,省域之间资源禀赋、经济发展、产业结构及能源消费结构既存在显著差异性,又存在空间关联性。因此,在全国目标减排框架下,需要查清中国省域间能源消费碳强度的空间依赖性、差质性及其影响因素的空间异质性,以便有针对性地制定产业和能源政策。
目前,关于碳强度及其影响因素的研究不少学者做了大量的工作。从研究尺度看,主要集中在全国、省区和城市,研究内容重点是碳强度的测算、区域差异和来源以及影响因素等[3,4,5,6,7,8]。如张翠菊和张宗益[3]分析了中国省域碳强度的集聚效应和辐射效应;杨骞和刘华军[4]按照东、中、西和东北四大区域对中国碳强度的地区差异进行了测度和结构分解,认为碳强度存在的区域差异主要是来自区域内部,但也有部分学者认为中国碳强度总体差异主要是来源于区域间[7]。此外,朱聆和张真[8]对上海市碳强度的影响因素进行了分析,得出产业部门能源强度、能源结构是影响碳强度变化的主要因素。从研究碳强度的方法看,多数学者均是采用传统的环境库茨涅茨曲线、泰尔指数、结构分解方法(SDA)、差值因素分解方法和指数分解法(IDA)等全局分解模型探讨碳强度变化的驱动因素[7,8,9,10,11,12,13,14,15]。如Ebohon等[10]采用拉氏指数模型对非洲一些国家的碳强度进行了分解,发现能源消耗强度、能源种类和产业结构是驱动碳强度变化的主要因素;Tan等利用对数平均迪氏分解(LMDI)模型研究了电力行业对中国碳排放强度下降的贡献[12];潘雄锋等[15]利用差值因素分解方法探讨了中国制造业碳强度变化的原因,认为结构因素对碳强度下降具有抑制作用。
虽然上述学者对碳强度的研究取得了丰硕成果,但大多忽略了研究单元之间碳强度的空间依赖性和影响因素的空间异质性,这显然与事实不符。尽管也有部分学者[3,16,17]对中国区域碳强度的空间依赖性及其影响因素进行了研究,如利用Moran’s I指数从集聚效应和辐射效应的角度研究了中国区域碳强度的空间相关性,但仅限于简单的统计分析,缺乏利用近年新发展起来的GIS技术和时空跃迁测度方法对中国区域碳强度时空依赖格局及其转移特征进行深入研究。此外,用于研究碳强度影响因素的全局模型也忽略了研究单元间的空间效应,无法合理解释中国区域碳强度影响因素的空间异质性,从而有可能使研究结果出现偏差或模型缺乏解释力。本文运用ArcGIS10.2软件中的探索性空间数据分析(ESDA)和时空跃迁测度方法探讨省域碳强度的空间依赖格局及其转移特征,然后利用能刻画不同位置空间差异的地理加权回归(GWR)模型[18]对碳强度影响因素在不同省域上的空间异质性进行分析,为制定共同但有差别的碳减排政策提供依据。
化石能源消耗是碳排放产生的主要来源。因缺少省级层面的碳排放数据,所以本文基于8种主要化石能源,结合标准煤折算系数和IPCC提供的碳排放系数估算中国大陆除西藏以外的30个省区的碳排放量(因西藏、台湾、香港和澳门数据不全或统计口径不统一,故未列入分析)。计算碳排放量所用的8种能源终端消费数据来源于1996~2016《中国能源统计年鉴》[19],总人口、GDP、产业结构、能源结构等影响碳强度的数据来自1996~2016《中国统计年鉴》[20]。为消除价格波动造成的影响,GDP采用2000年不变价国内生产总值进行计算。省域化石能源消费碳排放量的计算公式为[21]:
式中,C代表测算的碳排放量;
表1 估算碳排放量所需标准煤的折算系数和碳排放系数
Table 1 Coefficients of standard coal and carbon emission used in calculating carbon emissions
| 能源 种类 | SCC(kg标 准煤·kg-1) | CEC(kg·kg-1 标准煤) | 能源 种类 | SCC(kg标 准煤·kg-1) | CEC(kg·kg-1 标准煤) |
|---|---|---|---|---|---|
| 原煤 | 0.7143 | 0.7559 | 煤油 | 1.4714 | 0.5714 |
| 焦炭 | 0.9714 | 0.9714 | 柴油 | 1.4571 | 0.5921 |
| 原油 | 1.4286 | 0.5857 | 燃料油 | 1.4286 | 0.6185 |
| 汽油 | 1.4714 | 0.5538 | 天然气 | 1.3300* | 0.4483 |
ESDA以空间关联测度为核心,通过对事物或现象空间分布格局的描述与可视化,揭示研究对象之间的空间依赖关系[23]。该方法包括全局Moran’s I指数和局部Moran’s I指数。
全局Moran’s I指数用来反映省域碳强度空间依赖或空间差异的总体特征,即碳强度水平相当的省域是否在地理空间上倾向于集聚,其计算公式如下:
式中,
全局Moran’s I指数虽能从整体上揭示省域碳强度的空间依赖程度,但无法衡量观测省域与相邻省域的依赖或差异程度;而Anselin提出的局部Moran’s I 指数可以结合局部空间自相关集聚图(LISA)分析全局空间的内部结构和局部空间的依赖性。局部Moran’s I指数的计算公式为[25]:
在给定的显著水平下,局部Moran’s I> 0,表示观测省域碳强度与邻近省域碳强度相似,即高-高或低-低;局部Moran’s I< 0,则表示观测省域与邻近省域碳强度相异(低-高或高-低)。
影响中国省域碳强度的因素(如人口规模、GDP、能源消费结构、产业结构、能源强度、城市化率以及对外开放程度等)既存在非稳定性和异质性,也存在空间相关性。如果仍采用传统回归模型对其参数进行估计,则很难反映省域间的空间异质性。而GWR模型能充分考虑影响因素的空间位置,将数据的空间特性纳入模型中并进行局部回归参数估计,从而更加准确地揭示碳强度与影响因素之间的空间关系。GWR模型为:
式中,
考虑到影响碳强度的因素可能存在(多重)共线性,事先对所有变量进行共线性检验,将VIF(方差膨胀因子)大于10的变量剔除,得到构建GWR模型的4个解释变量:经济发展水平(PGDP,用人均GDP表示)、能源强度(EI,用单位GDP的能耗表示)、能源消费结构(ES,用煤炭消费量占全部能源消费量的比重表示)和产业结构(IS,用第三产业产值占该省域总产值比重表示)。为减少截面数据部分指标异常波动以及量纲带来的影响,模型中碳强度以及上述4个解释变量数据均为1995~2015年的平均值,并用自然对数表示。
在求解模型中的回归参数时,先以省域
式中,每一行表示同一影响因素的回归系数在不同省域的估计值,该系数的波动可以揭示出其空间的非平衡性。
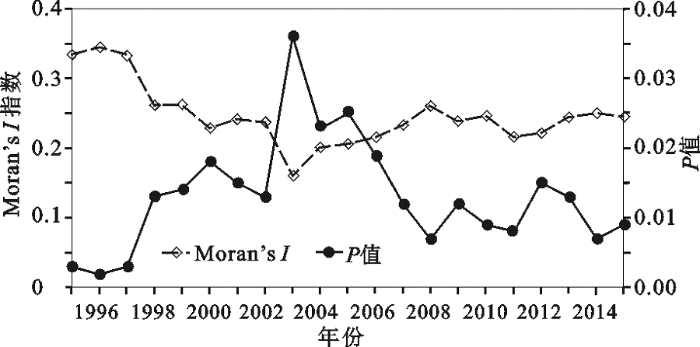
图1为中国30个省域1995~2015年碳强度的全局Moran’s I指数及其蒙特卡罗检验的显著性。图1显示,21 a间全局Moran’s I指数均为正值且全部通过了P<0.05水平的显著性检验,表明中国省域碳强度在空间分布上并非完全随机,而是具有显著的空间依赖特征。从变化进程看,1995年以来,中国30个省域碳强度的空间正相关大致经历了先下降后上升再到小幅波动的3个阶段。即在1995~2003年,全局Moran’s I指数呈波动下降趋势,表明中国省域碳强度的空间集聚效应整体在减弱,这意味着在全国的碳减排过程中各个省域的碳强度总体空间差异在不断缩小;而在2003~2008年,省域碳强度空间集聚特性在急剧增强,全局Moran’s I指数由2003年的0.161上升到2008年的0.260;在2008~2015年,全局Moran’s I指数总体呈小幅波动,从2008年的0.260下降至2011年的0.217,随后又波动上升至2015年的0.245,说明此期间中国省域碳强度的空间集聚水平变化不大。上述全局Moran’s I指数的变化表明,中国省域碳强度空间依赖变化主要发生在5个时间节点,即1995、2003、2008、2011和2015年,因此后文主要围绕这5个时间节点做进一步的分析。
图1 1995~2015年中国省域碳强度全局Moran’s I指数
Fig.1 Global Moran’s I of carbon emission intensity of China’s provinces from1995 to 2015
2.2.1 基于Moran散点图的局部空间依赖格局
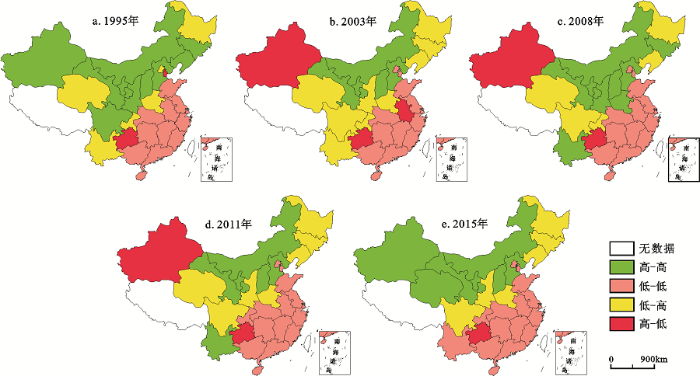
全局Moran’s I指数仅能说明中国省域碳强度在整体上的空间依赖特性,无法表征中国省域碳强度空间依赖的具体结构以及各省域碳强度在空间位置上的相互关联关系。作者根据全局Moran’s I指数得到的5个时间节点,利用ArcGIS10.2软件将上述5个年份的中国省域碳强度绘制成Moran散点空间分布图(图2),并根据各省域与其相邻省域的碳强度空间依赖关系,将中国省域碳强度划分成4种空间集聚类型。① 高-高(HH)型:省域自身与相邻省域碳强度均为高值区且二者呈正相关;②低-低(LL)型:省域自身与相邻省域碳强度均较低,二者呈显著正关联;③低-高(LH)型:碳强度低的省域被四周较高的省域所包围,二者呈负相关特征;④ 高-低(HL)型:省域自身碳强度较高而相邻省域碳强度较低,二者呈中心高而四周低的负关联特征。分析图2可知,1995、2003、2008、2011和2015年各年份中属于高-高和低-低型的省份为60.0%~76.7%,属于低-高和高-低型的省份仅占23.3%~40.0%,说明中国省域碳强度存在不均衡的发展格局,多数碳强度高(低)的省域与其它碳强度高(低)的省域相邻,表明中国省域碳强度在局部范围内具有较高的空间依赖关系。具体从空间分布来看,碳强度高-高型的省份主要集中在中国北部,其中,内蒙古、山西、甘肃、宁夏和河北始终处于碳强度高-高集聚的区域,原因是这些省份(甘肃除外)是重要的能源基地,化石能源资源丰富,其快速的工业化、城市化以及经济持续增长都严重依赖于化石能源特别是煤炭资源的消耗,加上这些省份大多属于重工业基地,工业碳排放量偏高,而能源利用效率较低,从而导致碳强度较高;碳强度低-低型的省域主要集中在湖北、湖南、江西、安徽以及东部和南部沿海,原因是这些省份能源资源都不是十分丰富,但大多经济发展水平较高、工业技术先进,因此碳强度较低。在1995~2015年,除碳强度一直处于“低-低”集聚区域的湖南、湖北、江西、山东、江苏、浙江、福建、广东、广西和海南外,2003年减少了安徽,但增加了北京和天津,2008年又增加了安徽,2011和2015年分别增加了重庆和云南,表明低-低型集聚的省域在不断增多,碳减排效果在不断扩大。对于碳强度属于高-低型的省域,贵州是全国唯一始终处于该类型的省份,原因是贵州经济发展水平较周边省份较低,技术落后,因而其碳强度相对较高;到2003年该类型减少了天津,增加了新疆和安徽,但安徽很快就转为低-低型区域。碳强度低-高型省域相对稳定的主要是青海、黑龙江、河南、辽宁和四川,北京仅在1995年处在低-高型区域,而云南仅在1995和2003年属于该区域。从1995~2015年碳强度的整体格局变化看,碳强度较高的省域多集中在中国西北部,碳强度较低的省域则多集中在中国东南部,并且省域碳强度空间集聚有不断优化的趋势,即高-高集聚的省域在逐渐减少,而低-低集聚的省域则在不断增加。
图2 中国省域碳强度Moran’s I 散点空间分布
Fig.2 Spatial patterns of Moran’s I scatter plots of carbon emission intensity of China’s provinces
Moran散点空间分布图虽能直观显示各省域的局部空间关联类型,但无法反映局部空间关联类型随时间变化的相互转移情况。这里采用Rey[26]提出的时空跃迁测度法进一步探讨中国省域碳强度局部空间关联类型的时空转移特征。时空跃迁包括4种类型。类型I表示省域及其相邻省域均保持稳定;类型Ⅱ表示省域的相对跃迁;类型Ⅲ表示空间相邻省域的跃迁;类型IV表示省域与其相邻省域均发生跃迁。分析图2可知,在1995~2015年中,Moran散点最普遍的跃迁类型是省域及其相邻省域均保持稳定的类型Ⅰ,表明中国省域碳强度的空间依赖特征和空间异质性存在高度的稳定性,即中国省域碳强度的空间格局具有一定的空间锁定或路径依赖性。
2.2.2 基于LISA图的局部空间依赖格局
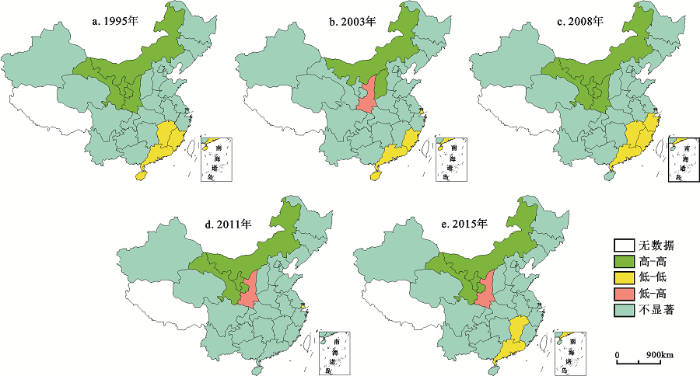
由于Moran散点图不能判断各种空间关联类型是否在统计意义上显著,因此有必要采用LISA做进一步的分析。作者利用ArcGIS10.2软件得到了1995、2003、2008、2011和2015年中国省域碳强度的LISA集聚图,并且各类集聚型省份均通过了0.05水平的显著性检验。由图3可知,在1995~2015年中的5个时间节点上,中国省域碳强度表现出非均衡发展格局,在5%的显著性水平下,东南部沿海地区多处于低-低集聚型,而北部地区则多处于高-高集聚型。在高-高集聚型区域,内蒙古一直是属于高-高集聚且辐射作用明显的省域,而且其它碳强度较高的省域如甘肃、宁夏和陕西等均与之相邻,这与内蒙古能源禀赋在区域碳强度演变中产生了重要作用有关;但到2011年,陕西省脱离高-高集聚型区域,表明内蒙古、甘肃和宁夏对推高周边地区碳强度的带动作用有所减弱。低-低集聚型区域主要分布在中国的东南沿海,该区域的省份呈减少趋势,1995年、2003年和2008年均为4个,2011年和2015年分别为1个和2个,表明空间集聚对中国省域碳强度降低的推动作用在不断减弱。尽管如此,但广东、福建、浙江对周边的带动作用仍然较强,原因是这3个省份位于中国东南部沿海地带,经济发展水平较高、工业技术先进,从而辐射作用明显。碳强度低-高集聚区在1995和2008年没有省份,2003、2011和2015年仅有陕西一个省份,而在1995~2015年已经不存在属于高-低集聚的省域,这表明中国省域碳强度的空间差距正在逐步缩小。
图3 中国省域碳强度的LISA集聚
Fig. 3 The LISA cluster map of carbon emission intensity of China’s provinces
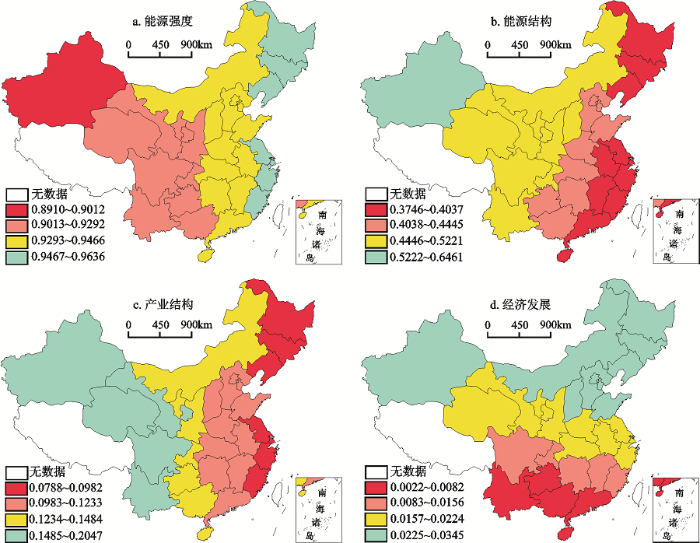
上述ESDA的分析表明,中国省域碳强度在空间分布上呈现出显著的空间依赖特征。因此,要深入分析碳强度影响因素在不同省域的空间差异,需要借助GWR模型来进行测度。从碳强度的自然对数作为被解释变量的GWR回归结果看(图4),选取的4个解释变量的估计系数均为正值,且系数的符号与预期一致。4个解释变量对碳强度的影响结果依次是能源强度>能源消费结构>产业结构>经济发展水平,表明1995~2015年的21 a间中国省域碳强度主要受能源强度或能源消费结构等技术因素的影响,中国省域碳强度的降低主要依赖于能源强度的下降,而产业结构和经济发展等社会生产因素对碳强度的影响并不明显。考虑到省域碳强度不同影响因素的作用在不同区域具有较大的空间差异和明显的区域特征,以及同一因素在相同区域内部不同省份的作用不同,下面将基于GWR模型的估计结果对碳强度的4个影响因素的空间差异逐一进行分析。
图4 1995~2015中国省域碳排放强度的GWR模型回归系数的空间分布
Fig.4 Spatial distribution of GWR model coefficients of carbon emission intensity in China’s provinces from 1995 to 2015
2.3.1 能源强度对碳强度影响的空间差异
能源强度对中国省域碳强度的影响存在明显的空间差异,且二者之间均呈正相关关系(图4a),说明技术进步的加快,有利于碳强度的降低。从回归系数的空间分布看,由东向西方向呈逐渐递减的趋势。影响系数较大的省域(影响系数>0.94)有黑龙江、吉林、辽宁、北京、天津、河北、山东、安徽、湖北、上海、江苏、浙江和福建等,最大值出现在黑龙江,最小值出现在新疆。这说明在技术水平较高和经济条件较好的东部地区,能源强度对省域碳强度分布的影响相对较大;而在技术水平较低和经济条件相对较差的西部地区,能源强度对碳强度的影响相对较小。因此,要想实现基于碳强度目标减排,需要根据不同区域各省份的低碳技术水平现状,通过大力引进节能减排技术、绿色清洁能源技术以及加大科技投入,来提高能源效率,从而达到控制碳排放规模和降低碳强度的双重目标。
2.3.2 能源消费结构对碳强度影响的空间差异
能源消费结构是影响中国省域碳强度的技术因素。图4b显示,能源消费结构对不同省域碳强度的影响存在显著的空间差异,回归系数由东向西方向呈逐渐增大的趋势,这表明在能源利用相对合理的东部地区,能源消费结构对碳强度分布的影响相对较小,而在能源消费结构相对不合理的中西部地区,影响却相对较大;这也意味着在西部地区能源消费结构的进一步优化对碳强度的减少具有重要的促进作用。比较不同省域能源消费结构对碳强度的影响显示,影响系数较大的省份(影响系数>0.45)主要是新疆、青海、甘肃、宁夏、陕西、山西和内蒙古等7个省域,影响系数较小的省份(影响系数<0.40)包括海南、福建、广东、江苏、上海、浙江以及东北的黑龙江和吉林,其它15个省域处于中间位置,影响系数介于0.40至0.45之间。能源消费结构对中国省域碳强度影响的这种空间差异与不同地区(或省域)资源禀赋的差异和技术水平的不同有关。受资源禀赋的影响,中国中西部地区(特别是西部地区)煤炭资源丰富,能源消费结构中煤炭长期占主导地位,导致当地产业部门能源使用更具有区域特点。在快速工业化和城镇化的进程中,不合理的能源消费结构必然导致西部地区各省域碳强度增加和大气污染加剧;而东部省域煤炭消耗在能源消费结构中的比重相对较低。因此,根据不同区域各省份能源消费结构对碳强度的影响大小,通过实施差异化优化能源消费结构是实现降低当前碳排放量和碳强度的主要方式。
2.3.3 产业结构对碳强度影响的空间差异
产业结构是影响中国各省域碳强度的经济因素。不同地区产业结构的差别对能源消费碳强度的影响存在一定的差异(图4c),但与能源强度和能源消费结构2个因素相比,第三产业比重对碳强度的影响相对较弱,且呈正向影响。出现这种现象的原因可能与各省域产业的投入产出周转量以及第三产业所处的发展阶段对碳强度的影响有关[27]。当前,工业(第二产业)投入产出周转量的变化是大部分地区通过产业结构影响碳强度的主要方式,而农业(第一产业)和批发零售贸易餐饮、交通运输仓储及邮电通讯等第三产业只是局部地区通过产业结构影响碳强度的主要方式,因而以第三产业比重表征的产业结构对碳强度的影响相对较弱。此外,中国目前正处在第三产业的快速发展时期,由于产业规模扩大、基础设施建设需求和技术更新等方面的原因,造成第三产业增速放慢,产出效率下降,导致第三产业比重的提升对碳强度呈正向影响。比较不同地区产业结构对碳强度影响的程度显示,第三产业比重与碳强度的回归系数自西向东呈递减的趋势,其中产业结构对碳强度影响较大的省域(回归系数>0.15)为西部地区的新疆、青海、甘肃、四川、云南和内蒙,影响相对较小的省域(回归系数<0.1)为东部地区的黑龙江、吉林、辽宁、上海、江苏、浙江和福建等。这说明内陆西部地区的省域碳强度比东部沿海地区的更容易受产业结构的影响,其原因可能与不同省域原有经济结构的差异和产业发展思路的不同导致当地产业结构更具区域特点有关;同时也表明西部地区第三产业发展相对缓慢,投入产出周转效率较低,高耗能工业仍是影响该区碳排放的主要因素。因此,西部地区亟需通过加大产业结构调整力度,培育发展新兴第三产业,以促进产业结构升级和减少碳排放协同推进。
2.3.4 经济发展对碳强度影响的空间差异
经济发展对不同省域碳强度的影响存在显著的空间差异,回归系数由东北、西北两个方向往南呈逐渐递减的态势(图4d)。回归系数相对较大的省域有黑龙江、吉林、辽宁、北京、内蒙、天津、河北、山东和新疆,回归系数较小的省域为云南、海南、广东、广西和贵州,其它省域位于二者之间,说明中国不同省域经济发展的异步性非常突出,因此在确定各省域碳强度目标减排对策时,应当针对各省区特定的经济发展阶段决定政策的实施力度。特别是对西部经济发展水平较低的地区,如新疆、内蒙等省区在经济增长过程中碳强度迅速增加,在此阶段需要结合当地情况,重视经济结构转型,注重移植东部发达地区低能耗产业,以实现碳强度的下降;海南、广东等省区在经济增长过程中,碳强度增速放缓,需要在能源效率的技术提升和产业结构的低碳化方面采取政策措施使其抵达拐点;北京、天津2市在经济较快增长的同时,碳强度增速也放缓,但仍需加快产业转移和升级。至于北京、天津2市回归系数较高的原因,一是可能与二者被屈指可数的碳排放大省——河北省包围有关,因为相邻地区碳排放的增加也能促进本地区碳强度的增加,二是可能与GWR模型分析的结果呈带状分布有关。总体来看,在其它条件不变的情况下,本研究期内中国各省域人均GDP增长将加剧碳强度。原因是经济发展对碳强度的影响具有双向作用,据报道[28],当人均GDP<8.18万元时,随着人均GDP的增加,碳强度缓慢增加;而当人均GDP超过8.18万元后,随着人均收入的提高,碳强度将呈快速下降趋势。在本研究中,2015年中国各省域人均GDP变化在1.56~8.03万元,说明中国的经济目前尚未达到拐点,经济发展仍处于人均GDP增加、碳强度增加的状态,从而使各省域经济发展与碳强度的回归系数均为正值(图4d)。
过去有关中国碳强度及其影响因素的研究较小考虑空间依赖性和空间差异性。本文利用ESDA和时空跃迁测度法以及GWR模型分析了1995~2015年中国省域碳强度的空间依赖格局及其影响因素的空间异质性。主要结论是:中国省域碳强度存在显著的空间正相关性,全局Moran’s I指数表现为先下降后上升再到小幅波动的趋势,碳强度相似的省域趋向于集聚分布,说明中国省域碳强度存在明显的空间依赖特征而并非完全的随机状态;中国省域碳强度存在非均衡的发展格局,高-高集聚的省域主要集中在中国西北部,而低-低集聚的省域多分布在中国东南部,碳强度空间集聚总体呈优化态势,高-高集聚的省域在减少,低-低集聚的省域在增加;不同省域在碳强度的空间集聚中所起的作用不同,高-高集聚区域的内蒙古、甘肃和宁夏对推高周边地区碳强度具有正向作用,而处于低-低集聚型的广东、福建、浙江对降低碳强度具有负向作用。GWR模型的回归结果显示,能源强度、能源消费结构、产业结构和人均GDP等碳强度影响因素(解释变量)在不同省域均存在显著的空间差异,4个解释变量与碳强度的空间回归估计系数均为正值且差异显著,对碳强度的影响程度依次为能源强度>能源结构>产业结构>人均GDP。基于上述结论,特提出几点建议: 充分认识碳强度的空间效应,加强省域之间碳减排的横向合作(信息共享、政策协调、省际碳交易)力度; 制定差异化减排政策时,需要考虑碳强度影响因素的空间异质性,对能源效率较低的西北地区,应以提高能源利用效率和改善能源消费结构为重点,进一步优化产业结构,推广清洁能源的生产和使用;对经济发达、能源效率较高的东部和南部沿海省区,应以新技术、新能源和发展高端服务业为重点,构建跨省区推动低碳发展的经济结构转型升级,形成经济与环境协调发展的减排路径; 加强能源丰裕地区低碳政策引导,将碳排放总量和碳强度减少双重目标纳入地方政府考核体系,并实行碳减排责任追究制。
The authors have declared that no competing interests exist.
| [1] |
PRES 2007: Carbon footprint and emission minimization, integration and management of energy sources, industrial application and case studies [J].https://doi.org/10.1016/j.energy.2008.07.010 URL [本文引用: 1] 摘要
This editorial introduces and provides an overview of a Special Issue dedicated to the jubilee 10th Conference Process Integration, Modelling and Optimisation for Energy Saving and Pollution Reduction— PRES’ 07. It contains nine selected papers covering various fields of energy-related most recent developments. The papers deal with carbon footprint (CFP) and CO 2 emissions minimisation during energy generation, integration of fuel cell combined cycles and micro-CHP systems. They are supplemented by studies on power management strategies, gas and liquid fuel burners assessment and two industrial case studies: energy efficiency in pulp and paper Kraft mills and energy saving in reactive distillation.
|
| [2] |
Spatial differences and multi-mechanism of carbon footprint based on GWR model in provincial China [J].https://doi.org/10.1007/s11442-014-1109-z URL Magsci [本文引用: 1] 摘要
Global warming has been one of the major concerns behind the world's high-speed economic growth. How to implement the coordinated development of the carbon footprint and the economy will be the core issue of the world's economic and social development, as well as the heated debate of the research at home and abroad in recent years. Based on the energy consumption, integrated with the "Top-Down" life cycle approach and geographically weighted regression(GWR) model, this paper analyzed the spatial differences and multi-mechanism of carbon footprint in provincial China in 2010. Firstly, this study calculated the amount of carbon footprint of each province using "Top-Down" life cycle approach and found that there were significant differences of carbon footprint and per capita carbon footprint in provincial China. The provinces with higher carbon footprint, mainly located in northern China, have large economic scales; the provinces with higher per capita carbon footprint are mainly distributed in central cities such as Beijing, Shanghai and energy-rich regions and heavy chemical bases. Secondly, with the aid of GIS and spatial analysis model(GWR model), this paper had unfolded that the expansion of economic scale is the main driver of the rapid growth of carbon footprint. The growth of population and urbanization also acted as promoting factors for the increase of the carbon footprint. Energy structure had no considerable promoting effect for the increase of the carbon footprint. Improving energy efficiency is the most important factor to inhibit the growing carbon footprint. Thirdly, developing low-carbon economies and low-carbon industries, as well as advocating low-carbon city construction and improving carbon efficiency would be the primary approaches to inhibit the rapid growth of carbon footprint. Moderately controlling the economic scale and population size would also be required to alleviate carbon footprint. Meanwhile, environmental protection and construction of low-carbon cities would evoke extensive attention in the process of urbanization.
|
| [3] |
中国省域碳排放强度的集聚效应和辐射效应研究 [J].https://doi.org/10.13671/j.hjkxxb.2016.0254 URL [本文引用: 3] 摘要
估算了中国1997—2013年30个省(市、自治区)的碳排放强度数据,并利用全局Moran's Ⅰ指数、局域Moran's Ⅰ指数以及莫兰散点图从集聚效应和辐射效应两个角度考察了我国区域碳排放强度空间分布特征.结果显示:1集聚效应:我国省域碳排放强度具有明显的空间集聚特征,碳排放强度水平相似区域倾向于相邻分布;另外,碳排放强度空间分布呈现不断优化的趋势,即"低-低"集聚不断增加,"高-高"集聚逐渐减少.2辐射效应:内蒙古、宁夏和山西等省对周边地区的碳排放强度具有明显的正向辐射效应,广东、福建和浙江等省对周边地区碳排放强度具有明显的负向辐射效应.最后,据此提出政策建议.
Agglomeration effect and radiation effect of provincial carbon emission intensity in China .https://doi.org/10.13671/j.hjkxxb.2016.0254 URL [本文引用: 3] 摘要
估算了中国1997—2013年30个省(市、自治区)的碳排放强度数据,并利用全局Moran's Ⅰ指数、局域Moran's Ⅰ指数以及莫兰散点图从集聚效应和辐射效应两个角度考察了我国区域碳排放强度空间分布特征.结果显示:1集聚效应:我国省域碳排放强度具有明显的空间集聚特征,碳排放强度水平相似区域倾向于相邻分布;另外,碳排放强度空间分布呈现不断优化的趋势,即"低-低"集聚不断增加,"高-高"集聚逐渐减少.2辐射效应:内蒙古、宁夏和山西等省对周边地区的碳排放强度具有明显的正向辐射效应,广东、福建和浙江等省对周边地区碳排放强度具有明显的负向辐射效应.最后,据此提出政策建议.
|
| [4] |
中国碳强度分布的地区差异与收敛性——基于1995-2009年省际数据的实证研究 [J].Regional differences and convergence of carbon intensity distribution in China: Based on an empirical study of provincial data 1995-2009 . |
| [5] |
1999-2007中国能源消费碳排放强度空间演变特征 [J].Spatial pattern evolution of carbon emission intensity from energy consumption in China . |
| [6] |
中国碳排放强度预测与第三产业比重检验分析 [J].The carbon emission intensity forecast and tertiary industry proportion inspection analysis in China . |
| [7] |
中国区域经济增长的碳排放强度差异及其敛散性 [J].Research on the difference of carbon emission intensity and the convergence in the regional economic growth in China . |
| [8] |
上海市碳排放强度的影响因素解析 [J].
采用对数均值迪氏分解(LMDI)法对1995—2008年上海市碳排放强度进行分解分析.结果表明,产业部门能源强度的下降是上海市碳排放强度下降的主要原因,贡献率为67.6%.进一步分析显示,上海市能源强度的下降主要来源于第二产业,但由于传统的工业节能改造的潜力有限,近年来工业能源强度下降的速度逐渐放缓,其对碳强度减排的贡献趋于减少.能源结构和产业结构的调整是碳排放强度下降的次要原因,贡献率分别为18.2%和14.2%.但是能源结构和产业结构仍然存在较大的调整空间,这2个因素有望对碳排放强度的下降作出持久的贡献.
Decomposition analysis of carbon emission intensity in Shanghai city .
采用对数均值迪氏分解(LMDI)法对1995—2008年上海市碳排放强度进行分解分析.结果表明,产业部门能源强度的下降是上海市碳排放强度下降的主要原因,贡献率为67.6%.进一步分析显示,上海市能源强度的下降主要来源于第二产业,但由于传统的工业节能改造的潜力有限,近年来工业能源强度下降的速度逐渐放缓,其对碳强度减排的贡献趋于减少.能源结构和产业结构的调整是碳排放强度下降的次要原因,贡献率分别为18.2%和14.2%.但是能源结构和产业结构仍然存在较大的调整空间,这2个因素有望对碳排放强度的下降作出持久的贡献.
|
| [9] |
Carbon emissions from manufacturing energy use in 13 IEA countries: long-term trends through 1995 [J].https://doi.org/10.1016/S0301-4215(00)00163-4 URL [本文引用: 1] 摘要
This paper analyses the evolution of carbon emissions from the manufacturing sectors of 13 IEA countries, based on national data at the 2 or 3 sector ISIC level of disaggregation. We carry out an Adaptive-Weighting-Divisia decomposition of changes into factors representing sub-sectoral branch energy intensities, output mix or structure, final fuel mix, and utility fuel mix. We also carry out a detailed comparison of emissions by country and sub-sector for 1994. We find that by the mid-1990s, emissions from manufacturing in most countries were close to their 1973 levels. The main reasons were lower branch energy intensities and in some countries changes in utility fuel mix. Changes in the mix of output had small downward effects in a few large countries (Japan and the United States), while these shifts increased emissions in others (Australia, Norway, Netherlands). Fuel mix changes lowered emissions slightly, principally through moves away from coal and oil towards gas. The comparison of countries shows that after overall output, energy intensities explain most of the differences in per capita emissions from manufacturing. Fuel mix and utility fuel mix play an important role for some countries with very CO 2 鈥 free power sectors (Sweden, Norway, France) or CO 2 intensive power sectors (Australia). Some of the differences in energy intensities, however, arise because of hidden sub-sectoral mix effects that cannot be resolved at the 3-digit ISIC level of disaggregation. Emissions have been rising since 1990, largely because energy intensities are not falling as fast as they did before 1990. What this means for the Kyoto Accord and other concerns related to global carbon emissions remains to be seen.
|
| [10] |
Decomposition analysis of CO2 emission intensity between oil-producing and non-oil-producing sub-Saharan African countries [J].https://doi.org/10.1016/j.enpol.2004.10.012 URL Magsci [本文引用: 2] 摘要
The need to decompose CO 2 emission intensity is predicated upon the need for effective climate change mitigation and adaptation policies. Such analysis enables key variables that instigate CO 2 emission intensity to be identified while at the same time providing opportunities to verify the mitigation and adaptation capacities of countries. However, most CO 2 decomposition analysis has been conducted for the developed economies and little attention has been paid to sub-Saharan Africa. The need for such an analysis for SSA is overwhelming for several reasons. Firstly, the region is amongst the most vulnerable to climate change. Secondly, there are disparities in the amount and composition of energy consumption and the levels of economic growth and development in the region. Thus, a decomposition analysis of CO 2 emission intensity for SSA affords the opportunity to identify key influencing variables and to see how they compare among countries in the region. Also, attempts have been made to distinguish between oil and non-oil-producing SSA countries. To this effect a comparative static analysis of CO 2 emission intensity for oil-producing and non oil-producing SSA countries for the periods 1971 1998 has been undertaken, using the refined Laspeyres decomposition model. Our analysis confirms the findings for other regions that CO 2 emission intensity is attributable to energy consumption intensity, CO 2 emission coefficient of energy types and economic structure. Particularly, CO 2 emission coefficient of energy use was found to exercise the most influence on CO 2 emission intensity for both oil and non-oil-producing sub-Saharan African countries in the first sub-interval period of our investigation from 1971 1981. In the second subinterval of 1981 1991, energy intensity and structural effect were the two major influencing factors on emission intensity for the two groups of countries. However, energy intensity effect had the most pronounced impact on CO 2 emission intensity in non-oil-producing sub-Saharan African countries, while the structural effect explained most of the increase in CO 2 emission intensity among the oil-producing countries. Finally, for the period 1991鈥1998, structural effect accounted for much of the decrease in intensity among non-oil-producers, while CO 2 emission coefficient of energy use was the major force driving the decrease among oil-producing countries. The dynamic changes in the CO 2 emission intensity and energy intensity effects for the two groups of countries suggest that fuel switching had been predominantly towards more carbon-intensive production in oil-producing countries and less carbon-intensive production in non-oil-producing SSA countries. In addition to the decomposition analysis, the article discusses policy implications of the results. We hope that the information and analyses provided here would help inform national energy and climate policy makers in SSA of the relative weaknesses and possible areas of strategic emphasis in their planning processes for mitigating the effects of climate change.
|
| [11] |
1995-2007年中国省区碳排放及碳强度的分析——碳排放与社会发展Ⅲ [J].
利用我国分省区的化石能源消费数据和美国橡树岭国家实验室二氧化碳信息分析中心公布的我国碳排放数据, 对1995?2007年我国各省区的碳排放量、人均碳排放和碳排放强度进行了分析。结果表明, 我国区域碳排放和人均排放排序为: 东部 >中部 > 西部, 但中西部地区碳强度远远高于东部地区, 这种特征与中西部地区高耗能行业占工业比重较高有密切关系。1995?2007 年我国省际碳强度差异变化不大;从东、中、西部地区区域内部和区域之间差异的角度对省际差异进行的分解表明, 我 国省际碳强度差异主要是由区域内部省际差异导致的, 而区域之间差异贡献较小。逐步线性回归分析表明能源资源禀赋、产业结构和能源消费结构是省区碳强度的决因素, 说明我国未来碳强度控制应从调整产业结构、改革能源政策、发展可再生能源等方面着手, 以确保我国控制目标的顺利实现。
Provincial carbon emissions and carbon intensity in China from 1995 to 2007 (Carbon emissions and social development,Ⅲ) .
利用我国分省区的化石能源消费数据和美国橡树岭国家实验室二氧化碳信息分析中心公布的我国碳排放数据, 对1995?2007年我国各省区的碳排放量、人均碳排放和碳排放强度进行了分析。结果表明, 我国区域碳排放和人均排放排序为: 东部 >中部 > 西部, 但中西部地区碳强度远远高于东部地区, 这种特征与中西部地区高耗能行业占工业比重较高有密切关系。1995?2007 年我国省际碳强度差异变化不大;从东、中、西部地区区域内部和区域之间差异的角度对省际差异进行的分解表明, 我 国省际碳强度差异主要是由区域内部省际差异导致的, 而区域之间差异贡献较小。逐步线性回归分析表明能源资源禀赋、产业结构和能源消费结构是省区碳强度的决因素, 说明我国未来碳强度控制应从调整产业结构、改革能源政策、发展可再生能源等方面着手, 以确保我国控制目标的顺利实现。
|
| [12] |
Examining the driving forces for improving China’s CO2 emission intensity using the decomposing method [J].https://doi.org/10.1016/j.apenergy.2011.05.042 URL Magsci [本文引用: 2] 摘要
This paper examines the driving forces for reducing China’s CO emission intensity between 1998 and 2008, utilizing the logarithmic mean divisia index (LMDI) technique. By first grouping the CO emissions into two categories, those arising from activities related to the electric power industry and those from other sources, emission intensity is further broken down into the effects of the CO emission coefficient, energy intensity of power generation, power generation and consumption ratio, electricity intensity of the gross domestic product (GDP), provincial structural change, and the energy intensity of the GDP for other activities. The decomposition results show that improvements in the energy intensity of power generation, electricity intensity of GDP, and energy intensity of GDP for other activities were mainly responsible for the success in reducing China’s CO emission intensity and that activities related to the electric power industry played a key role. It is also revealed that performance varied significantly at the individual province level. The provinces with higher emission levels contributed the most to China’s improvements in CO emission intensity.Highlights? China’s CO emission intensity dropped substantially in last few years. ? The electric power industry played a key role in obtaining this gain. ? The contributions of other activities were also considerable. ? The provinces with higher emission levels contributed more than others.
|
| [13] |
基于STIRPAT模型的重庆市能源消费碳排放影响因素研究 [J].
Carbon emissions from a city can be analyzed quantitatively to trace the impact of each human activity type on the environment. The analytic results provide useful guidance to carbon emissions policy making and sustainable urban development. This paper built a STIPRAT-based multivariate linear model fitted by a ridge regression to examine the relationship between carbon emissions from energy consumption and a list of human activity indices, including population, per capita GDP, energy intensity, proportion of the tertiary industry, and level of urbanization. For an empirical case study with time-series data (1980-2010) from the city of Chongqing, it was found that for 1% increase in population, per-capita GDP, energy intensity, and urbanization, there was 0.963%, (0.398+0.463ln)%, 0.059%, and 0.266% increase in carbon emissions in the city, respectively, in which refers to per capita GDP.Population contributed the most significantly to carbon emissions. In comparison, every 1% increase in the strength of the tertiary industry led to 0.093% emission reduction.
Influencing factors of carbon emissions from energy consumptions in Chongqing based on STIRPAT model .
Carbon emissions from a city can be analyzed quantitatively to trace the impact of each human activity type on the environment. The analytic results provide useful guidance to carbon emissions policy making and sustainable urban development. This paper built a STIPRAT-based multivariate linear model fitted by a ridge regression to examine the relationship between carbon emissions from energy consumption and a list of human activity indices, including population, per capita GDP, energy intensity, proportion of the tertiary industry, and level of urbanization. For an empirical case study with time-series data (1980-2010) from the city of Chongqing, it was found that for 1% increase in population, per-capita GDP, energy intensity, and urbanization, there was 0.963%, (0.398+0.463ln)%, 0.059%, and 0.266% increase in carbon emissions in the city, respectively, in which refers to per capita GDP.Population contributed the most significantly to carbon emissions. In comparison, every 1% increase in the strength of the tertiary industry led to 0.093% emission reduction.
|
| [14] |
中国碳排放强度的行业差异与动因分析 [J].https://doi.org/10.1007/s11802-014-2294-1 URL [本文引用: 1] 摘要
测算了1995—2010年中国各行业的碳排放强度,并采用行业分解方法分析了各行业对中国碳排放强度的影响.结果表明:工业碳排放对总体碳排放强度下降起主导作用,对其下降的贡献率为73.35%;其他服务业次之,贡献率为22.68%;农业、交通运输业、商业和建筑业贡献率较低,分别为1.38%、1.22%、1.17%、0.20%.采用泰尔指数对中国碳排放强度进行行业差异分析发现,1995—2010年中国各行业碳排放强度泰尔指数从0.392 7升至0.488 9,行业间碳排放强度的差异呈扩大趋势.运用差值因素分解模型分析中国碳排放强度变化动因发现,在1995—2010年中国碳排放强度的下降中,技术效应具有促进作用,贡献率为104.64%;结构效应具有抑制作用,贡献率为-4.64%.未来宜从优化产业结构、加快技术研发和应用等方面降低碳排放强度.
Analysis on industrial difference and motivation factor of carbon emission intensity .https://doi.org/10.1007/s11802-014-2294-1 URL [本文引用: 1] 摘要
测算了1995—2010年中国各行业的碳排放强度,并采用行业分解方法分析了各行业对中国碳排放强度的影响.结果表明:工业碳排放对总体碳排放强度下降起主导作用,对其下降的贡献率为73.35%;其他服务业次之,贡献率为22.68%;农业、交通运输业、商业和建筑业贡献率较低,分别为1.38%、1.22%、1.17%、0.20%.采用泰尔指数对中国碳排放强度进行行业差异分析发现,1995—2010年中国各行业碳排放强度泰尔指数从0.392 7升至0.488 9,行业间碳排放强度的差异呈扩大趋势.运用差值因素分解模型分析中国碳排放强度变化动因发现,在1995—2010年中国碳排放强度的下降中,技术效应具有促进作用,贡献率为104.64%;结构效应具有抑制作用,贡献率为-4.64%.未来宜从优化产业结构、加快技术研发和应用等方面降低碳排放强度.
|
| [15] |
中国制造业碳排放强度变动及其因素分解 [J].https://doi.org/10.3969/j.issn.1002-2104.2011.05.017 URL [本文引用: 2] 摘要
目前,中国已成为世界制造大国,并且制造业的碳排放量已占全国碳排放总量的80%以上,要寻 找制造业的有效减排途径,就需要准确分析和计量促使制造业碳排放增加的影响因素。为此,本文在对我国制造业碳排放强度变化趋势进行分析的基础上,运用因素 分解法将碳排放强度变化分解为结构份额与效率份额,并基于1996—2007年的统计数据对我国制造业碳排放强度变化中的结构份额和效率份额进行了测算。 结果表睨。我国制造业碳排放强度在1996—2007年间整体呈现出下降的趋势,我国制造业碳排放强度的下降均是由效率引起的,而结构则引起了碳排放强度 的提升。因此,应大力推进低碳技术的开发。以进一步发挥效率份额在制造业碳排放强度下降的积极作用,同时,进一步优化制造业产业结构,逐步淘汰一些高碳排 放行业,使制造业产业结构向规模化、低碳化和高端化升级。
On the changes in the carbon emission intensity of China’s manufacturing industry and its factors decomposition. https://doi.org/10.3969/j.issn.1002-2104.2011.05.017 URL [本文引用: 2] 摘要
目前,中国已成为世界制造大国,并且制造业的碳排放量已占全国碳排放总量的80%以上,要寻 找制造业的有效减排途径,就需要准确分析和计量促使制造业碳排放增加的影响因素。为此,本文在对我国制造业碳排放强度变化趋势进行分析的基础上,运用因素 分解法将碳排放强度变化分解为结构份额与效率份额,并基于1996—2007年的统计数据对我国制造业碳排放强度变化中的结构份额和效率份额进行了测算。 结果表睨。我国制造业碳排放强度在1996—2007年间整体呈现出下降的趋势,我国制造业碳排放强度的下降均是由效率引起的,而结构则引起了碳排放强度 的提升。因此,应大力推进低碳技术的开发。以进一步发挥效率份额在制造业碳排放强度下降的积极作用,同时,进一步优化制造业产业结构,逐步淘汰一些高碳排 放行业,使制造业产业结构向规模化、低碳化和高端化升级。
|
| [16] |
中国能源消费碳排放强度及其影响因素的空间计量 [J].https://doi.org/10.11821/dlxb201310011 URL [本文引用: 1] 摘要
The sustainable development has been seriously challenged by global climate change due to carbon emissions. As a developing country, China promised to reduce 40% 45% below the level of the year 2005 on its carbon intensity by 2020. The realization of this target depends on not only the substantive transition of society and economy at the national scale, but also the action and share of energy saving and emissions reduction at the provincial scale. Based on the method provided by the IPCC, this paper examines the spatiotemporal dynamics and dominating factors of China's carbon intensity from energy consumption in 1997鈥2010. The aim is to provide scientific basis for policy making on energy conservation and carbon emission reduction in China. The results are shown as follows. Firstly, China's carbon emissions increased from 4.16 Gt to 11.29 Gt from 1997 to 2010, with an annual growth rate of 7.15%, which was much lower than that of GDP(11.72%). Secondly, the trend of Moran's I indicated that China's carbon intensity has a growing spatial agglomeration at the provincial scale. The provinces with either high or low values appeared to be path-dependent or space-locked to some extent. Third, according to spatial panel econometric model, energy intensity, energy structure, industrial structure and urbanization rate were the dominating factors shaping the spatiotemporal patterns of China's carbon intensity from energy consumption. Therefore, in order to realize the targets of energy conservation and emission reduction, China should improve the efficiency of energy utilization, optimize energy and industrial structure, choose the low-carbon urbanization approach and implement regional cooperation strategy of energy conservation and emissions reduction.
Spatial econometric analysis of carbon emission intensity and its driving factors from energy consumption in China .https://doi.org/10.11821/dlxb201310011 URL [本文引用: 1] 摘要
The sustainable development has been seriously challenged by global climate change due to carbon emissions. As a developing country, China promised to reduce 40% 45% below the level of the year 2005 on its carbon intensity by 2020. The realization of this target depends on not only the substantive transition of society and economy at the national scale, but also the action and share of energy saving and emissions reduction at the provincial scale. Based on the method provided by the IPCC, this paper examines the spatiotemporal dynamics and dominating factors of China's carbon intensity from energy consumption in 1997鈥2010. The aim is to provide scientific basis for policy making on energy conservation and carbon emission reduction in China. The results are shown as follows. Firstly, China's carbon emissions increased from 4.16 Gt to 11.29 Gt from 1997 to 2010, with an annual growth rate of 7.15%, which was much lower than that of GDP(11.72%). Secondly, the trend of Moran's I indicated that China's carbon intensity has a growing spatial agglomeration at the provincial scale. The provinces with either high or low values appeared to be path-dependent or space-locked to some extent. Third, according to spatial panel econometric model, energy intensity, energy structure, industrial structure and urbanization rate were the dominating factors shaping the spatiotemporal patterns of China's carbon intensity from energy consumption. Therefore, in order to realize the targets of energy conservation and emission reduction, China should improve the efficiency of energy utilization, optimize energy and industrial structure, choose the low-carbon urbanization approach and implement regional cooperation strategy of energy conservation and emissions reduction.
|
| [17] |
中国省域碳强度集群的空间统计分析 [J].
论文使用空间统计分析中的全局Moran's I、局域Moran's I等指数对2001-2012年间我国碳强度的空间自相关性以及集群情况进行分析,发现全国省域碳强度的空间自相关性为正,东部地区内部省域的碳强度空间 自相关现象非常明显,西部地区相对不明显,中部最弱.西部地区省份的碳强度多为高-高聚集,以甘肃、陕西、内蒙古3个地区为代表,东部地区多为低-低聚 集,以浙江、福建、广东、江西4个地区为代表.论文还进一步结合资源禀赋、能源供需分布、产业结构和收入水平等对上述地区碳强度聚集的原因进行了分析,提 出针对性的政策建议.
Spatial cluster analysis of provincial carbon intensity in China .
论文使用空间统计分析中的全局Moran's I、局域Moran's I等指数对2001-2012年间我国碳强度的空间自相关性以及集群情况进行分析,发现全国省域碳强度的空间自相关性为正,东部地区内部省域的碳强度空间 自相关现象非常明显,西部地区相对不明显,中部最弱.西部地区省份的碳强度多为高-高聚集,以甘肃、陕西、内蒙古3个地区为代表,东部地区多为低-低聚 集,以浙江、福建、广东、江西4个地区为代表.论文还进一步结合资源禀赋、能源供需分布、产业结构和收入水平等对上述地区碳强度聚集的原因进行了分析,提 出针对性的政策建议.
|
| [18] |
Some notes on parametric significance tests for geographically weighted regression [J].https://doi.org/10.1111/0022-4146.00146 URL [本文引用: 1] 摘要
The technique of geographically weighted regression (GWR) is used to model spatial 'drift' in linear model coefficients. In this paper we extend the ideas of GWR in a number of ways. First, we introduce a set of analytically derived significance tests allowing a null hypothesis of no spatial parameter drift to be investigated. Second, we discuss 'mixed' GWR models where some parameters are fixed globally but others vary geographically. Again, models of this type may be assessed using significance tests. Finally, we consider a means of deciding the degree of parameter smoothing used in GWR based on the Mallows C p statistic. To complete the paper, we analyze an example data set based on house prices in Kent in the U.K. using the techniques introduced.
|
| [19] |
|
| [20] |
|
| [21] |
近20年来中国能源消费碳排放时空格局动态研究 [J].https://doi.org/10.18306/dlkxjz.2016.06.008 URL [本文引用: 1] 摘要
CO2等温室气体引起的全球气候变暖是对人类社会可持续发展的严峻挑战。基于IPCC提供的参考方法,在对中国大陆30个省区(不含西藏)能源消费碳排放量估算的基础上,运用ESTDA框架,通过ESDA、LISA时间路径、时空跃迁和标准差椭圆等方法,从时空耦合的角度分析了1995-2014年中国能源消费碳排放时空格局动态性。结果表明:(1)近20年来中国省域碳排放具有显著的空间正相关性,碳排放空间差异呈先缩小后扩大的趋势;(2)LISA时间路径分析显示,中国大部分省区的局部空间结构具有较强的稳定性,1995-2001年和2002-2014年2个时段相对长度都小于平均长度的省区均为18个,大部分南方省区在空间依赖方向上的波动性呈增强趋势,而北方大多数省区则保持相对稳定;(3)出现协同运动的省区由1995-2001年的13个下降到2002-2014年的10个,表明中国碳排放空间格局具有一定的空间整合性,但呈减弱趋势;(4)中国省域碳排放的局部空间关联模式和集聚特征具有较强的稳定性,表现为一定的路径依赖或空间锁定特征;(5)碳排放重心在113.739°~114.324°E、34.475°~35.036°N之间变动,整体上有向西北方向移动的趋势。中国碳排放空间分布呈东北—西南格局,且有逐步向正北—正南转变的趋势。中国碳减排的重点是加快发展清洁能源与提高能效并重,优化能源结构和促进各省区产业结构转型,制定差异化的省域碳减排政策,建立碳交易制度。
Spatiotemporal dynamics of carbon emissions by energy consumption in China from 1995 to 2014 .https://doi.org/10.18306/dlkxjz.2016.06.008 URL [本文引用: 1] 摘要
CO2等温室气体引起的全球气候变暖是对人类社会可持续发展的严峻挑战。基于IPCC提供的参考方法,在对中国大陆30个省区(不含西藏)能源消费碳排放量估算的基础上,运用ESTDA框架,通过ESDA、LISA时间路径、时空跃迁和标准差椭圆等方法,从时空耦合的角度分析了1995-2014年中国能源消费碳排放时空格局动态性。结果表明:(1)近20年来中国省域碳排放具有显著的空间正相关性,碳排放空间差异呈先缩小后扩大的趋势;(2)LISA时间路径分析显示,中国大部分省区的局部空间结构具有较强的稳定性,1995-2001年和2002-2014年2个时段相对长度都小于平均长度的省区均为18个,大部分南方省区在空间依赖方向上的波动性呈增强趋势,而北方大多数省区则保持相对稳定;(3)出现协同运动的省区由1995-2001年的13个下降到2002-2014年的10个,表明中国碳排放空间格局具有一定的空间整合性,但呈减弱趋势;(4)中国省域碳排放的局部空间关联模式和集聚特征具有较强的稳定性,表现为一定的路径依赖或空间锁定特征;(5)碳排放重心在113.739°~114.324°E、34.475°~35.036°N之间变动,整体上有向西北方向移动的趋势。中国碳排放空间分布呈东北—西南格局,且有逐步向正北—正南转变的趋势。中国碳减排的重点是加快发展清洁能源与提高能效并重,优化能源结构和促进各省区产业结构转型,制定差异化的省域碳减排政策,建立碳交易制度。
|
| [22] |
县域尺度的京津冀都市圈CO2排放时空演变特征 [J].
二氧化碳排放具有阶段性空间分布特征,研究其区域特征和格局演变可为减排提供重要的依据和方向.利用1990~2009年京津冀都市圈128个县级区域的二氧化碳排放量数据,运用比较统计地图和空间自相关分析方法对都市圈的二氧化碳排放的空间格局和空间依赖性进行研究.结果表明,京津冀都市圈二氧化碳排放量逐年增加,2002年之后的平均增速是2002年之前的1.8倍.各市二氧化碳排放增长趋势不一,呈三类变化趋势.都市圈二氧化碳排放格局呈现较明显的分层聚集现象,全局Moran指数先由1.44降低至1998年的0.09后缓慢回升至0.10,二氧化碳排放高值区域空间分布由"双中心"发展至"四中心",低值区域变化较小.局部空间自相关性则呈现了4种类型的变化:大部分区域基本保持不变或减弱,唐山等地增强,天津部分区域和宣化县转变.高值中心和低值区域的空间自相关演变过程并不相同,在制定减排规划时需要因地制宜,适当考虑周边区域的相互作用.空间格局和空间自相关关系的探讨对于认识京津冀都市圈二氧化碳排放的空间规律和制定减排战略规划具有重要意义,也为都市圈低碳发展研究提供了基础.
County scale characteristics of CO2 emissions spatial-temporal evolution in the Beijing-Tianjin-Hebei Metropolitan Region .
二氧化碳排放具有阶段性空间分布特征,研究其区域特征和格局演变可为减排提供重要的依据和方向.利用1990~2009年京津冀都市圈128个县级区域的二氧化碳排放量数据,运用比较统计地图和空间自相关分析方法对都市圈的二氧化碳排放的空间格局和空间依赖性进行研究.结果表明,京津冀都市圈二氧化碳排放量逐年增加,2002年之后的平均增速是2002年之前的1.8倍.各市二氧化碳排放增长趋势不一,呈三类变化趋势.都市圈二氧化碳排放格局呈现较明显的分层聚集现象,全局Moran指数先由1.44降低至1998年的0.09后缓慢回升至0.10,二氧化碳排放高值区域空间分布由"双中心"发展至"四中心",低值区域变化较小.局部空间自相关性则呈现了4种类型的变化:大部分区域基本保持不变或减弱,唐山等地增强,天津部分区域和宣化县转变.高值中心和低值区域的空间自相关演变过程并不相同,在制定减排规划时需要因地制宜,适当考虑周边区域的相互作用.空间格局和空间自相关关系的探讨对于认识京津冀都市圈二氧化碳排放的空间规律和制定减排战略规划具有重要意义,也为都市圈低碳发展研究提供了基础.
|
| [23] |
Interactive techniques and exploratory spatial data analysis [J]. |
| [24] |
Geographically weighted regression: the analysis of spatially varying relationships [M]. |
| [25] |
Local indicators of spatial association—LISA [J]. |
| [26] |
Spatial empirics for economic growth and convergence [J].https://doi.org/10.1111/j.1538-4632.2001.tb00444.x URL [本文引用: 1] 摘要
This paper suggests some new empirical strategies for analyzing the evolution of regional income distributions over time and space. These approaches are based on extensions to the classical Markov transition matrices that allow for a more comprehensive analysis of the geographical dimensions of the transitional dynamics. This is achieved by integrating some recently developed local spatial statistics within a Markov framework. Insights to not only the frequency with which one economy may transition across different classes in the income distribution, but also how those transitions may or may not be spatially dependent are provided by these new measures. A number of indices are suggested as ways to characterize the space-time dynamics and are illustrated in a case study of U. S. regional income dynamics over the 1929 1994 period.
|
| [27] |
中国省域城镇居民碳排放驱动因素分析 [J].https://doi.org/10.13249/j.cnki.sgs.2016.05.006 URL Magsci [本文引用: 1] 摘要
从消费角度出发,分别对2003和2012年中国城镇(不含港、澳、台地区)居民碳排放的特征及影响因素进行分析。结果显示,不同地区城镇居民碳排放存在明显差异,人口因素对区域分异有弱化作用。从城镇居民人均碳排放来看,不同地区消费构成、能源结构、产业结构3因素对城镇居民碳排放影响的差异总体表现为:消费结构/能源结构〉产业结构。与其他部门相比,大多数地区工业部门的生产能耗、投入产出周转量和产品购买量是影响当地城镇居民碳排放的主要因素,各地区城镇居民碳排放的影响因素具有明显的区域特点。政府应在当前研究的基础上,根据当地能耗模式、产业模式和消费模式因地置宜管理城镇居民碳排放。
Driving factors analysis of carbon emissions in Chinese provincial urban households .https://doi.org/10.13249/j.cnki.sgs.2016.05.006 URL Magsci [本文引用: 1] 摘要
从消费角度出发,分别对2003和2012年中国城镇(不含港、澳、台地区)居民碳排放的特征及影响因素进行分析。结果显示,不同地区城镇居民碳排放存在明显差异,人口因素对区域分异有弱化作用。从城镇居民人均碳排放来看,不同地区消费构成、能源结构、产业结构3因素对城镇居民碳排放影响的差异总体表现为:消费结构/能源结构〉产业结构。与其他部门相比,大多数地区工业部门的生产能耗、投入产出周转量和产品购买量是影响当地城镇居民碳排放的主要因素,各地区城镇居民碳排放的影响因素具有明显的区域特点。政府应在当前研究的基础上,根据当地能耗模式、产业模式和消费模式因地置宜管理城镇居民碳排放。
|
| [28] |
中国地区经济增长对碳排放强度的影响 [J].The impacts of China’s regional economic growth on carbon emission intensity: Based on the analysis of a spatial panel model . |

/
| 〈 |
|
〉 |