李爽 , 赵相杰, 翟俊瑞
Li Shuang, Zhao Xiangjie, Zhai Junrui
中图分类号: S152.7
文献标识码: A
文章编号: 1000-0690(2018)07-1189-09
通讯作者:
收稿日期: 2017-06-20
修回日期: 2017-09-12
网络出版日期: 2018-07-20
版权声明: 2018 《地理科学》编辑部 本文是开放获取期刊文献,在以下情况下可以自由使用:学术研究、学术交流、科研教学等,但不允许用于商业目的.
基金资助:
作者简介:
作者简介:李爽(1990-),女,辽宁沈阳人,博士研究生,主要研究方向为土壤侵蚀与土地生产力。E-mail: 929122959@qq.com
展开
摘要
在东北黑土区采集了不同侵蚀强度黑土土样,测定其土壤水分、机械组成、有机质和容重等指标,利用Rosetta模型估计了Van Genuchten模型的参数,并将估算土壤水分与实测土壤水分对比,评价了选择不同土壤理化性质指标的模拟精度,及该方法对东北黑土的适宜性。结果表明:选择4个或6个土壤性质指标,尺度参数(α)和形状参数(n)的差异较大,采用6指标时,α增大,n减小。修正VG模型参数m与n的关系后,模型拟合精度明显提高,其中6指标的计算结果好于4指标,但拟合值偏大,需进一步较正。Rosetta模型适用于砂粒含量小于46%,粘粒含量大于28%的东北黑土。
关键词:
Abstract
The soil water retention curve (SWRC) is the basic parameter of soil hydraulics to study soil water movement and soil water balance, which is closely related to soil physical and chemical properties. But the parameters of model is difficult to estimate. In this study, black soil samples with different erosion intensity were collected in the black soil region of Northeast China, and soil moisture under 7 soil water suction, mechanical composition, organic matter and bulk density were measured. We used Rosetta model to estimate the parameters of Van Genuchten (VG) model and compared the estimated soil moisture with the measured soil moisture. And then the simulation accuracy of different soil physical and chemical indexes and the suitability of the method to the black soil in Northeast China were evaluated. The results showed that there had little effect for the residual water content (θr) and saturated water content (θs) between 4 or 6 soil properties index, but had large difference for the scale parameter (α) and shape parameter (n). When the 6 indexes were used, shape parameter n decreased with the increased of scale parameter α. The relationship between the shape parameters m and n of the VG model was further modified, which improved the accuracy of model fitting obviously. The results of the 6 indexes were better than the 4 indexes. But the estimated values were different from the measured values and the estimated values were larger than the measured, which means soil moisture estimation need to be corrected according to the estimated value of relatively large degree. The fitting precision of Rosetta model for lightly and moderately erosion black soil was higher, and the precision of severely erosion black soil was lower. The model was suitable for sand content less than 46%, the clay content more than 28% of black soil in Northeast China.
Keywords:
土壤水分特征曲线是研究土壤水运动及土壤水平衡的土壤水力学基本参数,与土壤理化性质密切相关[1,2]。2016年北京师范大学地理科学学部土壤侵蚀组通过比较不同的土壤水分特征曲线模型,提出Van Genuchten(简称VG)模型更适合东北黑土[3]。但此模型参数直接测定时需采集原状土,测定多个土壤吸力下土壤水分,当采样条件有限或研究大尺度条件下水力参数时,工作量大,难以保证数据的完整性,限制了模型的应用。为此,很多学者提出用土壤理化性质估算特征曲线模型参数的方法,其中,美国盐土实验室Schaap提出的Rosetta模型目前应用较广[4,5]。该模型基于人工神经网络方法,通过不同输入变量与输出变量之间的迭代修正,最终可输出VG模型参数 [5]。此方法减小了实际测定工作量,并解决了数据不足的问题,对于较大区域土壤水分特征曲线推求,简洁有效[6]。近年来,关于Rosetta模型的研究多集中于推求土壤的水力参数及不同土壤水分传递函数估算效果比较。王欢元等利用Rosetta模型预测砒砂岩与沙复配土的土壤水力学参数,结果表明,复配土中砒砂岩比例增加,田间持水量、饱和含水量、有效含水量变幅较大[7]。有学者利用土壤水分传递函数估算包括饱和含水量、田间持水量、凋萎湿度在内的土壤水分,发现Rosetta模型对田间持水量的估算效果较好,而对于饱和含水量拟合效果较差 [6,8]。研究者通过比较多个样点拟合精度发现,基于人工神经外网络的土壤水分传递函数拟合误差明显小于线性或非线性回归拟合误差 [9,10]。而对于大尺度范围内推广研究较少。东北黑土区是中国的首要粮仓,以雨养农业为主,较高含量的土壤有机质及良好的土壤结构是黑土蓄水的重要支撑。但土壤侵蚀会造成土壤理化性质改变,土壤持水能力下降,严重影响土壤生产力[11,12]。目前,东北大尺度范围内土壤水力参数获取依然困难,因此,如何获得反映土壤持水性能的土壤水分特征曲线参数,科学有效提高黑土土地生产力变得尤为重要。
本研究选择黑龙江省农垦总局九三分局鹤山农场境内不同侵蚀强度的黑土,采集样品测定不同土壤水吸力对应的土壤水分,机械组成及土壤容重。用Rosetta模型推求并率定不同侵蚀强度黑土土壤水分特征曲线VG模型参数,并估算不同吸力对应的土壤水分,比较VG模型拟合结果与实测结果,分析Rosetta模型估算东北黑土土壤水分特征曲线VG模型参数的实用性,划分Rosetta模型适用的土壤粘、粉及砂粒范围。为Rosetta模型在东北黑土大尺度上应用提供科学支撑,为研究土壤水运动及平衡提供基本参数。
研究区位于黑龙江省西北部(125°16′~125°21′E,48°59′~49°03′N之间),农垦总局九三分局鹤山农场境内。该区处于漫川漫岗地带,坡长较长,可达上千米,坡度较缓,一般在1°~4°之间[13]。气候属于中温带大陆性季风气候,多年平均气温为0.4℃,冬夏温差较大,冬季最低温度约为-43.7℃,夏季最高温度可达37℃。年降水量约为500 mm,年降水量的66.6%集中在6~8月[13]。
研究区土壤以典型黑土为主,占总面积的64.2%,其余为21.2%的棕色森林土及14.6%的草甸土。黑土的上部以粘土层为主,下部粘粒含量减小,砂砾含量增加[14]。土壤容重约为1.27 g/cm3,土壤有机质含量较高,一般为3%~5%。人类活动导致土壤侵蚀加速发生,表层黑土层逐渐变薄到出现破皮黄。农场近年主要种植大豆(Glycine max)和玉米(Zea mays),以大型机械辅助耕作。地块被人工种植防风林分割,顺林带起垄,造成垄向有3类,与等高线平行、斜交或垂直,与之对应的种植方式为横坡、斜坡或顺坡种植。长期耕作后,这种坡度及坡位差异,造成土壤侵蚀程度不一,横坡种植土壤侵蚀程度较轻,顺坡种植土壤侵蚀最为严重,黑土层厚度明显降低,个别地块出现破皮黄,土壤持水性能随之发生改变。
研究区典型土壤剖面分为3层:黑土层(A)、过渡层(B)和母质层(C),土层颜色由暗黑色逐渐变浅,土壤侵蚀使黑土层变薄或直接消失。在研究区的农耕地中挖土壤剖面,通过比色卡判断黑土层厚度,并结合地貌部位、母质类型等,确定轻、中、重3种侵蚀强度黑土15个采样点。其中包括7个轻度侵蚀样点,5个中度侵蚀样点和3个重度侵蚀样点(表1)。轻度侵蚀样点黑土层厚度均大于30 cm,中度侵蚀样点黑土层厚度为20~30 cm,重度侵蚀样点S-1和S-2黑土层已完全被侵蚀,黑土层厚度为0 cm。样点S-3黑土层厚度为28 cm,但其砂粒含量已达55.3 %,土壤质地较粗,本研究将其定为重度侵蚀样点。
表1 不同侵蚀强度黑土样地及土壤性质
Table 1 The sampling point of different eroded black soils and soil property
| 侵蚀强度 | 模型处理 | 样点编号 | 黑土层(cm) | 砂粒(%) | 粉粒(%) | 粘粒(%) | ||
|---|---|---|---|---|---|---|---|---|
| 轻度 | 拟合 | L-1 | 30 | 31.93 | 34.06 | 34.01 | ||
| 拟合 | L-2 | 40 | 31.74 | 39.50 | 28.76 | |||
| 拟合 | L-3 | 40 | 43.47 | 24.97 | 31.56 | |||
| 验证 | L-4 | 70 | 32.95 | 34.60 | 32.45 | |||
| 验证 | L-5 | 30 | 35.27 | 37.01 | 27.72 | |||
| 验证 | L-6 | 55 | 30.61 | 36.59 | 32.80 | |||
| 验证 | L-7 | 70 | 26.86 | 39.22 | 33.91 | |||
| 中度 | 拟合 | M-1 | 30 | 31.30 | 35.56 | 33.14 | ||
| 拟合 | M-2 | 25 | 32.43 | 33.48 | 34.08 | |||
| 拟合 | M-3 | 20 | 40.89 | 25.12 | 33.99 | |||
| 验证 | M-4 | 25 | 33.89 | 36.72 | 29.39 | |||
| 验证 | M-5 | 30 | 55.81 | 22.02 | 22.16 | |||
| 重度 | 拟合 | S-1 | 0 | 68.28 | 13.88 | 17.84 | ||
| 拟合 | S-2 | 0 | 75.31 | 12.32 | 12.37 | |||
| 拟合 | S-3 | 28 | 53.33 | 25.50 | 21.17 | |||
确定不同侵蚀强度采样点后,在每个采样点挖一个土壤剖面,分20 cm、40 cm、60 cm三层采集土样并测定土壤水分特征曲线、机械组成、有机质及容重。① 用直径4 cm、高1 cm的刚性PVC环采集原状土,共7个(33,50,100,300,500,1 000,1 500 kPa)土壤水吸力,每个吸力6个重复,土壤数量为:15个采样点×3个深度×7个土壤水吸力×6个重复=1 890个。用1600型5 bar压力膜仪测在33~300 kPa土壤吸力下的土壤含水量,1500F1型15 bar压力膜仪测在500~1 500 kPa土壤吸力下的土壤含水量。② 每个采样点取混合散土样,自然风干后,机械组成土样过2 mm筛,有机质土样过0.149 mm筛。用吸管法测定土壤机械组成,重铬酸钾容量法测定土壤有机质。③ 用100 cm3的环刀采集原状土,每个深度取3 个重复,共135个环刀样,用于测定土壤饱和含水量及容重。
Rosetta模型中涉及到的VG模型表达式为:
式中:Θ为有效含水量,θ为土壤吸力为h(kPa)时的土壤含水量(cm3/cm3),θs为饱和含水量(cm3/cm3),θr为滞留含水量(cm3/cm3),是土壤在极干情况下的含水量,α为尺度参数,与土壤通气性相关(1/kPa),m、n为形状参数,两参数默认关系为:m=1-1/n。
VG模型参数较难通过实验获得,可利用Rosetta模型推求。Rosetta模型选取的土壤理化性质变量不仅容易获得,而且随选择变量有少到多依次分为5个等级:① 仅输入土壤质地类型;② 输入土壤砂粒-粉粒-粘粒含量;③ 输入土壤砂粒-粉粒-粘粒含量和容重;④ 输入砂粒-粉粒-粘粒含量、容重和33 kPa土壤水吸力对应的土壤水分;⑤ 输入砂粒-粉粒-粘粒含量、容重、33 kPa和1 500 kPa土壤水吸力对应的土壤水分。本研究选择无水分指标的和含水分指标,即含有4个指标的第3等级和6个指标的第5等级变量输入模型(以下简称4指标和6指标),以对比两种变量输入等级的拟合精度。
参数估算具体步骤包括:首先利用其中9个样点(轻、中、重侵蚀各3个点)数据,采用Rosetta模型的4指标和6指标,得到VG模型参数。然后用VG模型估算8个吸力的土壤水分含量(包括0 kPa下的饱和含水量),与土壤水分实测值比较,对Rosetta模型的估算参数进行修正。最后利用其余6个样点(轻度侵蚀4个点,中度侵蚀2个点)实测数据,对估计参数修正后的VG模型模拟结果进行验证。比较拟合值与实测值的差异采用相对误差、均方根误差(RMSE)以及拟合值与实测值回归线与1∶1线差异的检验方法。
式中:RMSE为均方根误差,N为实测土壤水分个数,θmi为实测土壤水分,θei为拟合土壤水分。
文中用EXCLE 2010软件计算基础数据,用SPSS 11.0软件,选择配对t检验或单因素方差分析进行差异性检验,置信区间均为95%,用Origin 8.5软件进行线性回归并作图。
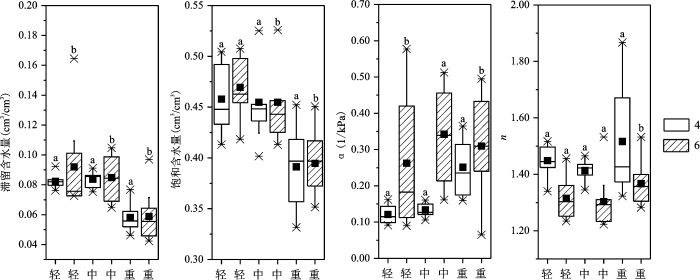
利用轻、中、重3种侵蚀强度黑土9个样点数据,采用Rosetta模型输入4指标或6指标,得到VG模型参数(图1、表2),结果表明:相同侵蚀强度,除轻度侵蚀θs、中度侵蚀α、轻、中度侵蚀n之外,其余输入4指标与6指标的到VG模型参数间均存在显著。无论采用4指标或6指标,不同侵蚀强度黑土间参数的差异表现出相同的规律:轻度与中度侵蚀之间各参数无显著差异,但它们与重度侵蚀之间差异显著。Rosetta模型输入6指标时,随侵蚀强度增加,θr和θs明显减少。重度侵蚀黑土θr和θs均值最小,分别为0.06 cm3/cm3和0.39 cm3/cm3;与土壤透气性相关的尺度参数α,随侵蚀强度增加,呈现先增加后减小的趋势,轻度侵蚀最小为0.261/kPa,中度和重度侵蚀分别为轻度侵蚀的1.31和1.19倍;这是由于土壤透气性与土壤质地和结构有关,土壤砂粒含量越高,结构越好,透气性越好[15]。黑土本身粘粒含量很高,随着侵蚀强度的增加,土壤砂粒含量增加,但如果侵蚀进一步强烈,又会破坏土壤结构,因此中度侵蚀黑土的透气性最好;对于形状参数n,不同侵蚀强度黑土之间差异不显著,随侵蚀强度增加,均值呈现增加趋势。输入4指标时,各个参数随侵蚀强度的增加,变化趋势和6指标相似,参数α和n差异较大。较于6指标,采用4指标时,轻、中、重3种侵蚀强度黑土α分别减小53.84%、61.00%和18.76%。n分别增加10.17%、8.46%和10.92%。
图1 不同侵蚀强度黑土VG模型参数
图例4、6分别表示Rosetta模型输入4和6指标,a, b字母不同表示相同侵蚀强度不同模型参数间差异显著(P<0.05)
Fig.1 Parameters of VG model of different eroded black soils
表2 不同侵蚀强度黑土VG模型参数均值
Table 2 The mean parameters of VG model of different eroded black soils
| 侵蚀 强度 | 4指标 | 6指标 | |||||||
|---|---|---|---|---|---|---|---|---|---|
| θr(cm3/cm3) | θs(cm3/cm3) | α(1/kPa) | n | θr(cm3/cm3) | θs(cm3/cm3) | α(1/kPa) | n | ||
| 轻 | 0.08a | 0.46a | 0.12a | 1.45a | 0.09a | 0.47a | 0.26a | 1.31a | |
| 中 | 0.08a | 0.45a | 0.13a | 1.41a | 0.08a | 0.45a | 0.34a | 1.30a | |
| 重 | 0.06b | 0.39b | 0.25a | 1.52a | 0.06b | 0.39b | 0.31b | 1.37a | |
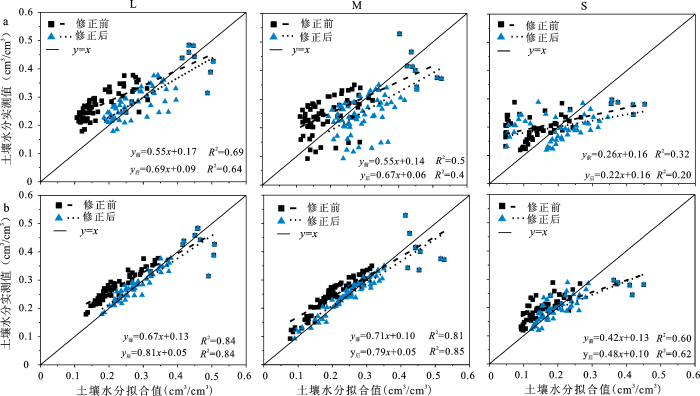
通过3种侵蚀强度,9个地块拟合后将土壤水分拟合值与实测值进行比较,结果表明:输入4指标时,轻、中、重侵蚀强度拟合与实测值回归系数分别为0.55、0.55和0.26(图2a),二者回归直线与1∶1线差异显著,相对误差大于29%,RMSE大于0.08 cm3/cm3(表3);输入6指标时,3种侵蚀强度拟合与实测值回归系数分别为0.67、0.71和0.42(图2b),3种侵蚀强度的相对误差分别较4指标降低40.50%、37.02%和31.30%,RMSE较4指标分别降低42.90%、34.78%和33.99%。
表3 参数修正前后拟合与实测之间误差分析
Table 3 The error analysis between fitting and measured of the parameters before and after correction
| 侵蚀强度 | 指标个数 | 相对误差(%) | RMSE(cm3/cm3) | 1:1线差异性 | |||||
|---|---|---|---|---|---|---|---|---|---|
| 前 | 后 | 前 | 后 | 前 | 后 | ||||
| 轻 | 4 | 33.15 | 13.13 | 0.11 | 0.05 | 显著 | 显著 | ||
| 6 | 19.72 | 5.77 | 0.06 | 0.03 | 显著 | 显著 | |||
| 中 | 4 | 29.69 | 30.34 | 0.08 | 0.08 | 显著 | 显著 | ||
| 6 | 18.70 | 7.76 | 0.06 | 0.04 | 显著 | 显著 | |||
| 重 | 4 | 37.00 | 37.66 | 0.10 | 0.09 | 显著 | 显著 | ||
| 6 | 25.42 | 15.26 | 0.06 | 0.05 | 显著 | 显著 | |||
图2 土壤水分拟合与实测回归关系
L、M、S列分别代表轻度、中度、重度侵蚀土壤,a、b行分别表示Rosetta模型输入4指标和6指标
Fig.2 The regression relations between simulation and observation data of soil moisture
2种数据输入方式结果均表明,土壤水分拟合值大于土壤水分实测值,拟合精度较低。分析VG模型公式可知,可能原因为取:m=1-1/n时造成m参数值增大,为解决这一问题,根据实测土壤水分,修正了参数m值(表4)。
表4 m与n关系修正
Table 4 The correction of relationship of m and n
| 侵蚀强度 | 修正后方程4 | 4R2 | 修正后方程6 | 6R2 | 与原关系差异性 |
|---|---|---|---|---|---|
| 轻 | m*=0.39(1.07-1/n) | 0.54 | m*=0.53(1.05-1/n) | 0.49 | 显著 |
| 中 | m*=0.73(0.89-1/n) | 0.76 | m*=0.87(0.96-1/n) | 0.75 | 显著 |
| 重 | m*=0.44(1.04-1/n) | 0.70 | m*=0.97(0.93-1/n) | 0.21 | 显著 |
参数关系修正后,输入4指标时,3种侵蚀强度土壤水分拟合与实测回归系数分别为0.69、0.67及0.22(图2a),相对误差除轻度侵蚀外,均大于30%,RMSE大于0.05 cm3/cm3(表3),拟合精度较差。而输入6指标的3种侵蚀强度土壤二者回归系数分别为0.81、0.79和0.48,与m、n关系修正前相比相对误差减小了70.75%、58.50%和39.96%,RMSE分别降低45.88%、31.90%和21.60%(表3),表明m与n关系修正后,模型拟合精度提高。
综上,模型对轻中度侵蚀黑土拟合精度较好,对砂粒含量较高的重度侵蚀黑土拟合较差。且输入6指标结果好于4指标,但计算值与实测值回归关系与1∶1线差异显著。4指标轻、中、重拟合土壤水分分别偏大约31%,33%,78%,6指标轻、中、重拟合土壤水分分别偏大约19%,21%,52%(图2),拟合土壤水分与实测值直接依然存在差异。因此,在利用Rosetta和VG模型拟合不同侵蚀强度土壤水吸力下土壤水分时,应据图2中参数校正后方程进行修正,提高土壤水分拟合精度。
参数关系修正后,用剩余6个样点数据对Rosetta模型与VG模型结合方法进行验证,即用Rosetta模型求出的参数,进行m值修正,代入VG模型得到计算值后,再用上述回归方程修正,将该修正结果与实测值比较,对模型参数进行验证(图3,表5),结果表明:4个样点的计算值与实测值无显著差异,2个样点差异显著。4指标轻中度侵蚀黑土拟合值与实测值回归斜率变化范围为0.96~1.27和1.13~1.32,6指标轻中度侵蚀黑土拟合值与实测值回归斜率变化范围为0.85~1.10和0.88~1.15。4指标计算值与实测值的相对误差,轻中度侵蚀黑土分别为6.01~9.35% 和11.22~33.11%,RMSE分别为0.02~0.04 cm3/cm3和0.05~0.06 cm3/cm3。6指标计算值与实测值的相对误差,轻中度侵蚀黑土分别为4.14%~8.10%和5.91%~26.25%,RMSE分别变化于0.02~0.03 cm3/cm3和0.02~0.05 cm3/cm3。相比于4指标,6指标拟合值与实测值之间的相对误差和RMSE更小,拟合精度更高,表明增加33 kPa和1 500 kPa土壤吸力对应土壤水分,可有效提高模型拟合精度。相比于中度侵蚀黑土,轻度侵蚀黑土相对误差及RMSE明显降低,表明轻度侵蚀黑土拟合精度更高。
表5 验证地块误差分析
Table 5 The error analysis of the verify plot
| 侵蚀强度 | 样点 | 相对误差(%) | RMSE(cm3/cm3) | 1:1线差异性 | |||||
|---|---|---|---|---|---|---|---|---|---|
| 4 | 6 | 4 | 6 | 4 | 6 | ||||
| 轻 | L-4 | 6.01 | 7.02 | 0.02 | 0.02 | 不显著 | 显著 | ||
| L-5 | 9.35 | 4.14 | 0.04 | 0.02 | 不显著 | 不显著 | |||
| L-6 | 8.36 | 8.10 | 0.03 | 0.03 | 显著 | 不显著 | |||
| L-7 | 6.78 | 4.37 | 0.02 | 0.02 | 不显著 | 显著 | |||
| 中 | M-4 | 11.22 | 5.91 | 0.05 | 0.02 | 不显著 | 显著 | ||
| M-5 | 33.11 | 26.25 | 0.06 | 0.05 | 显著 | 不显著 | |||
图3 验证地块拟合与实测水分回归分析
L、M表示轻、中度侵蚀黑土,a、b表示Rosetta模型输入4指标和6指标。
Fig.3 The regression relations between simulation and observation data of the verify plot
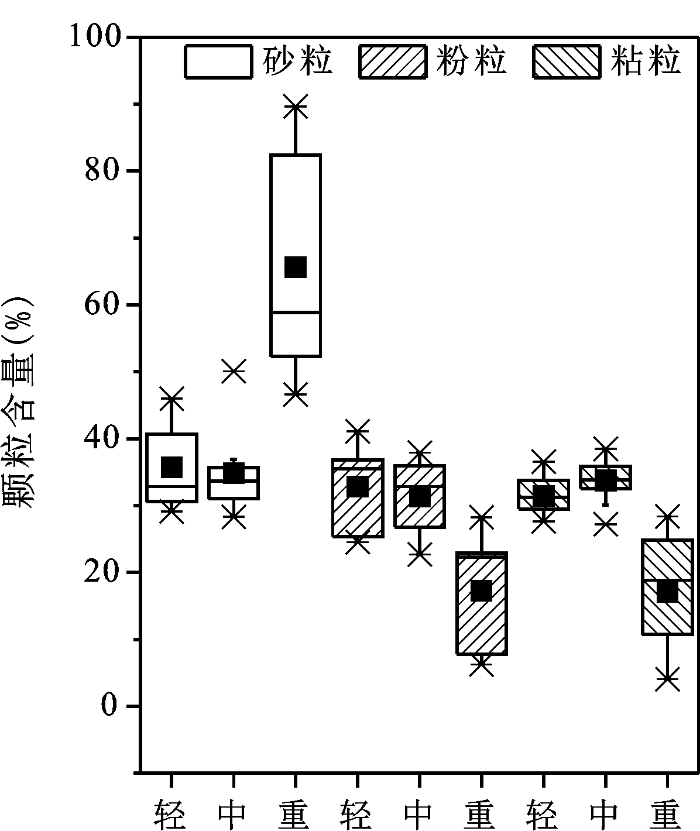
此外,进一步分析拟合样点的土壤机械组成(图4)发现,除去个别离群值外,轻、中和重度侵蚀黑土砂粒含量分别介于29.09%~46.00%之间,28.29%~36.92 %之间及46.62%~89.67%之间,粘粒含量变化分别介于27.67%~36.59%之间,30.08%~38.46%之间及4.06%~28.39%之间,重度侵蚀土壤砂粒及粘粒含量与轻中度侵蚀黑土之间存在明显界限。对于拟合精度较好的轻中度侵蚀黑土,其砂粒含量基本小于46%,粘粒含量基本大于28%。也即,Rosetta模型估算VG模型参数时,对东北黑土有以下适用范围:砂粒含量小于46%,粘粒含量大于28%。而中度侵蚀样点M-5拟合与实测值之间相对误差及RMSE均较大,相对误差大于25%,拟合精度较差。原因是:样点M-5砂粒含量过高,达55.18%,已超出Rosetta模型的适用范围,造成模型拟合效果较差。
图4 不同侵蚀强度黑土砂粒、粉粒、粘粒含量
Fig.4 The content of sand, silt and clay of the different eroded black soils
利用3种侵蚀强度黑土理化性质数据,通过Rosetta模型估计不同侵蚀强度黑土VG模型参数,修正估算参数之间的关系,并利用回归方程修正土壤拟合水分,分析Rosetta模型适用性。结果表明:
1) 无论采用4指标或6指标,轻度与中度侵蚀VG模型各参数无显著差异,但它们与重度侵蚀之间差异显著。采用4指标和6指标相比,θr和θs差异不大,但α和n差异较大,采用6指标时,α增大,而n则减小。
2) 3种侵蚀强度9个地块土壤水分拟合值与实测值比较表明:6指标的计算结果明显好于4指标,但均与实测值存在差异。进一步修正VG模型参数m与n之间关系:修正后拟合精度明显提高。拟合值与实测值回归关系与1:1线差异仍显著,4指标和6指标轻、中、重拟合土壤水分均偏大,估算模型拟合水分时,需利用土壤水分拟合与实测值回归方程进行修正。
3) 分地块验证结果表明,4个地点的计算值与实测值无显著差异,2个地点有显著差异。6指标拟合精度高于4指标,即增加33 kPa和1 500 kPa土壤吸力对应土壤水分,可提高模型拟合精度。
4) Rosetta模型对轻中度侵蚀黑土拟合精度较高,重度侵蚀黑土较低,对东北黑土有以下适用范围:砂粒含量小于46%,粘粒含量大于28%。
影响土壤水分特征曲线的主要因素是土壤的理化性质[16,17],计算不同质地土壤水分参数需同时考虑土壤黏粒含量、有机质含量和土壤团聚体[17]。本研究优点在于考虑了土壤理化性质的不同对参数的影响。结果表明无论采用4指标还是6指标轻度与中度侵蚀VG模型各参数无显著差异,但与重度侵蚀之间差异显著,此结果与姚姣转等提出的由于农田和草甸中土壤黏粒含量多,导致沙丘和农田、草甸之间的土壤水分特征曲线之间存在差异相似[18]。来剑斌等在研究中认为VG模型m与n的关系存在误差,需进行修正[19]。因此,本研究也通过修正m与n的关系,来提高模型的拟合精度。研究区主要以轻度和中度侵蚀为主,考虑试验采样工作量及当地土壤侵蚀情况,采样点设计时重度侵蚀只有3个样点。本研究认为Rosetta模型在东北黑土的适用范围为砂粒含量小于46%,粘粒含量大于28%,但中度侵蚀样点M-5砂粒含量过高,达55.18%,模型拟合效果较差。重度侵蚀地块土壤的砂粒含量高于样点M-5,已超出Rosetta模型的适用范围。因此考虑样点不足及适用范围,未对重度侵蚀样点进行验证。刘洪波等也提出VG模型对砂石占一定比重的沙壤土拟合效果不好[20]。综上所述,本研究方法得到的Rosetta模型修正后的参数在东北黑土区砂粒含量小于46%,粘粒含量大于28%的黑土应用是有效、可靠、合理的。
The authors have declared that no competing interests exist.
| [1] |
|
| [2] |
Mathematical attributes of some soil-water characteristic curve models [J].https://doi.org/10.1007/978-94-015-9775-3_3 URL [本文引用: 1] 摘要
Numerous mathematical models have been proposed in the research literature to represent soil ater characteristic curve data. A number of proposed mathematical models are summarized and the significance of each of the associated soil parameters is illustrated. The advantages and disadvantages of the various mathematical models are outlined. The derivatives for each of the model equations are presented along with comments regarding the efficiency of the best-fit regression procedures.The models using three soil parameters models proved to be superior for representing the wide range of soil suctions required in solving geotechnical problems. Regression analyses using three soil parameters were shown to be numerically more stable, converging with a reasonable number of iterations.
|
| [3] |
不同侵蚀强度黑土的土壤水分特征曲线模拟 [J].Simulation of soil-water characteristic curve for black soils with different erosion intensity . |
| [4] |
Neural network analysis for hierarchical prediction of soil water retention and saturated hydraulic conductivity [J].https://doi.org/10.2136/sssaj1998.03615995006200040001x URL [本文引用: 1] 摘要
The solution of many field-scale flow and transport problems requires estimates of unsaturated soil hydraulic properties. The objective of this study was to calibrate neural network models for prediction of water retention parameters and saturated hydraulic conductivity, K
|
| [5] |
Rosetta: a computer program for estimating soil hydraulic parameters with hierarchical pedotransfer functions [J].https://doi.org/10.1016/S0022-1694(01)00466-8 URL [本文引用: 2] |
| [6] |
Selection of a suitable model for the prediction of soil water content in north of Iran [J].https://doi.org/10.5424/sjar/2015131-6111 URL [本文引用: 2] 摘要
Multiple Linear Regression (MLR), Artificial Neural Network (ANN) and Rosetta model were employed to develop pedotransfers functions (PTFs) for soil moisture prediction using available soil properties for northern soils of Iran. The Rosetta model is based on ANN works in a hierarchical approach to predict water retention curves. For this purpose, 240 soil samples were selected from the south of Guilan province, Gilevan region, northern Iran. The data set was divided into two subsets for calibration and testing of the models. The general performance of PTFs was evaluated using coefficient of determination (R2), root mean square error (RMSE) and mean biased error between the observed and predicted values. Results showed that ANN with two hidden layers, Tan-sigmoid and linear functions for hidden and output layers respectively, performed better than the others in predicting soil moisture. In the other hand, ANN can model non-linear functions and showed to perform better than MLR. After ANN, MLR had better accuracy than Rosetta. The developed PTFs resulted in more accurate estimation at matric potentials of 100, 300, 500, 1000, 1500 kPa. Whereas, Rosetta model resulted in slightly better estimation than derived PTFs at matric potentials of 33 kPa. This research can provide the scientific basis for the study of soil hydraulic properties and be helpful for the estimation of soil water retention in other places with similar conditions, too.
|
| [7] |
两种土壤传递函数在预测砒砂岩与沙复配土的水力学参数中的应用 [J].The application of two soil pedo-transfer function to predict hydraulic parameters of soft rock and sand compound soil . |
| [8] |
Applicability of site-specific pedotransfer functions and Rosetta Model for the estimation of dynamic soil hydraulic properties under different vegetation covers [J].https://doi.org/10.1065/jss2008.03.281 URL [本文引用: 1] |
| [9] |
Modeling water retention curves of sandy soils using neural networks [J].https://doi.org/10.1029/96WR02278 URL [本文引用: 1] 摘要
We used neural networks (NNs) to model the drying water retention curve (WRC) of 204 sandy soil samples from particle-size distribution (PSD), soil organic matter content (SOM), and bulk density (BD). Neural networks can relate multiple model input data to multiple model output data without the need of an a priori model concept. In this way a high performance black-box model is created, which is very useful in a data exploration effort to assess the maximum obtainable prediction accuracy. We used a series of NN models with an increasing parametrization of input and output variables to get a better interpretability of model results. In the first two models we used the nine PSD fractions, BD, and SOM as input, while we predicted the nine points of the water retention curve. These NNs had 12 input and 9 output variables, predicting WRCs with an average root-mean-square residual (RMSR) water content of 0.020 cmcm. After a few intermediary models with increasing parametrization of PSD and WRC using (adapted) van Genuchten [1980] equations we arrived at a final NN model that used six input variables to predict three van Genuchten [1980] parameters resulting in a RMSR of 0.024 cmcm. We found saturated and residual water contents to be unrelated to the PSD, BD, or SOM, therefore the saturated water content was considered to be an independent input variable, while the residual water content was set to zero. Sensitivity analyses showed that the PSD had a major influence on the shape of the WRC, while BD and SOM were less important. On the basis of these sensitivity analyses we established more explicit equations that demonstrated similarity relations between PSD and WRC and incorporated effects of SOM and BD in an empirical way. Despite the fact that we considered a large number of linear and nonlinear variants these equations had a weaker performance (RMSR: 0.029 cmcm) than the NN models, proving the modeling power of that technique.
|
| [10] |
Artificial neural networks to estimate soil water retention from easily measurable data [J].https://doi.org/10.2136/sssaj1996.03615995006000030007x URL [本文引用: 1] 摘要
Indirect estimation of soil water retention from easily measurable data of soil surveys is needed to extend the applicability of hydrological models. Artificial neural networks (ANN) are becoming a common tool for modeling complex ''input-output'' dependencies. The objective of this work was to compare the accuracy of ANN and statistical regressions for water retention estimation from texture and bulk density. We used data on water contents at eight matric potentials for 130 Haplustoll and 100 Aquic Ustoll soil samples. Although the differences were not always statistically significant, ANN predicted water contents at selected matric potentials better than regression. The performances of ANN and regressions were comparable when van Genuchten's equation was fitted to data for each sample, and parameters of this equation were estimated from texture and bulk density. The precision of parameter estimations was lower than the precision of estimating water contents at a given soil water potential with both ANN and regressions. Grouping samples by horizons improved the precision of the estimates, especially in subsoil. Because they can mimic natural ''many inputs-many outputs'' relationships, ANN may be useful in the estimation of soil hydraulic properties from easily measurable soil data.
|
| [11] |
黑龙江省典型黑土区土壤侵蚀潜在危险度调查研究 [J].Survey and study on degrees of potential danger of soil erosion of typical chernozem in Heilongjiang Province . |
| [12] |
东北黑土区土壤侵蚀对土地生产力影响试验研究 [J].Erosion effect on the productivity of black soil in Northeast China [J]. |
| [13] |
Development of gullies and sediment production in the black soil region of northeastern China [J].https://doi.org/10.1016/j.geomorph.2008.03.008 URL [本文引用: 2] 摘要
Gully erosion is an important environmental hazard in the black soil region of northeastern China. It is a primary sediment source in the region which needs appropriate soil conservation practices. Gully incision in rolling hills typical of this region was monitored using real-time kinematic GPS to assess the rates of gully development and the resultant sediment production. From 2002 to 2005, gully heads in the study area retreated between 15.4 and 33.502m, giving an average retreat rate of 8.402m yr 61 1. Field measurements showed that total sediment production due to gully erosion during the three years ranged between 257 and 185402m 3 yr 61 1, which is equivalent to 326 to 235502t yr 61 1, with gully-head retreat accounting for 0 to 21.7% (4.4% in average). The sediment delivery ratio was especially high during the summer rainy season (56% in average). Sediment production by ephemeral gullies and permanent gullies was 1.5 times greater than that from surface erosion. Gully heads retreated faster in the spring freeze–thaw period than in the summer. The stage of gully development could be identified based on short-term changes in the gully erosion rate.
|
| [14] |
关于东北的地貌分区 [J].
:有关中国的自然区划首推李四光教授在其名著中国地质学内作了精辟的论述,对以后我国的自然区划奠定了基础。
The northeast partition on landform .
:有关中国的自然区划首推李四光教授在其名著中国地质学内作了精辟的论述,对以后我国的自然区划奠定了基础。
|
| [15] |
用MatLab确定土壤水分特征曲线参数 [J].Determination of parameters of soil water characteristic carve by MatLab . |
| [16] |
北京通州区典型农田土壤水分特征曲线测定及影响因素分析 [J].Discussion on the soil water characteristic curve of the agricultural soil in the new city of Tongzhou . |
| [17] |
北方地区植物篱系统土壤水分特征曲线模拟与分析 [J].https://doi.org/10.11686/cyxb2015299 Magsci [本文引用: 2] 摘要
以北方风沙区、黄土区、黑土区的典型植物篱为研究对象,在测定植物篱系统带内、带间部位土壤质地、土壤孔隙度、有机质含量、水稳性团聚体等指标的基础上,采用Van Genuchten模型模拟了不同地区植物篱土壤水分特征曲线。结果表明,风沙区、黑土区植物篱带内土壤孔隙度、有机质、水稳性团聚体含量均比带间高,黄土区植物篱带内土壤孔隙度、有机质、水稳性团聚体含量则比带间的低;各区域植物篱系统带内土壤含水率均比带间高,并且土壤持水力(土壤含水率)随着土壤水吸力的增大而减弱,风沙区植物篱带内、带间土壤持水力最弱,黑土区植物篱相应部位土壤持水力最高。说明植物篱具有改善土壤质地、结构,提高土壤含水率的作用,在治理坡面水土流失方面具有重要意义。
Simulation and analysis of soil water retention curves within and between hedgerows in Northern China farm systems .https://doi.org/10.11686/cyxb2015299 Magsci [本文引用: 2] 摘要
以北方风沙区、黄土区、黑土区的典型植物篱为研究对象,在测定植物篱系统带内、带间部位土壤质地、土壤孔隙度、有机质含量、水稳性团聚体等指标的基础上,采用Van Genuchten模型模拟了不同地区植物篱土壤水分特征曲线。结果表明,风沙区、黑土区植物篱带内土壤孔隙度、有机质、水稳性团聚体含量均比带间高,黄土区植物篱带内土壤孔隙度、有机质、水稳性团聚体含量则比带间的低;各区域植物篱系统带内土壤含水率均比带间高,并且土壤持水力(土壤含水率)随着土壤水吸力的增大而减弱,风沙区植物篱带内、带间土壤持水力最弱,黑土区植物篱相应部位土壤持水力最高。说明植物篱具有改善土壤质地、结构,提高土壤含水率的作用,在治理坡面水土流失方面具有重要意义。
|
| [18] |
科尔沁沙地土壤水分特征曲线传递函数的构建与评估 [J].Development and evaluation of pedo-transfer functions of soil water characteristic curves in Horqin sandy land . |
| [19] |
土壤水分特征曲线模型比较分析 [J].https://doi.org/10.3321/j.issn:1009-2242.2003.01.035 URL [本文引用: 1] 摘要
Based on the analysis of model parameters of soil water retention curve, the parameters were determined by five types of soil water retention curve data. A fitted relationship between the parameters and the soil texture was established, with which the model parameters of soil water retention curves can be predicted by the soil physical characteristic.
Comparison of soil water retention curve model .https://doi.org/10.3321/j.issn:1009-2242.2003.01.035 URL [本文引用: 1] 摘要
Based on the analysis of model parameters of soil water retention curve, the parameters were determined by five types of soil water retention curve data. A fitted relationship between the parameters and the soil texture was established, with which the model parameters of soil water retention curves can be predicted by the soil physical characteristic.
|
| [20] |
土壤水分特征曲线VG模型参数求解对比分析 [J].https://doi.org/10.3969/j.issn.1007-8614.2011.05.015 URL [本文引用: 1] 摘要
采用负压计对砂壤土试样进行了土壤水吸力和对应含水量的测量,并分别运用RETC软件和Matlab软件对不同水分处理土壤水分特征曲线VG模型进行了拟合计算,然后将拟合值与实测数据进行对比分析。结果表明,Matlab和RETC软件均可用于土壤水分特征曲线VG模型的参数求解,Matlab软件比RETC软件拟合的误差小,拟合效果明显优于RETC软件,RETC软件对极端干旱区砂石占绝对比重的砂壤土拟合效果不佳。
Contrast analysis on soil water characteristic curve of VG model parameters .https://doi.org/10.3969/j.issn.1007-8614.2011.05.015 URL [本文引用: 1] 摘要
采用负压计对砂壤土试样进行了土壤水吸力和对应含水量的测量,并分别运用RETC软件和Matlab软件对不同水分处理土壤水分特征曲线VG模型进行了拟合计算,然后将拟合值与实测数据进行对比分析。结果表明,Matlab和RETC软件均可用于土壤水分特征曲线VG模型的参数求解,Matlab软件比RETC软件拟合的误差小,拟合效果明显优于RETC软件,RETC软件对极端干旱区砂石占绝对比重的砂壤土拟合效果不佳。
|

/
| 〈 |
|
〉 |
