
中国二氧化碳净排放的时空特性分析
作者简介:于洋(1980-),女,吉林临江人,博士研究生,主要从事区域经济与可持续发展研究。E-mail:18500510@qq.com
收稿日期: 2012-12-10
要求修回日期: 2013-06-05
网络出版日期: 2013-10-20
基金资助
国家自然科学基金项目(41201157)、吉林省教育厅项目([2011]第507 号)资助
Spatial and Temporal Characteristics of Net Emission of Carbon Dioxide In China
Received date: 2012-12-10
Request revised date: 2013-06-05
Online published: 2013-10-20
Copyright
为深入研究中国二氧化碳(CO2)排放现状和发展趋势,在充分考虑各省(市、自治区)、不同年份能源转化成CO2效率差异性基础上,以扣除掉森林等对CO2吸收后的净CO2排放量作为基础数据,采用显示性比较优势理论对2005~2010年中国六大区域(华北、东北、华东、中南、西南、西北)和29个省(市、自治区)(不含港澳台及西藏和新疆)人均和单位GDP的CO2净排放空间格局和时间演变规律进行了分析。通过引入变异系数分析方法,综合比较优势理论,对2005~2010年地区和省市差异变化水平进行了研究。结果表明,华北和东北地区人均CO2净排放较高,西北、华北、东北、西南地区单位GDP的CO2净排放较高。宁夏、内蒙古属于人均CO2净排放强度区;江西等省属于低度区。省际间差异呈现“震荡”总体略呈减小态势;宁夏等省一直属于单位GDP CO2排放强度区,北京等省市一直属于低度区,2007年以后各省差异缩小。最后对中国低碳发展的未来提出了“CO2区域和省市间补偿”等建议,以期推动中国低碳经济发展水平,促进经济和环境的和谐发展。
于洋 , 陈才 . 中国二氧化碳净排放的时空特性分析[J]. 地理科学, 2013 , 33(10) : 1173 -1179 . DOI: 10.13249/j.cnki.sgs.2013.010.1173
For an in-depth research on the current situation and developmental trend of China's CO2 emissions, this article employed the revealed comparative advantage theory to carry out an analysis of the spatial framework and time-evolution regulations of net CO2 emission. The analysis focuses on the net CO2 emission per capita and unit GDP covering from 2005 and 2010 in China's six major regions (North, Northeast, East, Central South, Southwest, Northwest of China) and 29 provinces (excluding Hong Kong, Macro, Taiwan, Tibet and Xinjiang). In the calculation of CO2 emission, net CO2 emission (the absorption by the forest already deducted) were used as the basic data under the full consideration of the efficiency differentiation of energy conversion into CO2 in different provinces in different years(In this way, the obtained net CO2 emission were more accuracy).The difference in net CO2 emissions per capita and unit GDP among different regions and provinces from 2005 to 2010 were studied and the driving mechanisms for this difference are analyzed by introducing one analytical method---coefficient of variation. The results showed that the difference of per capita carbon dioxide among regions became smaller, the value for North and Northeast China were higher and the value for Southwest of China was lower. In the case of CO2 emission of unit GDP, the regional difference became more equalized. For instance, Central South and East of China displayed low amount, while Northwest, North, Northeast, Southwest of China revealed high amount, especially Northwest region showed the highest amount. The difference of per capita net CO2 emission among provinces revealed a "shock" trend, but the trend showed a slightly decreased in general. Considering the per capita CO2 emission, Ningxia and Inner Mongolia was the biggest; Jiangxi, Hainan, Yunnan, Guangxi, Anhui is comparatively smallest; and Beijing, Heilongjiang, Shanghai decreased obviously, while Shanxi, Chongqing increased sharply. The difference in net CO2 emission of per unit GDP among provinces became smaller from 2005 to 2010. Net CO2 emission of per unit GDP in Ningxia, Guizhou, Shanxi produced more, while Beijing, Tianjin, Heilongjiang, Shanghai, Jiangsu, Zhejiang, Anhui, Fujian, Jiangxi, Guangdong, Guangxi, Yunnan produced less. The trend in Jilin Province decreased, meanwhile Hainan Province increased obviously.
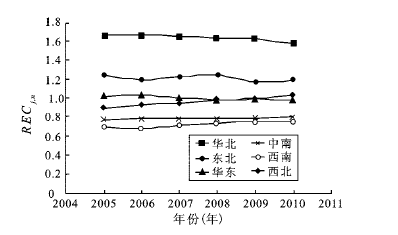
Fig.1 Revealed comparative advantage index of net CO2 emission per capita among the six regions of China图1 六大区域人均CO2净排放显示性比较优势指数 |
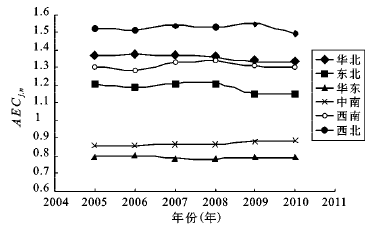
Fig.2 Revealed comparative advantage index of net CO2 emissions per unit GDP among the six regions of China图2 六大区域单位GDP的CO2净排放显示性比较优势指数 |
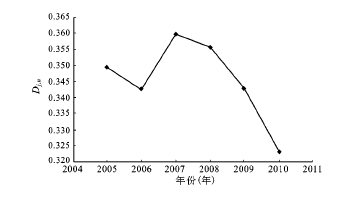
Fig.3 Variation coefficient of net CO2 emission per capita among regions of China图3 区域间人均CO2净排放排放变异系数 |
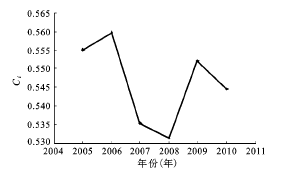
Fig.4 Changes of variation coefficient of net CO2 emission per unit GDP among regions图4 区域间单位GDP的CO2净排放变异系数的变化 |
Fig.5 Variation coefficient of per capita CO2 net emission among provinces图5 省际间人均CO2净排放变异系数的变化 |
Fig.6 Changes of variation coefficient of net CO2 emission per unit GDP among provinces图6 省际间单位GDP的CO2净排放变异系数 |
The authors have declared that no competing interests exist.
| [1] |
|
| [2] |
|
| [3] |
|
| [4] |
|
| [5] |
|
| [6] |
|
| [7] |
|
| [8] |
|
| [9] |
|
| [10] |
|
| [11] |
|
| [12] |
|
| [13] |
栾春晖. 中国科学家首次计算出每公顷森林一年吸收半吨碳[EB/OL]搜狐新闻网,2005-07-04.
|
| [14] |
|
| [15] |
国家统计局.中国统计年鉴[M].北京:中国统计出版社,2005~2010.
|
| [16] |
国家统计局工业交通统计司.中国能源统计年鉴[M].北京: 中国统计出版社,2005~2010.
|
| [17] |
|
| [18] |
|
| [19] |
|
/
| 〈 |
|
〉 |

