
长三角区域一体化背景下城乡收入格局演变研究
作者简介:宋伟轩(1981-),男,吉林敦化人,助理研究员,博士,主要从事城市社会空间研究。E-mail: songweixuan@126.
收稿日期: 2012-10-30
要求修回日期: 2013-04-05
网络出版日期: 2013-09-30
基金资助
国家自然科学基金重点项目(41130750)、中国科学院南京地理与湖泊研究所引进人才启动项目(NIGLAS2012QD09)资助
Spatial Pattern of Urban-rural Income Under the Background of Regional Integration the Changjiang River Delta
Received date: 2012-10-30
Request revised date: 2013-04-05
Online published: 2013-09-30
Copyright
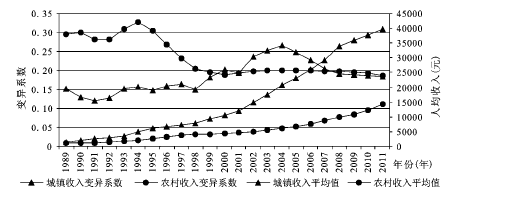
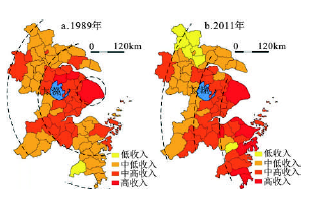
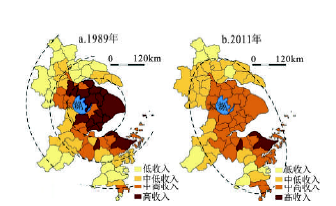
以长江三角洲地区74个县级地域单元1989~2011年城镇居民人均可支配收入、农村居民人均纯收入为资料,采用变异系数和马尔科夫链等方法分析长江三角洲地区收入格局的时空演变特征。结果表明:1989年以来,城镇收入的整体区域差异水平先升后降,农村收入区域差异则持续降低;城镇收入格局由以上海为中心的核心-边缘结构,转变为从沿海到内陆收入递减的地带式结构,一体化发展以后俱乐部增长趋同现象明显;农村收入格局渐趋均衡,高收入极化现象有所缓解,但低收入俱乐部向上移动困难;农村收入增长依托于城市,但增长速度相对落后,导致城乡差距持续拉大。
宋伟轩 , 陈雯 , 彭颖 . 长三角区域一体化背景下城乡收入格局演变研究[J]. 地理科学, 2013 , 33(9) : 1037 -1042 . DOI: 10.13249/j.cnki.sgs.2013.09.1037
Along with the constant improvement of the integrated spatial development pattern in the Changjiang River Delta, the evolution of social and economic spatial pattern has become a hot spot field in the research on the integration of the Changjiang River Delta, but the attention is paid insufficiently to the income spatial pattern which can mostly reflect the living standard of integrated region. Analyzing the income pattern and spatio-temporal evolution characteristics of this region is beneficial for measuring the integration progress of the Changjiang River Delta region scientifically and comprehensively, and can provide a reference for other integrated development regions. Based on the data of urban residents’ per capita disposable income and rural residents’ per capital net income of 74 county-level regional units in the Changjiang River Delta region in 1989-2011, and by means of coefficient variation and Markov chain, etc., this article has analyzed the spatio-temporal evolution characteristics of income pattern in the Changjiang River Delta. The result shows that, since 1989, 1) the overall regional difference of urban income has increased first and then decreased, while the regional difference of rural income has kept decreasing; 2) urban income pattern has transformed from the core-periphery structure with Shanghai as the center to the belt structure with income decreasing progressively from coastal areas to inland, and the club convergence, in terms of growth, has become obvious after integrated development; 3) rural income pattern has tended to be balanced gradually, the polarization of high income has been relieved somewhat, but it is difficult for low-income clubs to move upward; 4) rural income growth has depended on cities, but the growth rate is relatively slow, and this has resulted in the sustained enlarging of the income gap between urban and rural areas.
Fig.1 The coefficient of variation of urban-rural income in the Changjiang River Delta图1 长三角地区城乡收入变异系数曲线 |
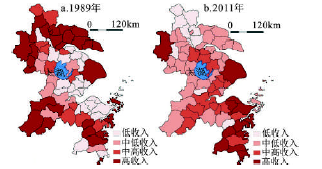
Fig.2 Evolution of urban income pattern in 1989-2011图2 1989~2011年城镇收入格局演变 |
Table 1 Markov chain matrix of urban income表1 城镇收入马尔科夫矩阵 |
| 1979~1998年 | 1998~2011年 | |||||||
|---|---|---|---|---|---|---|---|---|
| 低收入 | 中低收入 | 中高收入 | 高收入 | 低收入 | 中低收入 | 中高收入 | 高收入 | |
| 低收入 | 0.6190 | 0.3810 | 0.0000 | 0.0000 | 0.8769 | 0.1231 | 0.0000 | 0.0000 |
| 中低收入 | 0.0175 | 0.9064 | 0.0731 | 0.0029 | 0.0701 | 0.8476 | 0.0793 | 0.0030 |
| 中高收入 | 0.0037 | 0.0769 | 0.8864 | 0.0330 | 0.0000 | 0.0551 | 0.9134 | 0.0315 |
| 高收入 | 0.0000 | 0.0333 | 0.2333 | 0.7333 | 0.0000 | 0.0000 | 0.0732 | 0.9268 |
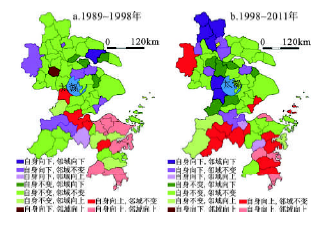
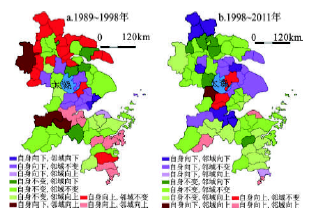
Fig.3 Spatial distribution pattern of urban residents’ income type transition图3 城镇居民收入类型转移空间分布格局 |
Fig.4 Evolution of rural income pattern in 1989-2011图4 1989~2011年农村收入格局演变 |
Table 2 Markov chain matrix of rural income表2 农村收入马尔科夫链矩阵 |
| 1989~1998年 | 1998~2011年 | |||||||
|---|---|---|---|---|---|---|---|---|
| 低 | 中低 | 中高 | 高 | 低 | 中低 | 中高 | 高 | |
| 低 | 0.8535 | 0.1465 | 0.0000 | 0.0000 | 0.9254 | 0.0747 | 0.0000 | 0.0000 |
| 中低 | 0.0341 | 0.8244 | 0.1366 | 0.0049 | 0.0315 | 0.9180 | 0.0505 | 0.0000 |
| 中高 | 0.0000 | 0.1369 | 0.7857 | 0.0774 | 0.0024 | 0.0379 | 0.9265 | 0.0332 |
| 高 | 0.0000 | 0.0000 | 0.1397 | 0.8603 | 0.0000 | 0.0000 | 0.2809 | 0.7191 |
Fig.5 Spatial distribution pattern of rural residents’ income type transition图5 农村居民收入类型转移的空间分布格局 |
Fig.6 Change in the gap between urban and rural income in 1998-2011图6 城乡收入差距水平变化(1998~2011年) |
The authors have declared that no competing interests exist.
| [1] |
世界银行. 2009年世界发展报告: 重塑世界经济地理[M]. 北京: 清华大学出版社, 2009.
|
| [2] |
|
| [3] |
|
| [4] |
|
| [5] |
|
| [6] |
|
| [7] |
|
| [8] |
|
| [9] |
|
| [10] |
|
| [11] |
|
| [12] |
上海市统计局.上海统计年鉴[J].北京:中国统计出版社,1990~2012.
|
| [13] |
江苏省统计局.江苏统计年鉴[J].北京:中国统计出版社,1990~2012.
|
| [14] |
浙江省统计局.浙江统计年鉴[J].北京:中国统计出版社,1990~2012.
|
| [15] |
|
| [16] |
|
| [17] |
|
| [18] |
|
| [19] |
|
/
| 〈 |
|
〉 |