
基于SWAT模型的大伙房水库汇水区农业非点源污染空间特性研究
作者简介:汤 洁(1957-),女,吉林长春人,博士,教授,主要从事生态环境系统理论与技术研究。E-mail:tangjie@jlu.edu.cn
收稿日期: 2011-12-25
要求修回日期: 2012-04-09
网络出版日期: 2012-10-20
基金资助
“水体污染控制与治理”科技重大专项(2009ZX07528-006-01-03)资助
Spatial Distribution of Non-point Source Pollution in Dahuofang Reservoir Catchment Based on SWAT Model
Received date: 2011-12-25
Request revised date: 2012-04-09
Online published: 2012-10-20
Copyright
应用SWAT模型对辽宁省大伙房水库汇水区农业非点源污染进行了模拟,利用2006~2009年的水文和水质监测数据对模型进行率定与验证。研究结果表明:研究区泥沙坡面产量为15.40×10⁴ t,属于微度侵蚀,其中耕地的土壤侵蚀模数最高,为475.84 t/(km2·a),疏林地次之,灌林地、有林地的土壤侵蚀模数较小;汇水区农业非点源氮、磷产生量分别为1 248.83 t和102.88 t;不同土地利用类型氮、磷的产生量差异较大,耕地远远高于林地等其他类型。总体上,流域农业非点源污染的产生量浑河流域高于苏子河流域,社河流域最小,且河流上游地区高于下游。研究结果揭示了研究区农业非点源污染空间分布特性,可以为水土保持和非点源污染防治提供基础支持。
汤洁 , 刘畅 , 杨巍 , 李昭阳 , 吴佳曦 . 基于SWAT模型的大伙房水库汇水区农业非点源污染空间特性研究[J]. 地理科学, 2012 , 32(10) : 1247 -1253 . DOI: 10.13249/j.cnki.sgs.2012.010.1247
SWAT model was used to calculate the agricultural non-point source pollution in Dahuofang reservoir catchment, Liaoning Province. The monitoring data of hydrology and water quality series from 2006 to 2009 was used to calibrate the parameters and validate the model, and the results indicated that SWAT model was appropriate for Dahuofang reservoir catchment. The calibrated model was used to reveal the spatial distribution of agricultural non-point source pollution characteristic. The results show that the annual amount of soil erosion in the reservoir catchment was 1.54×10⁵ t. In other words, there was very light soil erosion in the investigated area. The result was consistent with the actual situation of the forest coverage in this area. The various usage of lands have various degree of soil erosion. The arable lands indicated the highest soil erosion modulus, which were 475.84 t/(km2·a); the open woodlands were the second highest contributor, followed by shrub woodlands, and the soil erosion of the forests were the smallest. The slope output of both nitrogen and phosphorus in catchment were 1 248.83 t and 102.88 t, respectively. The Hun River basin ranked first in the contribution to the load of TN and TP pollution, accounted for 52.01% and 52.43%, respectively, followed by the Suzi River basin and the She River basin. The minimum contributors were the basins around the reservoir. The pollutions of nitrogen and phosphorus were various with different types of land use. The loads of TN and TP were mainly from the arable lands, which were 1 024.33 t and 93.35 t, respectively, which were much higher than the other land use types. Overall, the non-point source pollution around the Hun River basin was higher than the Suzi River′s, while the She River basin was minimum. The output intensity of non-point source pollution of the upstream region was higher than the downstream. This study indicated the spatial spread features of non-point source pollution at target areas, and the results provide a significant support to prevent both soil erosion and non-point source pollution.
Table 1 Input parameters of SWAT model and data sources表1 SWAT模型主要输入数据及来源 |
| 数据类型 | 包含参数 | 数据来源 |
|---|---|---|
| 图件 | 30m×30m的DEM数据(GRID格式) | https://wist.echo.nasa.gov |
| 2006年土地利用图(1:5万)SHAPE格式 | 购置 | |
| 土壤类型图(1:5万)SHAPE格式 | ||
| 水系图(1:25万)SHAPE格式 | 本课题组数据库系统 | |
| 气 象 | 日降水数据、日最高、最低气温、日太阳辐射量、日露点温度和日平均风速 | 中国气象科学数据共享服务网;中华人民共和国水文年鉴-辽河流域 |
| 土壤理化性质 | 土壤粒径级配百分比、土壤容重、有效含水率、土壤硝态氮、有机氮、有机磷等 | 《抚顺土壤》[15]、《辽宁土壤》[16] |
| 农作物管理措施 | 耕种、施肥、施用农药、灌溉、收割 | 现场调查、抚顺市环境保护局生态处统计资料 |
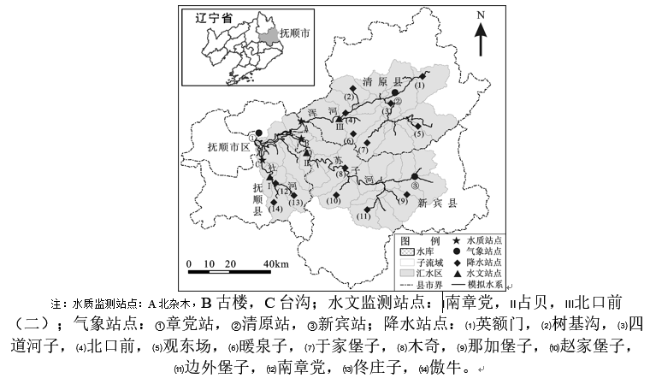
Fig.1 Geographical loacations of the study area and meteorological and hydrological stations图1 研究区地理位置及气象站点、水文站点空间分布 |
Table 2 Parameter calibration and model testing results表2 参数率定和模型验证结果 |
| 模拟时期 | 拟合项 | 实测月均值 | 模拟月均值 | Re | Ens | R2 |
|---|---|---|---|---|---|---|
| 校准期 | 径流量(m3/s) | 31.12 | 29.53 | -5.13% | 0.85 | 0.86 |
| 输沙量(t) | 5069.23 | 4756.39 | -6.17% | 0.91 | 0.92 | |
| TN负荷(t) | 181.62 | 194.16 | 6.09% | 0.66 | 0.71 | |
| TP负荷(t) | 10.02 | 11.46 | 14.37% | 0.69 | 0.68 | |
| 验证期 | 径流量(m3/s) | 21.19 | 22.63 | 6.81% | 0.84 | 0.85 |
| 输沙量(t) | 3142.23 | 3619.35 | 15.18% | 0.69 | 0.74 | |
| TN负荷(t) | 153.34 | 159.46 | 3.99% | 0.67 | 0.69 | |
| TP负荷(t) | 7.85 | 8.52 | 8.58% | 0.73 | 0.68 |
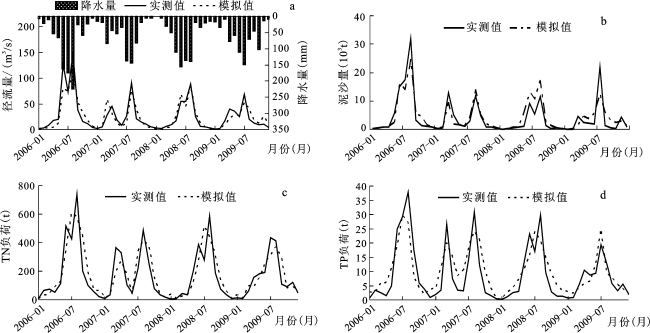
Fig.2 Simulated and observed values of monthly runoff, sediment, TN and TP in 2006-2009图2 2006~2009年逐月径流(a)、泥沙(b)、总氮(c)和总磷(d)的模拟与实测结果 |
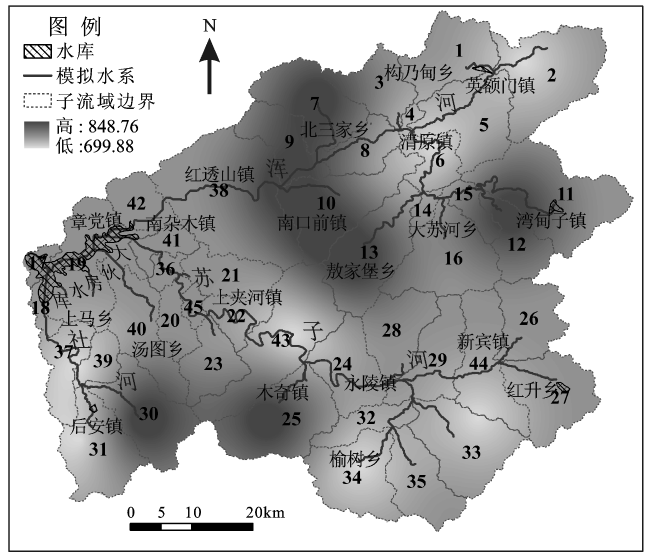
Fig.3 Annual mean rainfall spatial distribution图3 年平均降水量空间分布 (mm) |
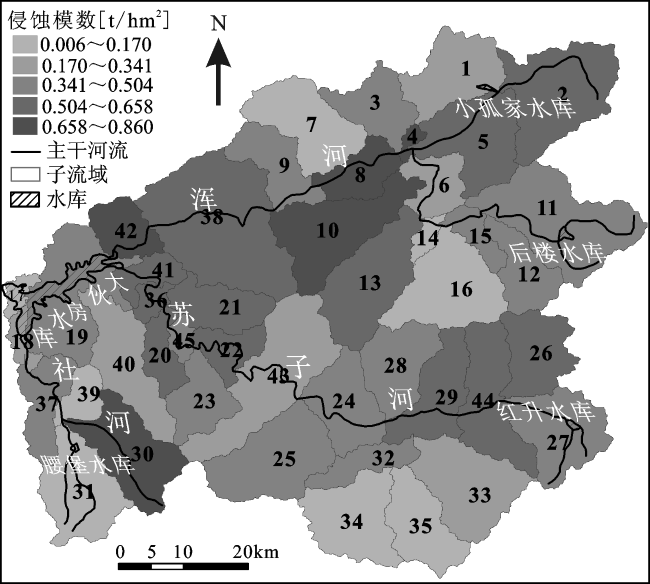
Fig.4 Annual mean sediment load spatial distribution图4 年平均泥沙负荷空间分布 |
Fig.5 Soil erosion modulus of different land uses图5 不同土地利用类型的土壤侵蚀模数 |
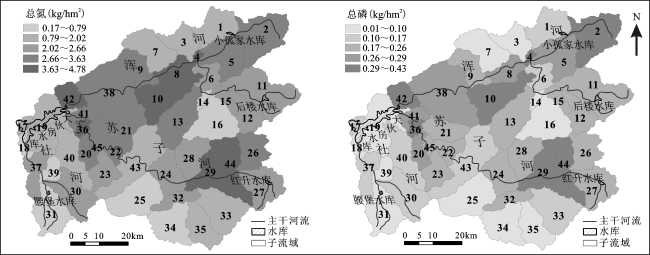
Fig.6 Average annual nitrogen and phosphorus load图6 年平均氮、磷负荷空间分布 |
The authors have declared that no competing interests exist.
| [1] |
|
| [2] |
|
| [3] |
|
| [4] |
|
| [5] |
|
| [6] |
|
| [7] |
|
| [8] |
|
| [9] |
|
| [10] |
|
| [11] |
|
| [12] |
|
| [13] |
|
| [14] |
|
| [15] |
|
| [16] |
|
| [17] |
|
| [18] |
|
| [19] |
|
| [20] |
|
| [21] |
SL 190-2007L 190-2007.土壤侵蚀分类分级标准[S].北京:中国水利水电出版社,2008.
|
/
| 〈 |
|
〉 |
