
海平面上升背景下环渤海海岸敏感性研究
作者简介:王远东(1985-),男,山东潍坊人,博士研究生,主要从事海岸带湿地与近海生态遥感研究。E-mail:ydwang@yic.ac.cn
收稿日期: 2012-11-30
要求修回日期: 2012-03-06
网络出版日期: 2013-12-20
基金资助
中国科学院战略性先导科技专项(XDA05130703)、中国科学院知识创新工程重要方向项目(KZCX2-YW-224) 中科院烟台海岸带研究所“一三五”生态突破项目(Y254021031-6)资助
Sensitivity Analysis Along the Bohai Coast Under the Background of Sea Level Rise
Received date: 2012-11-30
Request revised date: 2012-03-06
Online published: 2013-12-20
Copyright
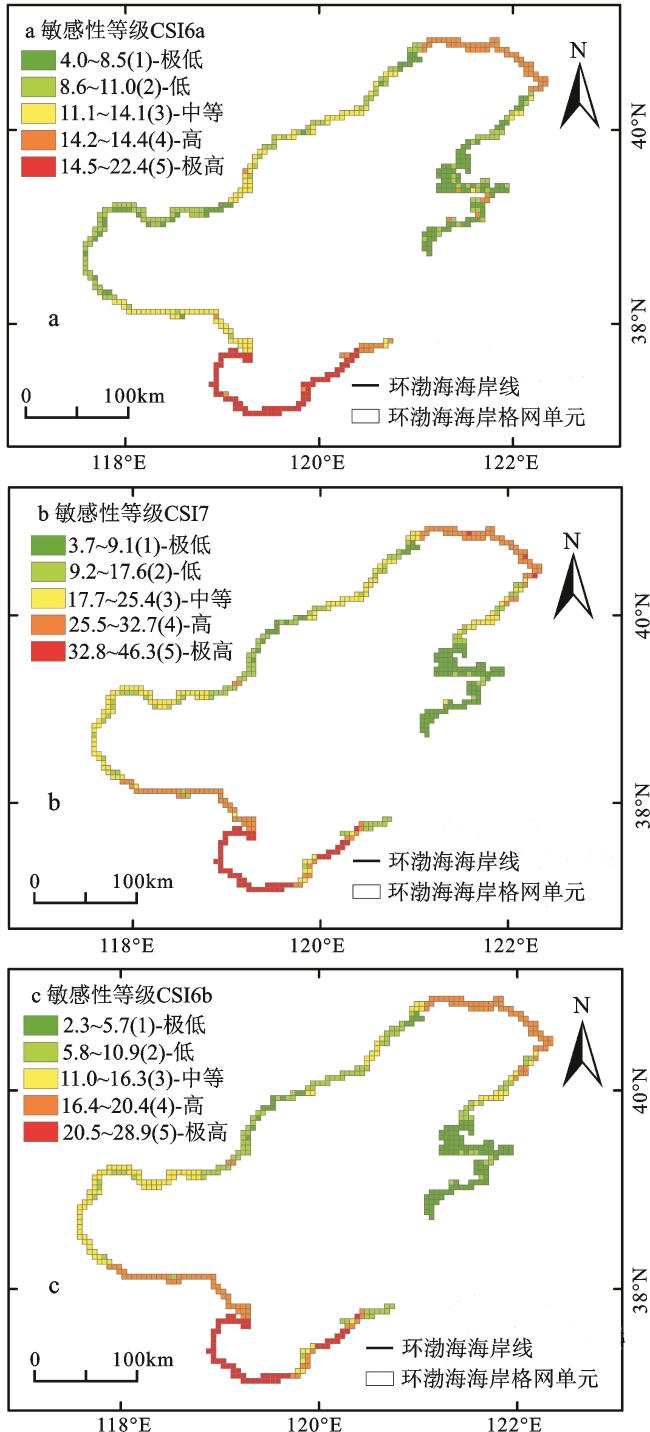
在全球气候变化、海平面上升背景下,全球许多海岸已经成为承受巨大压力的生态系统。应用海岸敏感性指数(Coastal Sensitivity Index, CSI)对中国环渤海海岸进行敏感性分析,采用岩性、海岸坡度、地貌、岸线变化速率、相对海平面上升水平、平均波高以及平均潮差多种变量的不同组合计算环渤海海岸479个单元格的敏感性数值。结果表明,增加变量数目或以岩性代替岸线变化能有效提高敏感性指数的区分能力,但不同组合下环渤海海岸敏感性宏观空间格局无较大差异。总体上,胶辽隆起带与大兴安岭-太行隆起带的山地丘陵基岩海岸敏感性相对较低,而以辽东湾辽河口附近沿岸平原海岸和渤海湾-黄河三角洲-莱州湾南岸平原海岸为代表的渤海、华北沉降带表现的敏感性相对较高。研究结果有助于海岸管理与规划人员在全球变化背景下识别海岸敏感区域,从而有选择性地采取应对措施缓解海岸带压力,并且为开展河口海岸生态系统脆弱性研究奠定科学基础。从长远来看,海岸敏感性分析如果与社会因子相结合更能有效提升海岸带系统整体的脆弱性研究水平。
王远东 , 侯西勇 , 施平 , 于良巨 . 海平面上升背景下环渤海海岸敏感性研究[J]. 地理科学, 2013 , 33(12) : 1514 -1523 . DOI: 10.13249/j.cnki.sgs.2013.012.1514
Under global climate change and sea level rise, many coastal areas have become ecosystems withstanding great pressure around the world. This article presents an analysis of sensitivity along Bohai coast using costal sensitivity index(CSI), rock type, coastal slope, geomorphology, shoreline change, sea level rise, mean wave height and mean tide range were adopted and combined to calculate sensitivity value for 479 grid cells. In this study, rock type, coastal slope, geomorphology, shoreline change representing coastal structure variables, sea level rise, mean wave height and mean tide range as coastal process variables were ranked and combined to compute CSI indexes using an equal contribution product model, and the resulted index values were presented in a form of five quarter classification. Results showed that the general relative sensitivity spatial pattern were similar to each other for the three combination methods although some places have minor differences. The lowest grid appeared at the steep rocky coast in the Changxing island of Liaodong Peninsula while the highest grid is located at the muddy plain of Yellow River Delta in the Bohai Bay. The number of discrete values was increasing and the sensitivity range was also enlarged when the variables increased or replacing rock type with shoreline change. Therefore, increasing the number of variable and replacing rock type with shoreline change could enhance the discriminate power of sensitivity index, but there were no significant changes to general relative sensitivity spatial patter. On the whole, rocky cliff coast in Jiao uplift and Daxinganling-Taihangshan uplift zone have relative low sensitivity, while plain coast along Liaodong bay and Bohai bay in Bohai, Huabei subsidence area have relative high sensitivity. This paper could not only enable coastal planner and manager to identify high sensitivity area for adopting measures to relief coastal pressure, but also provide a foundation for further vulnerability research of estuary ecosystem. If social variable are considered to be combined, the vulnerability research of coastal system could be further improved in the long run.
Key words: global change; sea level rise; coastal sensitivity; the Bohai coast
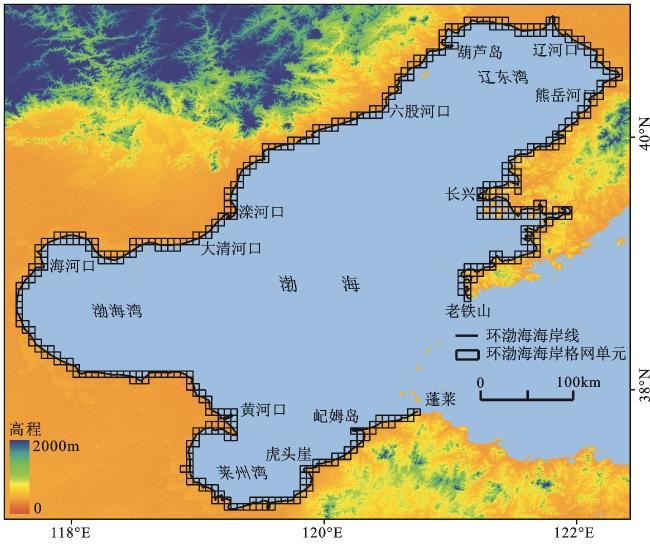
Fig.1 The location of Bohai coast图1 环渤海海岸的位置 |
Table 1 Classes of sensitivity index for Bohai coast表1 环渤海海岸敏感性指数分类 |
| 代码 | 海岸敏感性指数(CSI)分级 | |||||
|---|---|---|---|---|---|---|
| 变量名称 | 极低(1) | 低(2) | 中等(3) | 高(4) | 极高(5) | |
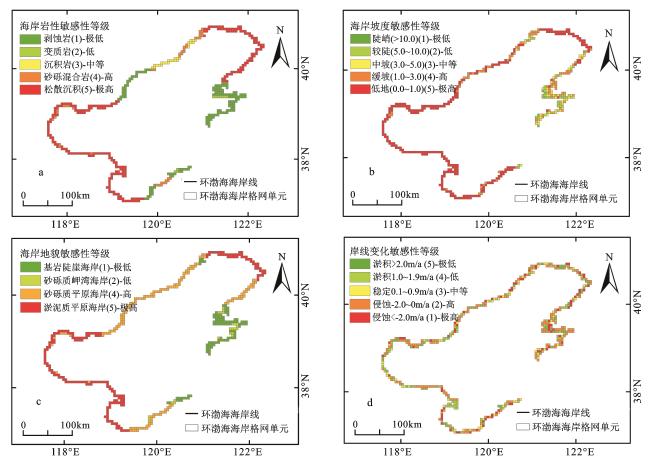
| a | 岩性 | 剥蚀岩 | 变质岩 | 沉积岩 | 砂砾混合岩 | 粘土粉砂松散沉积 |
| b | 海岸坡度(°) | 陡峭(>10.0) | 较陡(5.0~10.0) | 中等坡度(3.0~5.0) | 缓坡(1.0~3.0) | 低地(0.0~1.0) |
| c | 海岸地貌 | 基岩 陡崖海岸 | 砂砾质 岬湾海岸 | 生物海岸 | 砂砾质 平原海岸 | 淤泥质 平原海岸 |
| d | 岸线变化(m/a) | > 2.0 | 1.0~1.9 | -0.9~0.9 | -1.9~-1.0 | ≤-2.0 |
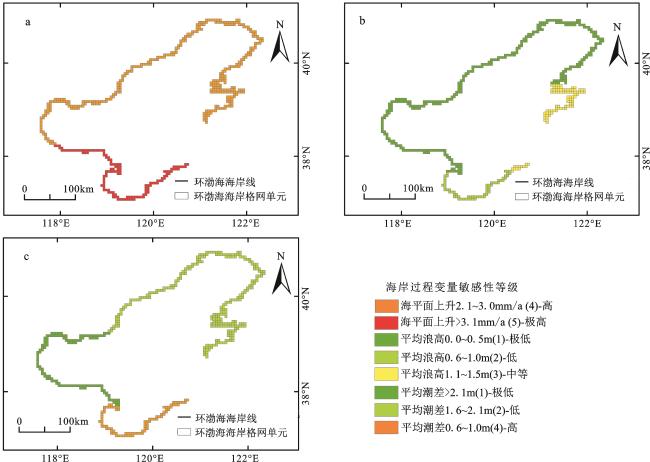
| e | 海平面上升(mm/a) | < 0.0 | 0.0~0.9 | 1.0~2.0 | 2.1~3.0 | ≥3.1 |
| f | 平均波高(m) | 0.0~0.5 | 0.6~1.0 | 1.1~1.5 | 1.6~2.0 | ≥2.1 |
| g | 平均潮差(m) | > 2.1 | 1.6~2.0 | 1.1~1.5 | 0.6~1.0 | 0.0 ~ 0.5 |
Fig.2 Relative sensitivity ranks of coastal structural variables (a) rock type (b) coastal slope (c) geomorphology (d) shoreline change图2 环渤海海岸结构变量敏感性相对等级 (a) 岩性 (b) 海岸坡度 (c) 海岸地貌 (d) 岸线变化 |
Table 2 List of Landsat TM images used in shoreline change表2 岸线变化所用Landsat TM影像列表 |
| 行列号 | 1990年时相 | 2010年时相 |
|---|---|---|
| 120032 | 19881009 | 20090715 |
| 120033 | 19900524 | 20090715 |
| 120034 | 19910831 | 20090715 |
| 121032 121033 121034 122033 | 19930827 19910923 19920824 19930615 | 20100927 20100911 20090519 20090830 |
Fig.3 Relative sensitivity ranks of coastal process variables (a) sea level rise (b) mean wave height (c) mean tidal range图3 环渤海海岸过程变量敏感性相对等级 (a) 海平面上升 (b) 平均波高 (c) 平均潮差 |
Table 3 Three iterations of sensitivity index calculation, including variables, formula and corresponding range of index表3 敏感性指数的3种不同组合示意,包括变量、 计算公式和相应的指数范围 |
| CSI6a(传统) | CSI7(全部) | CSI6b(不含 岸线变化) | |
|---|---|---|---|
| a 岩性 | √ | √ | |
| b 海岸坡度 | √ | √ | √ |
| c 海岸地貌与物质组成 | √ | √ | √ |
| d 岸线变化 | √ | √ | |
| e 海平面上升 | √ | √ | √ |
| f 平均波高 | √ | √ | √ |
| g平均潮差 | √ | √ | √ |
| 计算公式 | |||
| 指数值范围 | 4.0~22.4 | 3.7~46.3 | 2.3~28.9 |
| 离散指数值数目 | 31 | 49 | 38 |
Fig.4 Results of sensitivity index using a quartile display, different classes representing the relative sensitivity degree along Bohai coast图4 五分位数法划分3种方式得到的敏感性指数, 不同类别等级代表着环渤海沿岸相对敏感程度 |
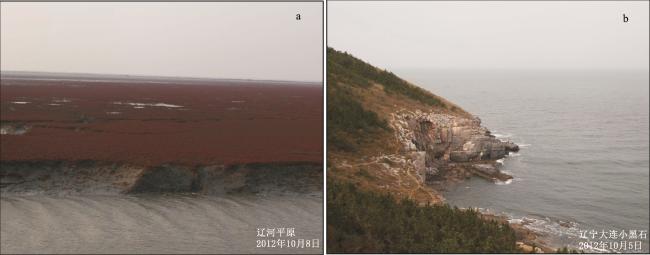
Fig.5 An example of high sensitivity coast (a) and low sensitivity coast (b) in Baohai coast |
The authors have declared that no competing interests exist.
| [1] |
|
| [2] |
|
| [3] |
|
| [4] |
|
| [5] |
|
| [6] |
|
| [7] |
Thieler E R, Hammar Klose E S. National assessment of coastal vulnerability to sea level rise: preliminary results for the U.S.Atlanta coast USGS, Open File Report (1999) [R/OL].
|
| [8] |
|
| [9] |
|
| [10] |
|
| [11] |
Pendleton E A, Thieler E R, Williams S J, et al. Coastal vulnerability assessment of Padre Island National Seashore (PAIS) to sea-level rise, USGS report No 2004-1090 [R/OL].
|
| [12] |
|
| [13] |
|
| [14] |
|
| [15] |
|
| [16] |
|
| [17] |
|
| [18] |
|
| [19] |
|
| [20] |
|
| [21] |
|
| [22] |
|
| [23] |
|
| [24] |
|
| [25] |
|
| [26] |
国家海洋局. 中国海平面公报(2011年)[R/OL].
|
| [27] |
|
/
| 〈 |
|
〉 |