
旅游景区门票价格支付意愿研究——以西溪国家湿地公园为例
作者简介:潘丽丽(1975-),女,辽宁新民人,副教授,硕导,研究方向为旅游地理、旅游规划。E-mail:panlilishenyang@163.com
收稿日期: 2014-03-27
要求修回日期: 2014-06-17
网络出版日期: 2015-04-20
基金资助
国家自然科学基金项目(41201138) 浙江省自然科学基金项目(LQ12D010022)资助
Willingness to Pay for the Tourist Areas’ Admission: A Case Study of Xixi National Wetland Park in Hangzhou
Received date: 2014-03-27
Request revised date: 2014-06-17
Online published: 2015-04-20
Copyright
潘丽丽 , 孙玉勤 . 旅游景区门票价格支付意愿研究——以西溪国家湿地公园为例[J]. 地理科学, 2015 , 35(4) : 440 -447 . DOI: 10.13249/j.cnki.sgs.2015.04.440
Tourists' willingness to pay for the tourist areas' admission is closely related to the development of the tourist areas and the tourists' travel experience. This study, a case study of Xixi National Wetland Park in Hangzhou, examines the tourists' willingness to pay for the tourist areas' admission. The willing to pay for admission is decomposed into three hierarchical indicators, which are the lowest, the best and the highest ones. Factorial analysis and regression analysis are conducted to investigate the factors influencing tourists' willingness. It is shown that the current admission fee is reasonable, which constrains the tourists’ highest willingness to pay. Meanwhile, the best admission and the lowest admission are way lower than the current admission fee. The characteristics of the admission fee, resort image recognition, facilities, value, travel motivation all influence the willingness to pay for the admission. Of all the factors, the characteristics of the admission fee and the image recognition contribute more to the willingness to pay than the other factors.
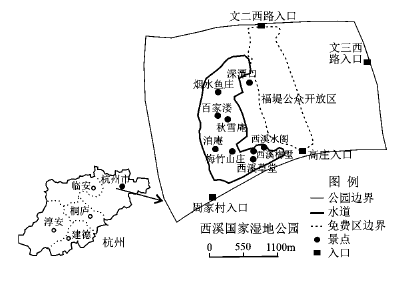
Fig. 1 Location of Xixi National Wetland Park in Hangzhou图1 杭州西溪国家湿地公园位置 |
Table 1 Ticket price satisfaction of Xixi National Wetland Park in Hangzhou表1 西溪国家湿地公园门票价格满意度调查结果 |
| 调查选项(量化分值) | 频率 | 百分比(%) | 累积百分比(%) |
|---|---|---|---|
| 非常不满意(1) | 3 | 0.7 | 0.7 |
| 不满意(2) | 11 | 2.5 | 3.2 |
| 一般(3) | 96 | 21.8 | 24.9 |
| 比较满意(4) | 281 | 63.7 | 88.7 |
| 非常满意(5) | 50 | 11.3 | 100.0 |
Table 2 Tourist’s willing to pay for admission表2 游客门票价格支付意愿 |
| 最低支付意愿 | 最佳支付意愿 | 最高支付意愿 | |
|---|---|---|---|
| 均值 | 39.51 | 49.37 | 74.42 |
| 中值 | 40 | 50 | 80 |
| 众数 | 50 | 50 | 80 |
| 众数的百分比 | 23.8% | 25.9% | 26.8% |
| 大于等于80元的百分比 | 8.3% | 15.4% | 53.5% |
| 极小值 | 0 | 0 | 0 |
| 极大值 | 150 | 180 | 200 |
Table 3 The extraction of principal components for tourist’s willing to pay表3 门票价格支付意愿影响因素主成份分析 |
| 支付意愿影响因子 | 因子载荷 | 特征值 | 方差贡献率(%) | 信度系数 | 均值 |
|---|---|---|---|---|---|
| 因子1价值标准 | 2.516 | 23.369 | 0.798 | 3.953 | |
| 体验质量 | 0.773 | ||||
| 资源特性 | 0.791 | ||||
| 景区发展 | 0.793 | ||||
| 环境特性 | 0.730 | ||||
| 因子2门票属性 | 2.449 | 11.471 | 0.779 | 3.188 | |
| 门票性价比 | 0.588 | ||||
| 门票优惠程度 | 0.850 | ||||
| 门票受惠群体 | 0.825 | ||||
| 门票购买形式 | 0.723 | ||||
| 因子3旅游动机 | 2.398 | 9.233 | 0.764 | 3.050 | |
| 考察动机 | 0.752 | ||||
| 交友动机 | 0.711 | ||||
| 学习动机 | 0.800 | ||||
| 文化动机 | 0.747 | ||||
| 因子4设施服务 | 2.315 | 8.751 | 0.750 | 3.745 | |
| 厕所设置 | 0.733 | ||||
| 休息场所设置 | 0.791 | ||||
| 景区服务 | 0.646 | ||||
| 清洁程度 | 0.703 | ||||
| 因子5形象认知 | 2.340 | 7.261 | 0.737 | 3.708 | |
| 景区定位 | 0.677 | ||||
| 景区级别 | 0.785 | ||||
| 景区口碑 | 0.714 | ||||
| 景区知名度 | 0.741 |
Table 4 The extraction of regression for tourist’s willing to pay表4 门票价格支付意愿回归分析结果 |
| 支付意愿 | 影响因子 | 非标准化系数 | 标准系数 | t | Sig. | |
|---|---|---|---|---|---|---|
| B | 标准误差 | |||||
| 最低支付(Y1) | (常量) | 39.512 | 1.051 | 37.582 | 0.000 | |
| 门票属性(x1) | 3.749 | 1.053 | 0.165 | 3.562 | 0.000 | |
| 形象认知(x2) | 3.483 | 1.053 | 0.153 | 3.309 | 0.001 | |
| 设施服务(x3) | 2.121 | 1.053 | 0.093 | 2.015 | 0.045 | |
| 最佳支付(Y2) | (常量) | 49.370 | 1.061 | 46.542 | 0.000 | |
| 门票属性(x1) | 5.174 | 1.062 | 0.224 | 4.873 | 0.000 | |
| 设施服务(x3) | 2.928 | 1.062 | 0.127 | 2.757 | 0.006 | |
| 形象认知(x2) | 2.373 | 1.062 | 0.103 | 2.235 | 0.026 | |
| 最高支付(Y3) | (常量) | 74.424 | 1.508 | 49.342 | 0.000 | |
| 门票属性(x1) | 8.894 | 1.510 | 0.269 | 5.890 | 0.000 | |
| 形象认知(x2) | 3.880 | 1.510 | 0.117 | 2.569 | 0.011 | |
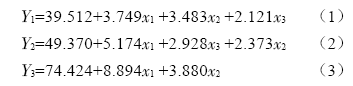
Table 5 Analysis of respondent’s demography表5 社会统计学特性影响分析 |
| 支付意愿 | 个人特征 | 单因素分析 | 相关分析 | ||
|---|---|---|---|---|---|
| F值 | 显著性 | 相关性 | 显著性 | ||
| 最低支付 | 性别 | 0.515 | 0.473 | ||
| 年龄 | 1.092 | 0.360 | |||
| 居住地 | 17.032 | 0.000 | 0.279 | 0.000 | |
| 职业 | 1.772 | 0.081 | |||
| 教育程度 | 0.247 | 0.911 | |||
| 年均收入 | 3.234 | 0.012 | 0.134 | 0.005 | |
| 最佳支付 | 性别 | 0.134 | 0.715 | ||
| 年龄 | 1.520 | 0.195 | |||
| 居住地 | 12.942 | 0.000 | 0.232 | 0.000 | |
| 职业 | 1.764 | 0.082 | |||
| 教育程度 | 0.356 | 0.840 | |||
| 年均收入 | 1.994 | 0.094 | |||
| 最高支付 | 性别 | 0.050 | 0.823 | ||
| 年龄 | 3.149 | 0.014 | -0.056 | 0.239 | |
| 居住地 | 15.789 | 0.000 | 0.230 | 0.000 | |
| 职业 | 1.182 | 0.308 | |||
| 教育程度 | 0.301 | 0.877 | |||
| 年均收入 | 1.683 | 0.153 | |||
Table 6 Difference of willingness of residents in tourist site to tourist′ pay表6 居住地对游客支付意愿影响差异分析 |
| 支付意愿 | 居住地 | 均值 | 中值 | 极小值 | 极大值 |
|---|---|---|---|---|---|
| 最低支付 | 杭州 | 32.65 | 30.00 | 0 | 100 |
| 浙江省内其他城市 | 39.74 | 40.00 | 0 | 150 | |
| 浙江省外 | 45.42 | 50.00 | 0 | 120 | |
| 最佳支付 | 杭州 | 43.02 | 40.00 | 0 | 105 |
| 浙江省内其他城市 | 54.74 | 50.00 | 10 | 180 | |
| 浙江省外 | 53.92 | 50.00 | 0 | 120 | |
| 最高支付 | 杭州 | 64.47 | 60.00 | 0 | 150 |
| 浙江省内其他城市 | 80.00 | 80.00 | 30 | 200 | |
| 浙江省外 | 82.06 | 80.00 | 0 | 200 |
The authors have declared that no competing interests exist.
| [1] |
|
| [2] |
|
| [3] |
|
| [4] |
|
| [5] |
|
| [6] |
|
| [7] |
|
| [8] |
|
| [9] |
|
| [10] |
|
| [11] |
|
| [12] |
|
| [13] |
|
| [14] |
|
| [15] |
|
| [16] |
|
| [17] |
|
| [18] |
|
| [19] |
|
| [20] |
|
| [21] |
|
| [22] |
|
| [23] |
|
| [24] |
|
| [25] |
|
| [26] |
|
| [27] |
|
| [28] |
|
| [29] |
|
| [30] |
|
| [31] |
|
| [32] |
|
| [33] |
|
| [34] |
|
| [35] |
|
| [36] |
|
| [37] |
|
| [38] |
|
| [39] |
|
| [40] |
|
| [41] |
|
| [42] |
|
/
| 〈 |
|
〉 |