
中国草原区植被变化及其对气候变化的响应
作者简介:神祥金(1987-),男,山东沂水人,博士研究生,主要从事生态气候研究。E-mail:shenxiangjin@iga.ac.cn
收稿日期: 2014-01-12
要求修回日期: 2014-03-20
网络出版日期: 2015-05-20
基金资助
国家自然科学基金(41330640)资助
Vegetation Change and Its Response to Climate Change in Grassland Region of China
Received date: 2014-01-12
Request revised date: 2014-03-20
Online published: 2015-05-20
Copyright
神祥金 , 周道玮 , 李飞 , 张海艳 . 中国草原区植被变化及其对气候变化的响应[J]. 地理科学, 2015 , 35(5) : 622 -629 . DOI: 10.13249/j.cnki.sgs.2015.05.622
This study analyzed the variation trend of vegetation NDVI and its response to climate change in grassland region of China by employing MODIS NDVI and meteorological data from1982 to 2006. Trend analysis, correlation analysis and spatial statistical analysis were carried out to investigate variation characteristics and spatial distribution pattern of vegetation NDVI, and analyze the relations between vegetation NDVI and meteorological factors. For temperate grassland region of China, growing season NDVI decreased gradually from northeast to southwest, and the grassland types from northeast to southwest are temperate meadow, temperate typical grassland and temperate desert grassland. For alpine grassland region of China, growing season NDVI was smaller overall than that of temperate grassland region, and it decreased on the whole from east to west, with the largest values concentrating in the east alpine meadow grassland. The results indicated that growing season NDVI increased on the whole in recent 25 years, but the spatial differences of seasonal changes were obvious. The largest increase of monthly NDVI occurred in August for temperate grassland region and in July for alpine grassland region. In the aspect of climate change, temperature showed obvious increase trend in the whole grassland region of China, while precipitation changes were not significant. For temperate grassland, spring temperature played an important impact on the vegetation growth of temperate typical grassland. The increase of summer precipitation could obviously promote the vegetation growth of temperate desert grassland. Monthly correlation analyses results showed that temperate grassland vegetation NDVI was significantly positively correlated with temperature in April, and May NDVI was significantly positively correlated with temperature in March and April. By contrast, the increase of June temperature could inhibit the growth of temperate grassland plants during the same period. In terms of precipitation, temperate grassland vegetation NDVI was significantly positively correlated with the previous month's precipitation (except August). April NDVI was significantly negatively correlated with precipitation in February, indicating that the low temperature in February could limit the growth of temperate grassland at the beginning of the growing season. Precipitation in June and July was significant for temperate grassland vegetation growth during the same time period, and the effect of August precipitation on vegetation growth was remarkable in September and October. For alpine grassland, spring temperature played an important impact on the vegetation growth of alpine meadow grassland and alpine typical grassland; summer and autumn temperatures had significant effect on alpine meadow grassland vegetation growth. Monthly correlation analyses results showed that monthly (April to October ) alpine grassland vegetation NDVI was significantly positively related to the air temperature during the same time period (except August), and temperature in August could affect alpine grassland vegetation growth in September. In addition, during the most vigorous growth period, alpine grassland vegetation had a time lag of 1-3 months for precipitation.
Key words: grassland region; NDVI; meteorological factors; time lag
Fig. 1 Spatial distribution and vegetation types of grassland region in China图1 中国草原植被区分布及植被类型 |
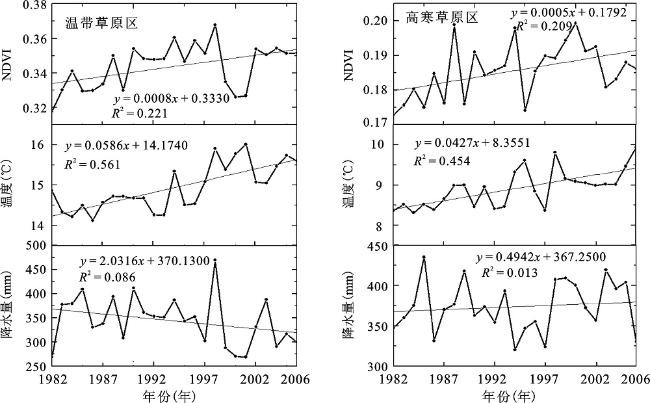
Fig.2 Changes of NDVI, temperature and precipitation in grassland region of China in growing season图2 草原区生长季NDVI、气温和降水变化 |
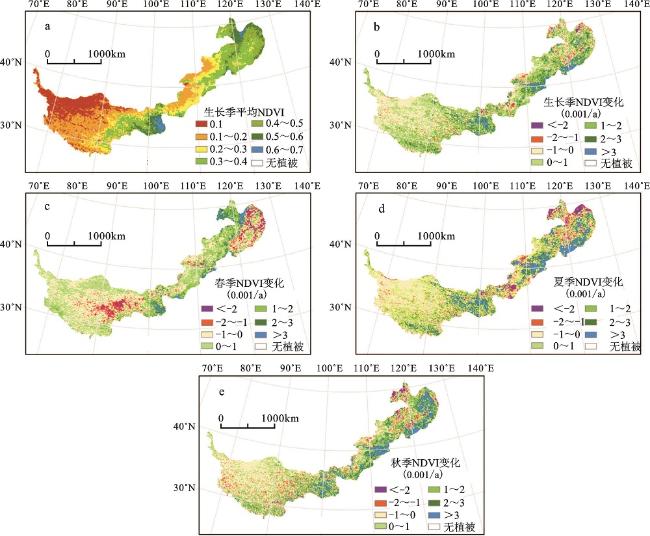
Fig.3 Spatial pattern of average NDVI in growing season and seasonal variation in grassland region of China图3 草原区植被生长季NDVI平均值及季节变化 |
Table 1 Correlation coefficient between growing season or seasonal NDVI and climate variables表1 生长季和各季节NDVI与气候因子相关系数 |
| 生长季温度 | 生长季降水 | 春季温度 | 春季降水 | 夏季温度 | 夏季降水 | 秋季温度 | 秋季降水 | |
|---|---|---|---|---|---|---|---|---|
| 温带草原 | 0.177 | 0.513** | 0.573** | 0.303 | -0.025 | 0.473* | 0.309 | 0.022 |
| 高寒草原 | 0.120 | -0.324 | 0.467* | -0.360 | 0.357 | -0.313 | 0.607** | 0.166 |
*.P<0.05; **.P<0.01 |
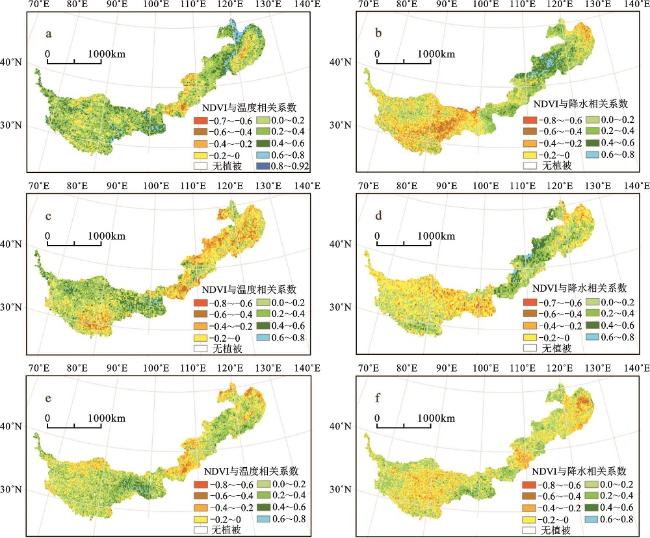
Fig.4 Spatial pattern of correlation coefficient between seasonal NDVI and temperature, precipitation in grassland region of China图4 草原区各季节NDVI与温度、降水相关系数的空间分布 |
Table 2 Correlation coefficient between NDVI and climate variables for different vegetation types表2 不同类型植被NDVI与气候因子的相关系数 |
| 生长季温度 | 生长季降水 | 春季温度 | 春季降水 | 夏季温度 | 夏季降水 | 秋季温度 | 秋季降水 | |
|---|---|---|---|---|---|---|---|---|
| 温带典型草原 | 0.052 | 0.650** | 0.644** | 0.368 | -0.157 | 0.411* | 0.282 | 0.166 |
| 温带草甸草原 | -0.070 | -0.036 | 0.286 | 0.011 | -0.140 | -0.217 | 0.069 | -0.345 |
| 温带荒漠草原 | -0.046 | 0.676** | -0.343 | 0.212 | -0.013 | 0.529** | -0.210 | 0.083 |
| 高寒典型草原 | 0.255 | -0.330 | 0.408* | 0.372 | 0.309 | -0.387 | 0.324 | -0.148 |
| 高寒草甸草原 | 0.461** | -0.180 | 0.623** | -0.335 | 0.580** | -0.301 | 0.615** | 0.331 |
*.P<0.05; **.P<0.01 |
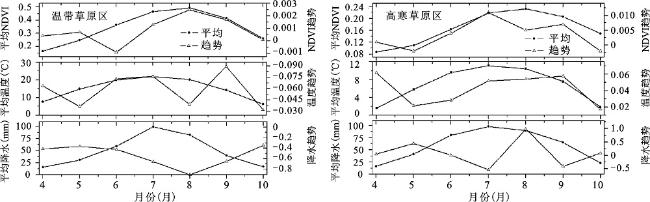
Fig.5 Changes of monthly NDVI, temperature and precipitation in grassland region of China图5 草原区植被逐月NDVI、气温和降水变化 |
Table 3 Correlation between monthly NDVI and climate variables in grassland region of China表3 草原区植被逐月NDVI与气象因子的相关性分析 |
| 温带草原区 | 4月 | 5月 | 6月 | 7月 | 8月 | 9月 | 10月 |
|---|---|---|---|---|---|---|---|
| 同期温度 | 0.423* | 0.205 | -0.454* | 0.025 | 0.013 | 0.118 | 0.239 |
| 前1个月温度 | 0.065 | 0.492* | -0.371 | -0.040 | 0.213 | -0.154 | 0.161 |
| 前2个月温度 | 0.205 | 0.517** | -0.077 | -0.078 | 0.291 | -0.007 | -0.217 |
| 前3个月温度 | 0.173 | 0.311 | -0.114 | 0.056 | 0.080 | 0.131 | -0.091 |
| 同期降水 | -0.056 | 0.141 | 0.422* | 0.490* | -0.067 | -0.133 | 0.322 |
| 前1个月降水 | -0.169 | 0.428* | 0.431* | 0.412* | 0.340 | 0.408* | 0.102 |
| 前2个月降水 | -0.448** | 0.310 | 0.162 | 0.304 | 0.169 | 0.131 | 0.485* |
| 前3个月降水 | -0.206 | -0.008 | 0.359 | 0.155 | 0.013 | -0.001 | 0.368 |
| 高寒草原区 | 4月 | 5月 | 6月 | 7月 | 8月 | 9月 | 10月 |
| 同期温度 | 0.501* | 0.493* | 0.438* | 0.466* | 0.120 | 0.524** | 0.485* |
| 前1个月温度 | 0.214 | 0.140 | 0.226 | -0.014 | 0.298 | 0.437* | 0.272 |
| 前2个月温度 | 0.212 | -0.136 | 0.240 | -0.066 | -0.319 | 0.163 | -0.168 |
| 前3个月温度 | 0.056 | -0.014 | -0.210 | 0.163 | -0.350 | -0.086 | 0.045 |
| 同期降水 | -0.317 | -0.302 | -0.058 | -0.303 | -0.324 | 0.097 | -0.297 |
| 前1个月降水 | 0.106 | -0.303 | 0.015 | 0.115 | -0.221 | 0.500* | 0.164 |
| 前2个月降水 | -0.137 | 0.204 | -0.158 | 0.494* | 0.011 | -0.078 | 0.259 |
| 前3个月降水 | 0.049 | 0.175 | -0.063 | 0.199 | 0.451* | 0.013 | -0.163 |
*.P<0.05;**.P<0.01 |
The authors have declared that no competing interests exist.
| [1] |
|
| [2] |
|
| [3] |
|
| [4] |
|
| [5] |
|
| [6] |
|
| [7] |
|
| [8] |
|
| [9] |
|
| [10] |
|
| [11] |
|
| [12] |
|
| [13] |
|
| [14] |
|
| [15] |
|
| [16] |
|
| [17] |
|
| [18] |
|
| [19] |
|
/
| 〈 |
|
〉 |
