
安徽省人口年龄结构特征及其社会经济影响研究
作者简介:汪静(1968-),女,安徽潜山人,副教授,硕士,主要从事西方经济学、旅游经济的教学与研究。E-mail: wangjing55568@126.com
收稿日期: 2016-12-29
要求修回日期: 2017-04-15
网络出版日期: 2017-11-20
Characteristics of the Age Structure of Anhui Population and Its Socio-economic Impacts
Received date: 2016-12-29
Request revised date: 2017-04-15
Online published: 2017-11-20
Copyright
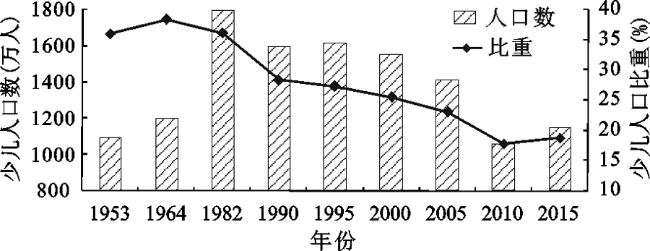
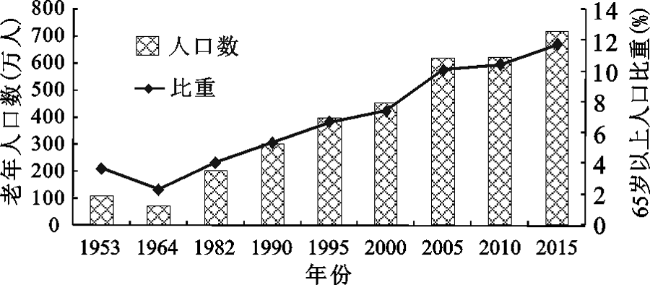
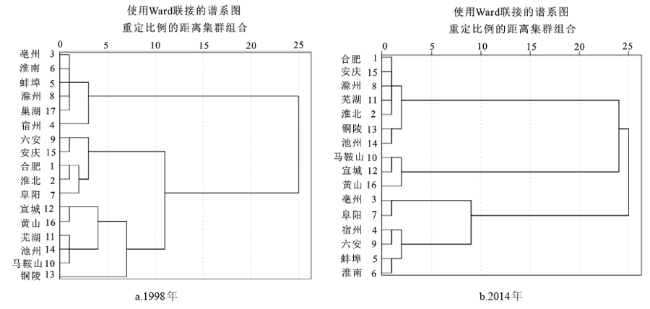
根据人口普查和抽样调查的数据资料,采用对比分析、聚类分析等研究方法分析了1953~2015年安徽省人口年龄结构时间特征、空间特征。从时间上看,安徽省人口年龄结构不断演变,少儿人口数量从不断增加转变为不断减少,劳动适龄人口比重比较稳定,人口老龄化程度不断加深,总抚养系数和少年儿童抚养系数大幅度下降,老年抚养系数上升;从空间上看,人口年龄结构存在较大地区差异。安徽省人口年龄结构对社会经济发展的影响主要表现为:① 人口老年化导致劳动生产率和经济增长速度的减缓,家庭规模小型化,并对社会养老保障和医疗卫生的挑战;② 少儿人口的不断减少影响教育资源的配置;③ 人口年龄结构的区域差异进一步加剧了安徽区域发展的不平衡性。为了尽可能地减缓人口年龄结构演变对安徽省社会经济发展的不利影响,建议采取如下措施:一是充分利用“人口红利”机遇期,加快经济发展,不断促进社会进步;二是要加强引导,因地施策;三是完善社会保障制度,努力扩大社会保障制度的覆盖面,力争全覆盖,尽量减小城乡差距;四是大力发展养老产业,探索建立满足居家养老、社区养老、机构养老等多种方式需求的政府主导、政策扶持、社会参与、市场运作的社会化养老服务体系。
汪静 . 安徽省人口年龄结构特征及其社会经济影响研究[J]. 地理科学, 2017 , 37(11) : 1728 -1735 . DOI: 10.13249/j.cnki.sgs.2017.11.015
Anhui is a province with a large population. Its age structure has an important impetus to the speed, type and trend of population development, thus affecting the social and economic development. According to the data of population census and sample survey, this paper analyzes the temporal and spatial characteristics of population age structure in Anhui Province from 1953 to 2015 by contrastive analysis and cluster analysis. From the temporal point of view, the population age structure here has been evolving. The number of children decreases compared with that of the past. The proportion of working-age population is relatively stable. The aging of the population is worsening. The total dependency coefficient and the children dependency coefficient have decreased to a large degree while the dependency coefficient of the elderly has increased. From the spatial point of view, the population age structure varies in regions. The impacts of the population age structure of Anhui Province on the social and economic development are as follows. First, the aging of population leads to the slowdown of labor productivity and economic growth, the miniaturization of family size, and the challenge of social security and health care. Second, the decreasing population of children affects the allocation of educational resources. Finally, The regional disparity of population age structure further aggravates the imbalance of Anhui regional development. In order to minimize the negative impact of the demographic age structure on the social and economic development of Anhui Province, we propose the following measures. First, the opportunity of “population dividend” period needs to be made full use of to accelerate economic development and promote social progress. Second, policies, under the guidance, are to be adopted according to regional differences. Third, the social security system needs to be improved so that its coverage can be expanded to the fullest and the gap between urban and rural areas in this aspect can be minimized. Fourth, the pension industry is to be vigorously developed and a socialized pension service system led by the government, supported by policies, participated by the society and operated in the market can be established to meet the various needs of pension at home, in communities, or in institutions.
Table 1 The age structure of Anhui Population in 1953-2015表1 1953~2015年安徽省人口年龄结构状况 |
| 年份 | 总人口 (万人) | 0~14岁人口 比重(%) | 15~64岁人口 比重(%) | 65岁以上人口 比重(%) | 老少比 (%) | 年龄中位数 (岁) | 少儿抚养 系数(%) | 老年抚养 系数(%) | 总抚养系数 (%) |
|---|---|---|---|---|---|---|---|---|---|
| 1953 | 3034 | 36.06 | 61.23 | 3.71 | 10.29 | 23.04 | 59.87 | 6.16 | 66.03 |
| 1964 | 3124 | 38.42 | 59.23 | 2.35 | 6.12 | 20.98 | 64.89 | 3.97 | 68.86 |
| 1982 | 4967 | 36.15 | 59.77 | 4.08 | 11.30 | 24.02 | 60.48 | 6.83 | 67.31 |
| 1990 | 5618 | 28.39 | 66.12 | 5.39 | 19.04 | 24.02 | 42.89 | 8.16 | 51.05 |
| 1991 | 5737 | 28.23 | 65.83 | 5.94 | 21.05 | 24.82 | 42.88 | 9.03 | 51.92 |
| 1992 | 5794 | 27.96 | 65.95 | 6.09 | 21.78 | 25.16 | 42.40 | 9.24 | 51.64 |
| 1993 | 5825 | 26.56 | 67.12 | 6.32 | 23.80 | 25.28 | 39.57 | 9.24 | 48.99 |
| 1994 | 5889 | 26.60 | 67.00 | 6.40 | 24.06 | 25.39 | 39.70 | 9.55 | 49.25 |
| 1995 | 5923 | 27.33 | 65.94 | 6.73 | 24.61 | 26.38 | 41.45 | 10.20 | 51.65 |
| 1996 | 5957 | 26.63 | 66.87 | 6.50 | 24.41 | 27.95 | 39.82 | 9.72 | 49.54 |
| 1997 | 5992 | 26.04 | 67.25 | 6.71 | 25.77 | 28.35 | 38.72 | 9.98 | 48.70 |
| 1998 | 6016 | 24.95 | 67.00 | 7.02 | 28.14 | 29.52 | 36.67 | 10.32 | 46.99 |
| 1999 | 6051 | 24.60 | 68.01 | 7.38 | 30.00 | 30.63 | 36.17 | 10.85 | 47.02 |
| 2000 | 6093 | 25.52 | 65.94 | 7.45 | 29.79 | 30.38 | 38.10 | 11.35 | 49.45 |
| 2001 | 6128 | 25.47 | 66.39 | 8.14 | 32.57 | 31.08 | 37.10 | 12.09 | 49.19 |
| 2002 | 6144 | 24.36 | 66.87 | 8.50 | 34.89 | 32.22 | 36.28 | 12.65 | 48.93 |
| 2003 | 6163 | 23.43 | 67.39 | 9.19 | 39.22 | 33.46 | 34.77 | 13.63 | 48.40 |
| 2004 | 6228 | 22.82 | 67.25 | 9.30 | 40.75 | 34.16 | 33.63 | 13.69 | 47.32 |
| 2005 | 6120 | 23.07 | 66.84 | 10.09 | 43.69 | 34.32 | 34.51 | 15.08 | 49.59 |
| 2006 | 6110 | 21.48 | 68.03 | 10.16 | 47.30 | 35.04 | 31.42 | 14.86 | 46.28 |
| 2007 | 6118 | 20.41 | 68.87 | 10.72 | 52.52 | 35.86 | 29.64 | 15.57 | 45.20 |
| 2008 | 6135 | 19.81 | 68.02 | 11.15 | 56.28 | 36.25 | 28.70 | 16.15 | 44.85 |
| 2009 | 6132 | 19.40 | 69.17 | 11.43 | 58.92 | 37.79 | 28.05 | 16.52 | 44.57 |
| 2010 | 5957 | 17.77 | 71.80 | 10.43 | 57.57 | 36.36 | 24.68 | 14.21 | 38.89 |
| 2011 | 5968 | 18.59 | 70.00 | 11.41 | 61.36 | 38.83 | 26.56 | 16.30 | 42.86 |
| 2012 | 5988 | 18.35 | 69.57 | 12.08 | 65.83 | 39.79 | 26.37 | 17.36 | 43.73 |
| 2013 | 6030 | 18.51 | 69.52 | 12.24 | 66.15 | 40.12 | 26.72 | 17.68 | 44.40 |
| 2014 | 6083 | 18.68 | 69.61 | 11.71 | 62.72 | 39.40 | 26.83 | 16.83 | 43.66 |
| 2015 | 6143 | 18.74 | 69.53 | 11.73 | 62.59 | 40.06 | 26.95 | 16.87 | 43.82 |
数据来源:1953、1964、1982、1990、2000、2010年数据为人口普查数据,其他年份为人口抽样调查数据,来源于参考文献[18]。 1.1.1 人口年龄结构不断演变 |
Fig. 1 Situation of children in Anhui Province from 1953 to 2015图1 1953~2015年安徽省少儿人口状况 |
Fig.2 Situation of the elderly in Anhui Province from 1953 to 2015图2 1953~2015年安徽省老年人口状况 |
Table 2 The Population Age Structure of Each City in Anhui from 1998 to 2014 (%)表2 1998~2014年安徽省各地市人口年龄结构状况 (%) |
| 0~14岁 人口比重 | 15~64岁 人口比重 | 65岁及以上 人口比重 | 少儿人口 抚养比 | 老年人口 抚养比 | ||||||
|---|---|---|---|---|---|---|---|---|---|---|
| 1998年 | 2014年 | 1998年 | 2014年 | 1998年 | 2014年 | 1998年 | 2014年 | 1998年 | 2014年 | |
| 合肥 | 24.84 | 15.36 | 67.99 | 73.22 | 7.17 | 11.42 | 36.53 | 20.98 | 10.54 | 15.60 |
| 淮北 | 26.05 | 16.98 | 67.14 | 72.69 | 6.81 | 10.34 | 38.80 | 23.36 | 10.14 | 14.22 |
| 亳州 | 26.51 | 25.15 | 66.14 | 64.83 | 7.35 | 10.01 | 40.08 | 38.80 | 11.11 | 15.44 |
| 宿州 | 29.13 | 21.44 | 63.17 | 66.14 | 7.70 | 12.42 | 46.11 | 32.41 | 12.19 | 18.77 |
| 蚌埠 | 26.76 | 19.94 | 65.60 | 68.25 | 7.64 | 11.81 | 40.79 | 29.21 | 11.65 | 17.30 |
| 淮南 | 25.97 | 17.60 | 66.63 | 70.44 | 7.40 | 11.96 | 38.98 | 24.99 | 11.11 | 17.05 |
| 阜阳 | 28.48 | 26.30 | 64.93 | 62.96 | 6.59 | 10.73 | 43.86 | 41.78 | 10.15 | 16.97 |
| 滁州 | 25.09 | 14.92 | 67.30 | 74.22 | 7.61 | 10.87 | 37.28 | 20.10 | 11.31 | 14.64 |
| 六安 | 24.27 | 19.81 | 69.20 | 67.53 | 6.53 | 12.66 | 35.07 | 29.34 | 9.44 | 18.75 |
| 马鞍山 | 21.61 | 13.46 | 71.70 | 72.63 | 6.69 | 13.91 | 30.14 | 18.54 | 9.33 | 19.15 |
| 芜湖 | 21.75 | 13.47 | 71.22 | 75.14 | 7.03 | 11.39 | 30.54 | 17.93 | 9.87 | 15.15 |
| 宣城 | 21.17 | 13.84 | 71.36 | 71.78 | 7.47 | 14.38 | 29.67 | 19.28 | 10.47 | 20.03 |
| 铜陵 | 20.07 | 14.60 | 73.94 | 72.97 | 5.99 | 12.43 | 27.14 | 20.01 | 8.10 | 17.04 |
| 池州 | 22.46 | 15.23 | 70.65 | 72.82 | 6.89 | 11.95 | 31.79 | 20.91 | 9.75 | 16.41 |
| 安庆 | 25.30 | 16.08 | 68.46 | 72.54 | 6.42 | 11.37 | 36.96 | 22.17 | 9.38 | 15.68 |
| 黄山 | 21.52 | 14.14 | 70.68 | 70.47 | 7.80 | 15.39 | 30.45 | 20.07 | 11.04 | 21.84 |
| 巢湖 | 25.16 | – | 66.96 | – | 7.88 | – | 37.57 | – | 11.77 | – |
数据来源:1.参考文献[18];2.“–”为无数据项,2011年拆分地级巢湖市,安徽省省辖市由原来的17个演变为16个。 |
Fig. 3 Population age structure of each city in Anhui Province in 1998 and 2014图3 安徽省各地市人口年龄结构的聚类 |
The authors have declared that no competing interests exist.
| [1] |
[
|
| [2] |
[
|
| [3] |
|
| [4] |
|
| [5] |
|
| [6] |
[
|
| [7] |
[
|
| [8] |
[
|
| [9] |
[
|
| [10] |
[
|
| [11] |
[
|
| [12] |
[
|
| [13] |
[
|
| [14] |
[
|
| [15] |
[
|
| [16] |
[
|
| [17] |
[
|
| [18] |
安徽省统计局.安徽统计年鉴 (1998~2015) [M]. 北京: 中国统计出版社,1998-2015.
[Anhui Province Bureau of Statistics. Anhui Statistical Yearbook (1998-2015). Beijing: China Statistics Press,1998-2015.]
|
| [19] |
[
|
| [20] |
[
|
| [21] |
[
|
/
| 〈 |
|
〉 |