
俄罗斯西伯利亚与远东地区城镇化发展水平测度及空间分异研究
作者简介:初楠臣(1992-),男,黑龙江佳木斯人,博士研究生,主要从事城市地理与区域发展研究。E-mail:chunanchen_1992@163.com
收稿日期: 2018-03-16
要求修回日期: 2018-05-05
网络出版日期: 2018-07-20
基金资助
国家科技基础资源调查专项课题(2017FY101303-1)、国家自然科学基金面上项目(41571152,41771179)、中国科学院重点部署项目(ZDRW-ZS-2017-4-3-4, ZDBS-SSW-SQC)资助
Measurement and Spatial Differentiation of Urbanization Development in the Siberian and Far East Federal Districts in Russia
Received date: 2018-03-16
Request revised date: 2018-05-05
Online published: 2018-07-20
Supported by
National Science and Technology Basic Project of the Ministry of Science and Technology of China (2017FY101303-1), National Natural Science Foundation of China (41571152,41771179), The Knowledge Innovation Program of Chinese Academy of Sciences (ZDRW-ZS-2017-4-3-4, ZDBS-SSW-SQC)
Copyright
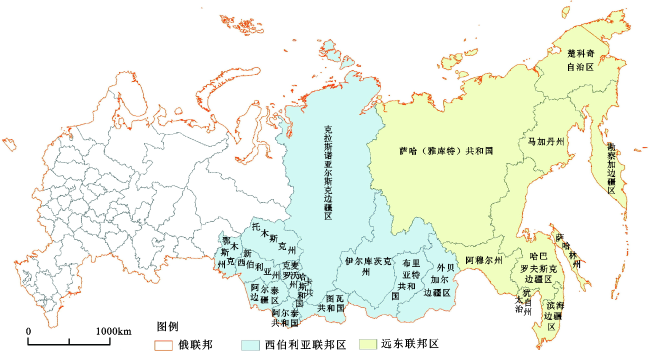
构建城镇化评价指标体系,研究俄罗斯西伯利亚与远东地区2005~2015年人口、经济、社会城镇化发展水平及空间分异。研究表明:俄罗斯西伯利亚与远东地区城镇化综合发展水平呈小幅上升,西伯利亚城镇化发展水平高于远东,两联邦区人口城镇化水平下降、经济与社会城镇化发展缓慢,多数联邦主体的城镇化发展低于平均水平;空间上,城镇化发展水平高值区集中在西伯利亚联邦区西部(鄂木斯克-新西伯利亚-阿尔泰边疆区-克麦罗沃-克拉斯诺亚尔斯克-伊尔库茨克联邦主体),低值区分布在远东联邦区东部(马加丹-楚科奇-勘察加联邦主体),西高东低格局特征显著;最后探讨了促进西伯利亚与远东人口、经济、社会城镇化发展的具体对策。
关键词: 人口城镇化; 经济城镇化; 社会城镇化; 俄罗斯西伯利亚和远东地区
初楠臣 , 张平宇 , 李鹤 , 李欣 . 俄罗斯西伯利亚与远东地区城镇化发展水平测度及空间分异研究[J]. 地理科学, 2018 , 38(7) : 1069 -1078 . DOI: 10.13249/j.cnki.sgs.2018.07.008
This paper studied the urbanization development level and its spatial differentiation of the Siberian and Far East federal districts in Russia. The paper first built an index system to evaluate the urbanization development level of Siberian and Far East federal districts. Then based on the comprehensive weighting method of entropy weight and variation coefficient, this paper calculated the urbanization development levels with regard to the population, economic and social aspects during 2005-2015. The results are as following. First, the comprehensive urbanization development level of Siberian and Far East federal districts has increased from 2005 to 2015. The urbanization development levels of the population, economic, and social aspects in Siberian federal district are all higher than those of Far East federal district. The population urbanization levels of the Siberian and Far East federal districts have decreased. Both the urbanization levels of the economic and social aspects of the two districts have been growing slowly. Second, from 2005 to 2015, the urbanization development levels of most federal subjects are lower than the average level of all the federal subjects. The urbanization development levels of Kemerovo Region, Novosibirsk Region, Altay Territory, Omsk Region, Krasnoyarsk Territory, Primorsky Territory, and Irkutsk Region are higher than the average level of all the federal subjects. Compared with other federal subjects, the urbanization development levels of Magadan Region, and Chukotka Autonomous Area are the lowest. Third, the urbanization development levels of the population, economic, and social urbanization aspects were all spatially imbalanced while taking the Siberian and Far East federal districts as a whole regional area. Spatially, the urbanization development level of the whole area shows a "High West, Low East" spatial pattern. The areas with a high urbanization development level are concentrated in the west of Siberian federal district. The areas with low ones are mostly in the eastern part of the Far East federal district. Finally, we suggested policies and strategies that can boost the growth and development of the population, economy and society of Siberian and Far East federal districts.
Fig.1 Sketch map of the study area of Siberia and Far East federal districts图1 研究区概况 |
Table 1 Urbanization indicator in the Siberia and Far East federal districts in 2015表1 2015年西伯利亚与远东联邦区城镇化相关指标 |
| 行政区 面积 (×104km2) | 人口 规模 (万人) | 城市 人口 (万人) | 人口城 镇化率(%) | 人口 密度 (人/km2) | 地区生 产总值 (亿卢布) | 人均地区 生产总值 (卢布) | 综合预算收入 (亿卢布) | 固定资本投资(亿 卢布) | 零售业贸易营业总额(亿卢布) | 人均月货币收入(卢布) | ||
|---|---|---|---|---|---|---|---|---|---|---|---|---|
| 西伯利亚联邦区 | 阿尔泰边疆区 | 16.8 | 237.67 | 133.53 | 56.18 | 14.1 | 4921.39 | 206712 | 955.09 | 918.55 | 3212.3 | 20989 |
| 阿尔泰共和国 | 9.29 | 21.52 | 6.29 | 29.23 | 2.3 | 417.77 | 194825 | 169.58 | 110.19 | 216.48 | 18267 | |
| 鄂木斯克州 | 14.11 | 197.85 | 143.18 | 72.37 | 14 | 6171.84 | 311973 | 790.29 | 971.07 | 3066.92 | 25858 | |
| 哈卡斯共和国 | 6.16 | 53.68 | 36.94 | 68.82 | 8.7 | 1716.64 | 320096 | 282.99 | 290.59 | 736.11 | 20785 | |
| 克拉斯诺亚尔斯克边疆区 | 236.68 | 286.65 | 220.6 | 76.96 | 1.2 | 16181.66 | 565272 | 2114.17 | 3944.1 | 4733.98 | 27123 | |
| 克麦罗沃州 | 9.57 | 271.76 | 233.09 | 85.77 | 28.4 | 8426.19 | 309637 | 1323.03 | 1620.59 | 3433.68 | 21845 | |
| 图瓦共和国 | 16.86 | 31.56 | 17.11 | 54.21 | 1.9 | 472.87 | 150258 | 211.58 | 127.24 | 215.81 | 15255 | |
| 托木斯克州 | 31.44 | 107.68 | 77.73 | 72.19 | 3.4 | 4736.93 | 440396 | 614.02 | 1065.14 | 1342.26 | 24860 | |
| 新西伯利亚州 | 17.78 | 276.22 | 217.48 | 78.73 | 15.5 | 9808.51 | 356087 | 1318.58 | 1565.55 | 4443.53 | 24186 | |
| 伊尔库茨克州 | 77.48 | 241.28 | 190.52 | 78.96 | 3.1 | 10135.42 | 419885 | 1290.89 | 2117.99 | 2908.45 | 22458 | |
| 布里亚特共和国 | 35.13 | 98.23 | 57.94 | 58.98 | 2.8 | 2041.56 | 208240 | 528.44 | 362.91 | 1625.61 | 25486 | |
| 外贝加尔边疆区 | 43.19 | 108.3 | 73.34 | 67.72 | 2.5 | 2488.48 | 229304 | 531.88 | 733.8 | 1469.41 | 23023 | |
| 远东联邦区 | 阿穆尔州 | 36.19 | 80.57 | 54.23 | 67.31 | 2.2 | 2768.77 | 342763 | 521.49 | 1038.9 | 1474.13 | 30232 |
| 滨海边疆区 | 16.47 | 192.9 | 148.58 | 77.02 | 11.7 | 7166.50 | 371099 | 1079.74 | 1160.68 | 3417.43 | 33018 | |
| 楚科奇自治区 | 72.15 | 5.02 | 3.47 | 69.12 | 0.1 | 639.10 | 1269344 | 280.54 | 84.43 | 60.08 | 61704 | |
| 哈巴罗夫斯克边疆区 | 78.76 | 133.45 | 109.39 | 81.97 | 1.7 | 5715.25 | 427651 | 909.25 | 1090.02 | 2715.62 | 36666 | |
| 堪察加边疆区 | 46.43 | 31.61 | 24.6 | 77.82 | 0.7 | 1719 | 542797 | 651.95 | 259.5 | 504.32 | 41102 | |
| 马加丹州 | 46.25 | 14.64 | 13.98 | 95.49 | 0.3 | 1245.97 | 846400 | 273.27 | 573.89 | 276.4 | 50262 | |
| 萨哈(雅库特)共和国 | 308.35 | 95.97 | 62.78 | 65.42 | 0.3 | 7499.87 | 782629 | 1864.73 | 1999.6 | 1884.85 | 37847 | |
| 萨哈林州 | 8.71 | 48.73 | 39.74 | 81.55 | 5.6 | 8292.99 | 1699933 | 2233.64 | 2520.55 | 1329.5 | 49654 | |
| 犹太自治州 | 3.63 | 16.61 | 11.39 | 68.57 | 4.6 | 448.73 | 268311 | 103.21 | 129.77 | 223.68 | 24459 |
Table 2 Index system and weights of urbanization表2 城镇化的评价指标体系及其权重 |
| 系统层(权重) | 指标层(单位) | 属性 | 综合权重 |
|---|---|---|---|
| 人口城镇化(0.275) | 人口规模(年终)(千人) | + | 0.073 |
| 非农人口比重(%) | + | 0.009 | |
| 人口密度(人/km2) | + | 0.119 | |
| 年平均劳动从业人数(千人) | + | 0.073 | |
| 经济城镇化(0.372) | 地区生产总值(百万卢布) | + | 0.088 |
| 非农产业产值的GDP占比(%) | + | 0.002 | |
| 固定资本投资(以实际价格计算)(百万卢布) | + | 0.090 | |
| 零售业贸易营业总额 (当前价格)(百万卢布) | + | 0.088 | |
| 综合预算收入(百万卢布) | + | 0.067 | |
| 人均每月货币收入(卢布) | + | 0.037 | |
| 社会城镇化(0.342) | 享受社会支持以支付食宿、住房和社区服务的公民人数(千人) | + | 0.082 |
| 记录在案的罪行数目(千次) | - | 0.077 | |
| 每1000人中移动无线电话连接的用户设备数量(件) | + | 0.018 | |
| 城市人均住宅房屋面积(m2) | + | 0.006 | |
| 每万人口的病床数量(个) | + | 0.009 | |
| 普通教育机构学生人数(千人) | + | 0.067 | |
| 年底公路营业里程(km) | + | 0.082 |
Table 3 Population of the major central cities of the various federal subjects in Siberian federal district in 2015表3 2015年西伯利亚联邦区的各联邦主体主要中心城市的人口数量 |
| 城市 | 人口 | 城市 | 人口 | 城市 | 人口 | |||
|---|---|---|---|---|---|---|---|---|
| 阿尔泰边疆区 | 巴尔瑙尔 | 63.56 | 布里亚特共和 国 | 乌兰乌德 | 43.05 | 哈卡斯共和国 | 阿巴坎 | 17.92 |
| 比斯克 | 20.38 | 北贝加尔斯克 | 2.4 | 切尔诺戈尔斯克 | 7.43 | |||
| 鲁布佐夫斯克 | 14.64 | 古西诺奥泽尔斯克 | 2.33 | 萨亚诺戈尔斯克 | 4.83 | |||
| 新阿尔泰斯克 | 7.31 | 恰克图 | 2 | 阿巴扎 | 1.58 | |||
| 扎林斯克 | 4.7 | 扎卡缅斯克 | 1.13 | 索尔斯克 | 1.15 | |||
| 阿尔泰共和国 | 戈尔诺-阿尔泰斯克 | 6.29 | 克拉斯诺亚尔 斯克边疆区 | 克拉斯诺亚尔斯克 | 106.69 | 克麦罗沃州 | 克麦罗沃 | 55.31 |
| 鄂木斯克州 | 鄂木斯克 | 117.81 | 诺里尔斯克 | 17.74 | 新库兹涅茨克 | 55.13 | ||
| 塔拉 | 2.8 | 阿钦斯克 | 10.54 | 普罗科皮耶夫斯克 | 19.84 | |||
| 伊西利库尔 | 2.36 | 坎斯克 | 9.1 | 梅日杜列琴斯克 | 9.87 | |||
| 卡拉钦斯克 | 2.27 | 热列兹诺戈斯克 | 8.45 | 列宁斯克-库兹涅茨基 | 9.77 | |||
| 纳济瓦耶夫斯克 | 1.13 | 米努辛斯克 | 6.83 | 基谢廖夫斯克 | 9.22 | |||
| 秋卡林斯克 | 1.05 | 泽列诺戈尔斯克 | 6.27 | 尤尔加 | 8.14 | |||
| 图瓦共和国 | 克孜勒 | 11.59 | 托木斯克州 | 托木斯克 | 56.93 | 别洛沃 | 7.34 | |
| 阿克多武拉克 | 1.37 | 谢韦尔斯克 | 10.81 | 安热罗苏真斯克 | 7.28 | |||
| 沙戈纳尔 | 1.09 | 斯特列热沃伊 | 4.2 | 伊尔库茨克州 | 伊尔库茨克 | 62.34 | ||
| 恰丹 | 0.89 | 阿西诺 | 2.46 | 布拉茨克 | 23.41 | |||
| 图兰 | 0.49 | 科尔帕舍沃 | 2.31 | 安加尔斯克 | 22.68 | |||
| 外贝加尔边 疆区 | 赤塔 | 34.35 | 新西伯利亚州 | 新西伯利亚 | 158.41 | 乌斯季伊利姆斯克 | 8.28 | |
| 克拉斯诺卡缅斯克 | 5.32 | 别尔茨克 | 10.28 | 西伯利亚乌索利耶 | 7.86 | |||
| 博尔贾 | 2.91 | 伊斯基季姆 | 5.74 | |||||
| 彼得罗夫斯克 | 1.68 | 古比雪夫 | 4.46 | |||||
| 涅尔琴斯克 | 1.48 | 巴拉宾斯克 | 2.93 |
注:数据来源于文献[12],人口单位为万人。 |
Table 4 Population of the major central cities of the various federal subjects in Far East federal district in 2015表4 2015年远东联邦区的各联邦主体主要中心城市的人口数量 |
| 城市 | 人口 | 城市 | 人口 | 城市 | 人口 | |||
|---|---|---|---|---|---|---|---|---|
| 哈巴罗夫斯克 边疆区 | 哈巴罗夫斯克 | 61.12 | 阿穆尔州 | 布拉戈维申斯克 | 22.43 | 滨海边疆区 | 符拉迪沃斯托克 | 60.67 |
| 阿穆尔河畔共青城 | 25.13 | 别洛戈尔斯克 | 6.68 | 乌苏里斯克 | 16.86 | |||
| 阿穆尔斯克 | 4.06 | 斯沃博德内 | 5.46 | 纳霍德卡 | 15.36 | |||
| 苏维埃港 | 2.51 | 滕达 | 3.35 | 阿尔乔姆 | 10.53 | |||
| 尼古拉耶夫斯克 | 1.96 | 结雅 | 2.37 | 阿尔谢尼耶夫 | 5.31 | |||
| 楚科奇自治区 | 阿纳德尔 | 1.49 | 萨哈林州 | 南萨哈林斯克 | 19.37 | 萨哈(雅库特) 共和国 | 雅库茨克 | 30.38 |
| 比利比诺 | 0.55 | 科尔萨科夫 | 3.31 | 涅留恩格里 | 5.78 | |||
| 佩韦克 | 0.47 | 霍尔姆斯克 | 2.85 | 米尔内 | 3.48 | |||
| 堪察加边疆区 | 彼得巴甫洛夫斯克 | 18.1 | 奥哈 | 2.11 | 连斯克 | 2.37 | ||
| 埃利佐沃 | 3.88 | 波罗奈斯克 | 1.52 | 阿尔丹 | 2.09 | |||
| 维柳钦斯克 | 2.18 | 多林斯克 | 1.17 | 马加丹州 | 马加丹 | 9.21 | ||
| 犹太自治州 | 比罗比詹 | 7.46 | 涅韦尔斯克 | 1.06 | 苏苏曼 | 0.49 | ||
| 奥布卢奇耶 | 0.88 |
注:数据来源于文献[12],人口单位为万人。 |
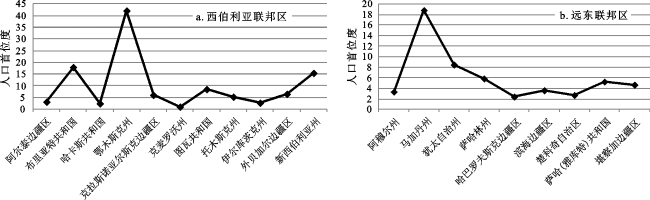
Fig.2 Population primate degree of the various federal subjects in 2015图2 2015年各联邦主体的人口首位度 |
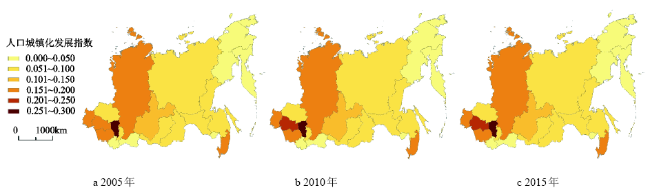
Fig.3 Spatial pattern of population urbanization of Siberian and Far East federal districts in 2005-2015图3 2005~2015年俄罗斯西伯利亚和远东地区人口城镇化空间格局变化 |
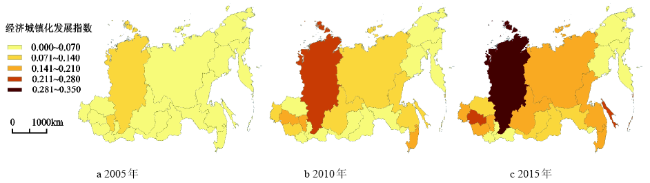
Fig.4 Spatial pattern of economic urbanization of Siberian and Far East federal districts in 2005-2015图4 2005~2015年俄罗斯西伯利亚和远东地区经济城镇化空间格局 |
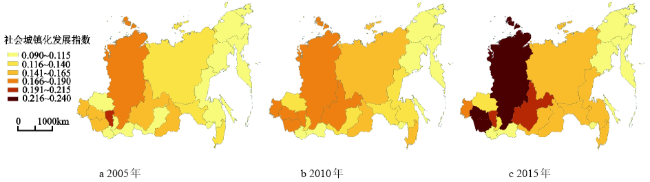
Fig.5 Spatial pattern of social urbanization of Siberian and Far East federal districts in 2005-2015图5 2005~2015年俄罗斯西伯利亚和远东地区社会城镇化空间格局 |
The authors have declared that no competing interests exist.
| [1] |
[
|
| [2] |
[
|
| [3] |
[
|
| [4] |
[
|
| [5] |
[
|
| [6] |
[
|
| [7] |
[
|
| [8] |
奥斯特洛夫斯基A B,
[
|
| [9] |
[
|
| [10] |
[
|
| [11] |
国家外汇管理局.国家外汇管理局年报2015[D].北京:国家外汇管理局, 2015.
[State Administration of Foreign Change. Annual report of the state administration of foreign exchange 2015. Beijing: State Administration of Foreign Change, 2015.]
|
| [12] |
|
| [13] |
[
|
| [14] |
|
| [15] |
|
| [16] |
[
|
| [17] |
[
|
| [18] |
[
|
| [19] |
[
|
| [20] |
[
|
| [21] |
[
|
| [22] |
[
|
| [23] |
[
|
| [24] |
[
|
| [25] |
[
|
/
| 〈 |
|
〉 |