
基于人口变化的东莞城镇增长与收缩特征和机制研究
作者简介:杜志威(1987-),男,广东广州人,博士,助理研究员,主要从事城市与区域发展和规划。E-mail: chiwai_do@foxmail.com
收稿日期: 2017-11-12
要求修回日期: 2018-01-08
网络出版日期: 2018-11-20
基金资助
国家自然科学基金项目(41571118, 41801122)、广东省科学院实施创新驱动发展能力建设专项(2016GDASRC-0101, 2018GDASCX-0901)资助
Characteristic and Mechanism of Urban Growth and Shrinkage from Demographic Change Perspective: A Case Study of Dongguan
Received date: 2017-11-12
Request revised date: 2018-01-08
Online published: 2018-11-20
Supported by
National Natural Science Foundation of China (41571118, 41801122), GDAS' Special Project of Science and Technology Development (2016GDASRC-0101, 2018GDASCX-0901)
Copyright
基于人口变化的视角,考察东莞城镇人口增长与收缩所出现的结构性变化,分析金融危机前后东莞城镇人口在规模数量、年龄结构、性别结构、学历结构,以及不同类型增长城镇与收缩城镇的产业经济和空间格局特征,并建立面板回归模型探讨影响城镇人口增长与收缩的因素和机制。研究表明,东莞总人口规模趋于波动增长的同时,人口结构呈现出外来人口市民化加快、男女性别失衡加剧、人口年轻化与高学历化的转变;增长类型城镇产业结构以先进制造业和现代服务业为主,而收缩类型城镇则面临传统加工制造业的转型升级问题;空间上呈现“北增长-南收缩”的格局,形成了中部增长、西北部和东南部收缩的城镇集中片区;而宏观经济波动、产业转型升级、科技创新投入、地方发展方式影响着东莞城镇人口的增长与收缩。
杜志威 , 李郇 . 基于人口变化的东莞城镇增长与收缩特征和机制研究[J]. 地理科学, 2018 , 38(11) : 1837 -1846 . DOI: 10.13249/j.cnki.sgs.2018.11.011
After the financial crisis in 2008, a new phenomenon “shrinkage” has appeared in Dongguan’s urban area, which manifested population size reducing in its towns. Although the economic recovery rapidly in the post-crisis period, the spatial separation of population growth and shrinkage is aggravating, accompanied by a series of changes in the demographic structure. Base on the perspective of demographic change, this article makes an in-depth analysis of the growth and shrinkage in Dongguan by using the Social Security Registration data. We summarize the characteristic of demographic changes in the size, age, gender and education after the financial crisis, and industrial economic structure of different towns. Moreover, we construct a panel regression model for exploring the factors and mechanisms that affect urban population growth and shrinkage. The result shows: 1) While the population size of Dongguan tends to growing in fluctuation, the population structure shows trends for migrant population localization, male and female more imbalance, younger and highly educated population. 2) Advanced manufacturing and modern service industries to promote city growing, and outward processing and manufacturing transformation failure will affect the city shrinking. 3) The spatial distribution shows the "growing in the north, shrinking in the south", forming a concentrated area where the central area growing, the northwest area and the southeastern area are shrinking. 4) Macroeconomic fluctuation, industrial transformation, technological innovation inputs and local development pathway have significant impacts on demographic growth and shrinkage in Dongguan.
Key words: shrinking city; demographic structure; the Pearl River Delta; Dongguan
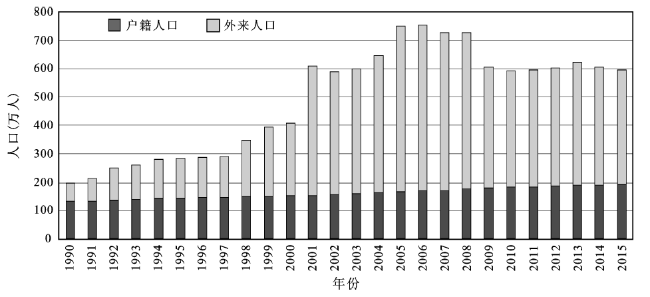
Fig.1 Demographic change of registered population and immigrant in Dongguan in 1990-2014图1 1990~2014年东莞户籍人口和外来人口数量变化 |
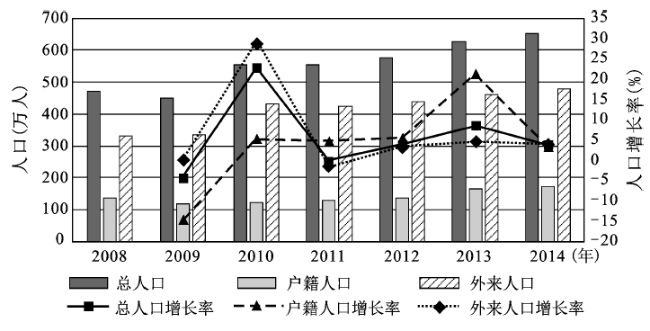
Fig.2 Demographic change of total population, registered population, immigrant in Dongguan in 2008-2014图2 2008~2014年东莞社保登记总人口、户籍人口和外来人口数量变化 |
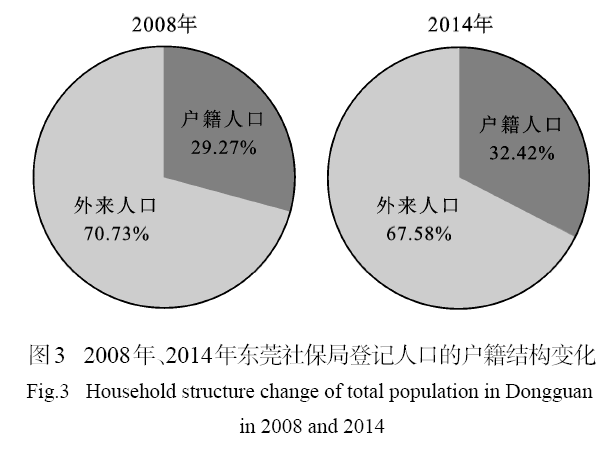
Fig.3 Household structure change of total population in Dongguan in 2008 and 2014图3 2008年、2014年东莞社保局登记人口的户籍结构变化 |
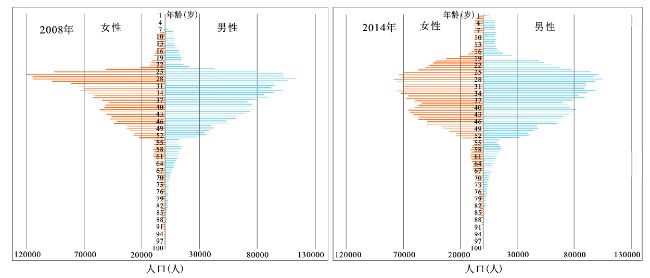
Fig.4 Age structure and gender structure change of total population in Dongguan in 2008 and 2014图4 2008年、2014年东莞社保局登记人口年龄结构与性别结构变化 |
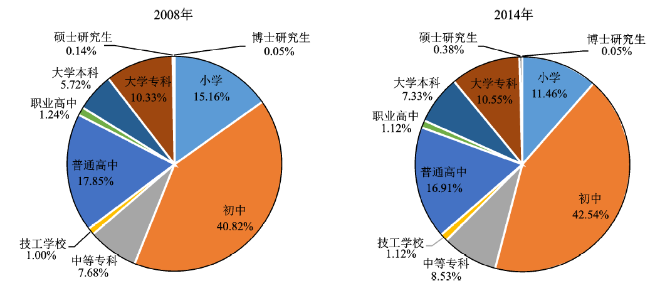
Fig.5 Educational structure change of total population in Dongguan in 2008 and 2014图5 2008年、2014年东莞社保局登记人口学历结构变化 |
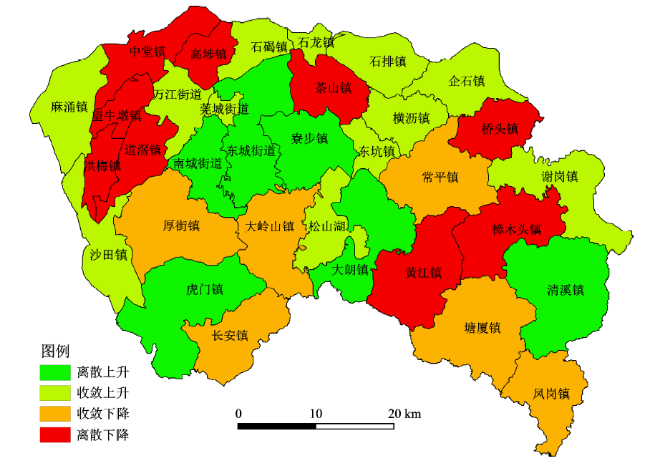
Fig.6 Spatial pattern of growing town and shrinking town in Dongguan in 2008-2014图6 2008~2014年东莞4种类型城镇的空间分布 |
Table 1 Results of stepwise regression models表1 逐步回归模型估计结果 |
| 全部城镇样本 | 增长城镇样本 | 收缩城镇样本 | |
|---|---|---|---|
| Manu | 0.619***(7.25) | 不显著 | 0.756***(11.36) |
| Serv | 0.705***(10.44) | 0.841***(8.71) | 0.356***(6.82) |
| Inves | -0.275***(-4.27) | -0.294**(-3.06) | 不显著 |
| FDI | 0.215***(5.07) | 0.484***(9.33) | 不显著 |
| Finan | -0.415***(-4.72) | -0.512***(-4.25) | 不显著 |
| RD | -0.124***(-5.53) | 不显著 | -0.115***(-6.26) |
| 常数 | 1.801**(0.58) | 5.870***(8.45) | -1.601(-4.21) |
| N | 231 | 126 | 105 |
| adj.R2 | 0.749 | 0.938 | 0.651 |
| F | 111.64 | 513.07 | 56.56 |
注:括号内数值为z值,**p< 0.05,***p< 0.01。 |
The authors have declared that no competing interests exist.
| [1] |
[
|
| [2] |
[
|
| [3] |
[
|
| [4] |
[
|
| [5] |
[
|
| [6] |
|
| [7] |
[
|
| [8] |
[
|
| [9] |
[
|
| [10] |
|
| [11] |
|
| [12] |
[
|
| [13] |
[
|
| [14] |
|
| [15] |
|
| [16] |
|
| [17] |
|
| [18] |
|
| [19] |
[
|
| [20] |
[
|
| [21] |
[
|
| [22] |
[
|
| [23] |
东莞市统计局.东莞统计年鉴2017[M]. 北京: 中国统计出版社, 2017.
[
|
| [24] |
|
| [25] |
[
|
| [26] |
[
|
| [27] |
|
| [28] |
[
|
| [29] |
|
| [30] |
[
|
| [31] |
|
| [32] |
[
|
| [33] |
[
|
| [34] |
[
|
| [35] |
[
|
/
| 〈 |
|
〉 |