
增温增湿环境下天山山区降雪量变化
作者简介:邓海军(1987-),男,湖南隆回人,博士,讲师,主要从事山区气候水文过程及流域水循环研究。E-mail: denghj@fjnu.edu.cn
收稿日期: 2017-11-20
要求修回日期: 2018-03-12
网络出版日期: 2018-11-20
基金资助
国家自然科学基金项目 (41807159)资助
Changes of Snowfall Under Warmer and Wetter in the Tianshan Mountains
Received date: 2017-11-20
Request revised date: 2018-03-12
Online published: 2018-11-20
Supported by
National Natural Science Foundation of China(41807159)
Copyright
基于APHRO’s气温和降水数据集,运用气温阈值模型,分析了1961~2015年间天山山区降雪量变化特征。研究表明,自1961年以来,天山山区升温趋势显著,速率为0.027℃/a,且冬半年的升温速度大于夏半年。同时,3 000 m海拔以上区域的平均气温上升到0℃左右。冬季降水的增加速率为0.42 mm/a(P<0.01),春季和夏季的降水量呈减少趋势。降雪量变化时空差异显著,3 000 m海拔以上区域降雪随气温的升高而增加,而3 000 m以下区域降雪随气温的升高而减少。最大降雪量气温是控制降雪变化的关键因子,当平均气温低于最大降雪量气温时,随气温升高降雪量呈增加趋势;当平均气温高于最大降雪量气温时,随气温升高降雪量呈减少趋势。
邓海军 , 陈亚宁 , 陈忠升 . 增温增湿环境下天山山区降雪量变化[J]. 地理科学, 2018 , 38(11) : 1933 -1942 . DOI: 10.13249/j.cnki.sgs.2018.11.021
Snow as a land-cover type that is mainly distributed at the high latitude and high altitude regions. Snowfall, as are main precipitation type in mountainous areas, presents significant temporal and spatial difference which was affected by climate change. In this study, based on APHRO’s dataset and temperature threshold model to analyze snowfall changes in the Tianshan Mountains during 1961-2015. Results indicated that: 1) Temperature showed increasing trend in the Tianshan Mountains since 1961, with a rate of 0.027℃/a. And temperature increase rate in winter was higher than that in summer. Meanwhile, the average air temperature of elevation above 3 000 m is rise to around 0℃ during 1961-2015. 2) Precipitation exhibited significant increasing with a rate of 0.42 mm/a (P<0.01) in winter, while decrease in spring and summer. 3) Snowfall changes were characterized by temporal and spatial variations. Snowfall presented positive relationship with air temperature in the regions with elevation over 3 000 m, while negative relationship in regions with elevation below 3 000 m. 4) Maximum snowfall temperature is a key factor to understanding changes of snowfall under warming. When mean temperature is below/above maximum snowfall temperature, snowfall usually increases/decreases with increased warming. Therefore, study on the snowfall variations in mountainous areas can be very helpful to understand the effects of climate change on hydrology process in mountainous areas.
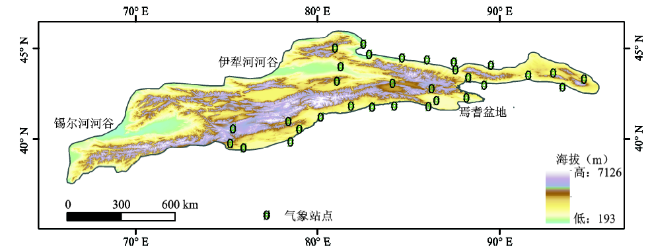
Fig.1 Location of study area图1 研究区位置 |
Table 1 The evaluation results of daily scale datasets between APHRO’s and ERA-Interim表1 评估日尺度的APHRO’s 数据和ERA-Interim数据 |
变量 | 格点 | 区域 | ||||||
|---|---|---|---|---|---|---|---|---|
| RMSE | 格点数 | MAPD | 格点数 | R2 | RMSE | MAPD | ||
| 气温 | < 2℃ | 1064/1276 | < 0.25 | 775/1276 | 0.99 | 1.35 | 0.29 | |
| 降水量 | < 3 mm | 684/1276 | < 1.3 | 831/1276 | 0.57 | 3.28 | 1.29 | |
注:整个研究区域的格点数为1 276,RMSE为均方根误差,MAPD为均方根绝对误差。 |
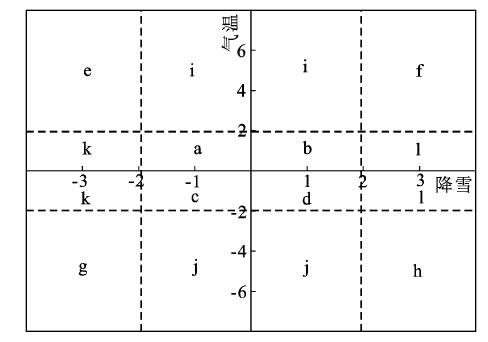
Fig.2 Cross-Quadrant diagram plotting图2 气温和降雪变化的交叉象限图 |
Table 2 The trends of air temperature in Tianshan Mountains during 1961-2015表2 1961~2015年天山山区气温变化趋势 |
| 平均值±标准差(℃) | 趋势(℃/a) | Z值 | 显著性 | |
|---|---|---|---|---|
| 年均 | 4.53±0.78 | 0.027 | 4.18 | *** |
| 冬季 | -10.6±1.53 | 0.034 | 2.52 | ** |
| 春季 | 5.43±1.16 | 0.032 | 2.91 | *** |
| 夏季 | 16.27±0.59 | 0.019 | 3.37 | *** |
| 秋季 | 4.32±0.98 | 0.023 | 2.97 | *** |
注:**、***分别表示在0.05和0.01水平上显著。 |
Table 3 The trends of precipitation in the Tianshan Mountains during 1961-2015表3 1961~2015年天山山区降水变化趋势 |
| 平均值±标准差(mm) | 趋势(mm/a) | Z值 | 显著性 | |
|---|---|---|---|---|
| 年均 | 278.7±42.9 | 0.13 | 0.69 | - |
| 冬季 | 40.29±11.57 | 0.42 | 4.28 | *** |
| 春季 | 86.4±20.3 | -0.35 | -1.67 | * |
| 夏季 | 79.6±17.8 | -0.12 | -0.81 | - |
| 秋季 | 51.6±14.8 | 0.24 | 1.77 | * |
注:*、***分别表示在0.1和0.01水平上显著;“-”表示不显著。 |
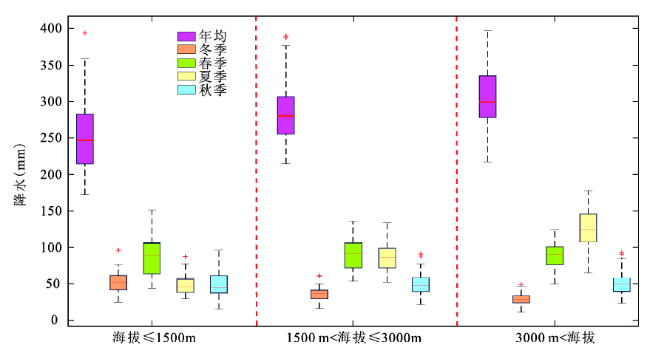
Fig.3 The characteristics analysis of precipitation in different elevation bands图3 不同海拔区域的降水特征分析 |
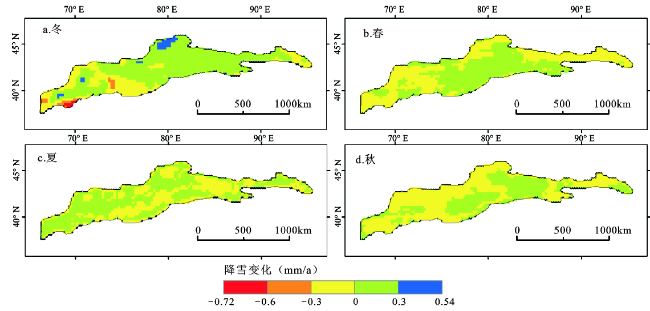
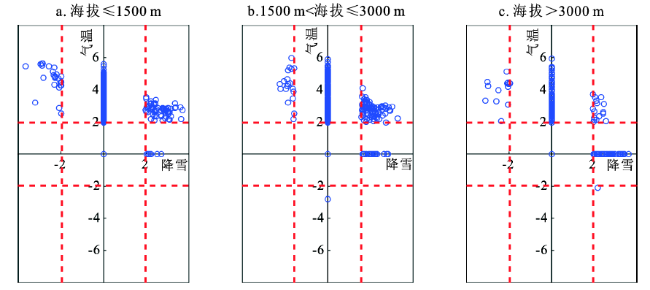
Fig.4 The trends of snowfall in the Tianshan Mountains during 1961-2015图4 1961~2015年天山山区降雪量的空间变化趋势 |
Fig.5 The trends of snowfall in different elevation bands in the Tianshan Mountains during 1961-2015图5 1961~2015年天山山区不同海拔高度带的降雪变化 |
Table 4 The trends of air temperature and snowfall in different elevation bands in the Tianshan Mountains during 1961-2015表 4 1961~2015年天山山区不同海拔高度带的气温和降雪变化不同对应情况 |
| 高度带 | a+b+c+d | e | f | g | h | i | j | k | l |
|---|---|---|---|---|---|---|---|---|---|
| A | 25 | 26 | 62 | 0 | 0 | 304 | 0 | 0 | 6 |
| B | 113 | 19 | 88 | 0 | 0 | 310 | 1 | 0 | 23 |
| C | 74 | 13 | 16 | 0 | 1 | 141 | 0 | 0 | 54 |
注:A:海拔≤1 500 m;B:1 500 m<海拔≤3 000 m; C: 海拔>3 000 m;总格点数为1 276个。 |
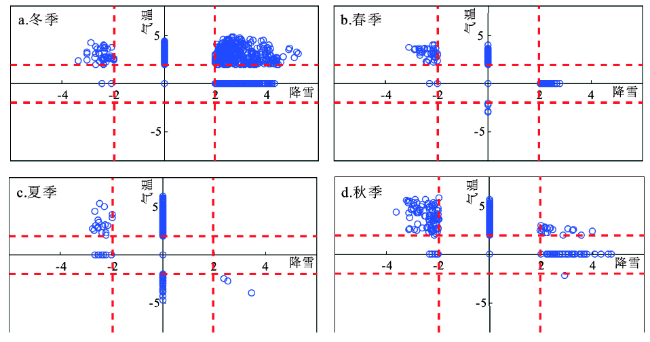
Fig.6 The trends of snowfall in different seasons in the Tianshan Mountains during 1961-2015图6 1961~2015年天山山区降雪季节变化 |
Table 5 The trend of seasonal temperature and snowfall in the Tianshan Mountains during 1961-2015表5 1961~2015年天山山区不同季节的气温和降雪变化不同对应情况分析 |
| 高度带 | a+b+c+d | e | f | g | h | i | j | k | l |
|---|---|---|---|---|---|---|---|---|---|
| 冬季 | 149 | 40 | 368 | 0 | 0 | 583 | 0 | 2 | 134 |
| 春季 | 987 | 36 | 0 | 0 | 0 | 219 | 4 | 3 | 27 |
| 夏季 | 608 | 18 | 0 | 0 | 3 | 610 | 28 | 9 | 0 |
| 秋季 | 239 | 91 | 18 | 0 | 1 | 882 | 0 | 5 | 40 |
Table 6 The study on snowfall changes in the High Asia Regions表6 高亚洲区域降雪变化研究 |
| 区域 | 研究方法 | 时间序列 | 数据源 | 主要结论 | 文献来源 |
|---|---|---|---|---|---|
| 天山 | 双阈值气温模型 | 1961~2015年 | 格点数据 | 冬季呈增加趋势;高海拔区域呈增加趋势 | 本文 |
| 将雨雪混合全部归为降雪 | 1961~2010年 | 站点数据 | 降雪呈增加趋势;雪雨比呈减少趋势 | [28] | |
| 频率求交法和概率保证法 | 1950s~2014年 | 站点数据 | 雪雨比的变化范围为 0.02~1.79,随着海拔 的升高而增大 | [40] | |
| 青藏高原 | 双阈值气温模型 | 1961~2014年 | 站点数据 | 最大降雪量气温是控制降雪变化的关键因子 | [16] |
| 双阈值气温模型 | 1961~2014年 | 站点数据 | 降雪变化与下垫面性质密切相关 | [41,42] |
The authors have declared that no competing interests exist.
| [1] |
|
| [2] |
|
| [3] |
|
| [4] |
|
| [5] |
[
|
| [6] |
|
| [7] |
|
| [8] |
|
| [9] |
|
| [10] |
|
| [11] |
|
| [12] |
|
| [13] |
|
| [14] |
|
| [15] |
|
| [16] |
|
| [17] |
|
| [18] |
[
|
| [19] |
|
| [20] |
|
| [21] |
[
|
| [22] |
[
|
| [23] |
|
| [24] |
[
|
| [25] |
[
|
| [26] |
[
|
| [27] |
[
|
| [28] |
|
| [29] |
[
|
| [30] |
|
| [31] |
|
| [32] |
|
| [33] |
[
|
| [34] |
|
| [35] |
|
| [36] |
|
| [37] |
|
| [38] |
|
| [39] |
|
| [40] |
[
|
| [41] |
|
| [42] |
|
/
| 〈 |
|
〉 |