
不同犯罪类型受害者报警行为特点及其影响因素分析
作者简介:柳林(1965-),男,湖南湘潭人,博士,教授,博导,主要从事犯罪空间模拟、多智能体模拟、GIS 应用等研究。E-mail:liulin2@mail.sysu.edu.cn
收稿日期: 2018-01-18
要求修回日期: 2018-03-26
网络出版日期: 2018-12-20
基金资助
国家重点研发计划项目(2018YFB0505500,2018YFB0505503)、国家自然科学基金重点项目(41531178)、广州市科学研究计划重点项目(201804020016)和广东省自然科学基金研究团队项目(2014A030312010)资助
Characteristics and Effect Factors of Victims' Crime Reporting Behavior of Different Victimization
Received date: 2018-01-18
Request revised date: 2018-03-26
Online published: 2018-12-20
Supported by
National Key R&D Program of China (2018YFB0505500, 2018YFB0505503), Key Program of National Natural Science Foundation of China (41531178), Key Project of Science and Technology Program of Guangzhou City, China (201804020016), Research Team Program of Natural Science Foundation of Guangdong Province, China (2014A030312010).
Copyright
采用问卷调查数据,以理性选择理论为框架,对广州地区扒窃、诈骗、入室盗窃、暴力侵害四大犯罪类型受害者的报警行为进行了分析。研究发现,扒窃和诈骗的发生率较高,但报警率较低;入室盗窃和暴力侵害的发生率较低,但报警率较高。逻辑回归结果表明,损失的财产价值是影响扒窃、诈骗、入室盗窃、暴力侵害受害者报警行为的共同因素,损失越大,报警的可能性越大。此外,户口状态对扒窃报警行为有影响;入室盗窃和暴力侵害的报警行为还受个人客观属性和主观感知的影响。表明西方的理性选择理论框架适用于中国的报警率研究,但在选择具体的衡量指标时应更慎重;在对用公安部门的数据进行犯罪空间分析时,应注意报警率的影响。
柳林 , 宋广文 , 肖露子 , 周素红 , 宋广钦 , 龙冬平 . 不同犯罪类型受害者报警行为特点及其影响因素分析[J]. 地理科学, 2018 , 38(12) : 1998 -2005 . DOI: 10.13249/j.cnki.sgs.2018.12.007
Crime data, provided by public security departments, is an important source of research data for crime geography. However, not all victims would report to the police. The relationship between data and the reality of crime and the mechanism of victims reporting behavior are still not covered in China. Based on the theory of general rational choice, we carried out a victim survey in Guangzhou to investigate the crime reporting behavior of theft from person, fraud, burglary and violence and their influence of crime spatial pattern revealed by police data. Results show that the occurrence rates of fraud and theft from person are relatively high but reporting rate is low, while the occurrence rates of burglary and violence are low but reporting rates are high. Logistic models reveal that loss value is the key factor in affecting crime reporting behavior for the four types of crime. The bigger value the loss is, the higher possibility to report crime to the police there will be. What’s more, Hukou status would influence the theft reporting. The reporting behavior of burglary and violence would be affected by victims’ personal objective attributes and subjective sense. This study has approved that the general rational choice theory is applicable to China, but some notice should be taken care of when selecting indicators. Spatial variations for reporting rate of theft from person and burglary may exist, which reminds us that we should pay attention to the influence of crime reporting rate when using the official crime data.
Key words: crime reporting behavior; crime reporting rate; victim; theft from person; fraud; burglary; violence
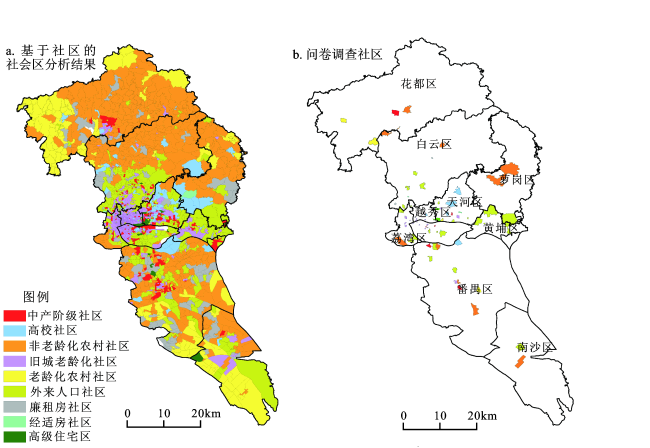
Fig.1 The spatial pattern of social area and the chosen communities for questionnaire in Guangzhou图1 广州社区分析结果及问卷调查社区分布 |
Table 1 Descriptive statistics of samples in Guangzhou表1 广州社区调查样本基本情况 |
| 变量 | 描述 | 值 | 总样本 (1568) | 犯罪类型(起) | |||
|---|---|---|---|---|---|---|---|
| 扒窃 (318) | 诈骗 (179) | 入室盗窃 (111) | 暴力侵害 (50) | ||||
| 是否报警(%) | 最近一次被侵害,您有没有报警? | 否(0) | — | 0.660 | 0.793 | 0.514 | 0.540 |
| 是(1) | — | 0.340 | 0.207 | 0.486 | 0.460 | ||
| 年龄 | 您的岁数 | 平均值 | 38.030 | 35.723 | 33.989 | 37.766 | 38.300 |
| 标准差 | 14.016 | 12.318 | 12.817 | 13.087 | 12.738 | ||
| 性别(%) | 您的性别 | 男(0) | 0.533 | 0.525 | 0.592 | 0.532 | 0.700 |
| 女(1) | 0.467 | 0.475 | 0.408 | 0.468 | 0.300 | ||
| 婚姻状态(%) | 未婚包括单身、离异、丧偶 | 未婚(0) | 0.313 | 0.333 | 0.402 | 0.252 | 0.380 |
| 已婚(1) | 0.686 | 0.667 | 0.598 | 0.748 | 0.620 | ||
| 教育水平 | 未受过教育(1)→研究生或以上(8) | 平均值 | 4.260 | 4.506 | 4.380 | 4.045 | 3.800 |
| 标准差 | 1.608 | 1.622 | 1.558 | 1.551 | 1.604 | ||
| 是否失业(%) | 您的就业状况?失业(1);在业(0) | 否(0) | 0.952 | 0.947 | 0.944 | 0.928 | 0.960 |
| 是(1) | 0.048 | 0.054 | 0.056 | 0.072 | 0.040 | ||
| 月收入(元) | 1 000元以下(1)→1 000元以上(7) | 平均值 | 3.580 | 3.744 | 3.657 | 3.455 | 2.900 |
| 标准差 | 1.424 | 1.499 | 1.394 | 1.482 | 1.529 | ||
| 是否非外地农业户口(%) | 是否本地户口 | 否(0) | 0.562 | 0.598 | 0.559 | 0.660 | 0.560 |
| 是(1) | 0.438 | 0.402 | 0.441 | 0.340 | 0.440 | ||
| 广州话水平 | 一点都不会(1)→很流利(5) | 平均值 | 3.690 | 3.711 | 3.525 | 3.658 | 3.260 |
| 标准差 | 1.412 | 1.389 | 1.395 | 1.528 | 1.509 | ||
| 阶层感知 | 下层(1)→上层(5) | 平均值 | 2.180 | 2.245 | 2.218 | 2.054 | 1.960 |
| 标准差 | 0.920 | 0.931 | 0.938 | 0.952 | 0.968 | ||
| 安全感知 | 很不安全(1)→很安全(5) | 平均值 | 3.530 | 3.387 | 3.369 | 3.252 | 3.080 |
| 标准差 | 0.764 | 0.761 | 0.770 | 0.756 | 0.966 | ||
| 见警率 | 几乎看不到(1)→总是看到(5) | 平均值 | 3.150 | 3.079 | 3.117 | 3.045 | 2.840 |
| 标准差 | 0.835 | 0.808 | 0.850 | 0.835 | 0.866 | ||
| 警察满意度 | 很不满意(1)→很满意(5) | 平均值 | 3.400 | 3.173 | 3.246 | 3.045 | 2.980 |
| 标准差 | 0.779 | 0.785 | 0.858 | 0.908 | 1.020 | ||
| 反抗意识 | 当自己遭受侵犯时,会当即反抗,赞同吗?很不赞同(1)→非常赞同(5) | 平均值 | 3.560 | 3.566 | 3.553 | 3.495 | 3.760 |
| 标准差 | 0.990 | 0.920 | 1.066 | 1.017 | 1.117 | ||
注:“是否报警”变量的“—”表示在总样本中该变量数据不存在,“是否报警”针对的是有受害经历的调查对象,而非整体;有=1;没有=0。 |
Table 2 Qualitative analysis of failure to report after victimization表2 受到侵害后不报警原因的定性分析 |
| 原因 | 暴力 | 扒窃 | 被骗 | 入室盗窃 |
|---|---|---|---|---|
| 担心犯罪者报复 | 2 | 7 | 5 | 1 |
| 找警察作用有限 | 10 | 67 | 45 | 27 |
| 损失较小 | 6 | 113 | 69 | 24 |
| 其它 | 9 | 24 | 23 | 6 |
| 样本总量(没有报警) | 27 | 211 | 142 | 58 |
Table 3 Logistic regression of different crime reporting rate表3 各类犯罪报警率的逻辑回归分析 |
| 变量 | 扒窃 | 诈骗 | 入室盗窃 | 暴力侵害 | ||||||||
|---|---|---|---|---|---|---|---|---|---|---|---|---|
| B | exp (β) | B | exp (β) | B | exp (β) | B | exp (β) | |||||
| 个人客观属性 | 年龄 | -0.002 | 0.998 | -0.036 | 0.965 | -0.003 | 0.997 | 0.048 | 1.049 | |||
| 性别 | -0.360 | 0.698 | -0.333 | 0.717 | -1.120 | 0.326 | 0.880 | 2.411 | ||||
| 婚姻 | 0.629 | 1.876 | -0.121 | 0.886 | -1.061 | 0.346 | 0.307 | 1.359 | ||||
| 受教育程度 | 0.040 | 1.041 | 0.041 | 1.042 | 0.502* | 1.652 | -0.010 | 0.990 | ||||
| 就业状态 | 1.210 | 3.353 | -0.684 | 0.505 | 1.791 | 5.995 | - | - | ||||
| 月收入 | 0.018 | 1.018 | 0.095 | 1.100 | -0.186 | 0.830 | -1.221* | 0.295 | ||||
| 户口 | 0.976** | 2.654 | 0.459 | 1.582 | 0.828 | 2.289 | 1.619 | 5.048 | ||||
| 广州话 | -0.210 | 0.811 | 0.014 | 1.014 | -0.185 | 0.831 | -0.381 | 0.683 | ||||
| 主观感知 | 阶层感知 | -0.039 | 0.962 | -0.042 | 0.958 | -0.181 | 0.834 | 2.074* | 7.957 | |||
| 安全评价 | -0.242 | 0.785 | -0.244 | 0.783 | -0.886* | 0.412 | -0.119 | 0.888 | ||||
| 见警率 | 0.235 | 1.265 | -0.031 | 0.970 | 0.791 | 2.206 | -2.026 | 0.132 | ||||
| 警察满意度 | 0.233 | 1.262 | 0.438 | 1.550 | -0.224 | 0.799 | 2.147 | 8.559 | ||||
| 反抗意识 | -0.237 | 0.789 | -0.108 | 0.898 | 0.011 | 1.011 | -1.413* | 0.243 | ||||
| 犯罪情境 | 损失价值 | 0.697*** | 2.008 | 0.702*** | 2.018 | 0.994*** | 2.702 | 0.738* | 2.092 | |||
| 认识犯罪者 | 1.222 | 3.394 | 0.472 | 1.603 | -0.418 | 0.658 | -1.966 | 0.140 | ||||
| 犯罪者在本社区(入室盗窃) | - | - | - | - | -0.987* | 0.373 | - | - | ||||
| 损坏情况(入室盗窃) | - | - | - | - | 0.766 | 2.151 | - | - | ||||
| 受伤程度(暴力侵害) | - | - | - | - | - | - | 1.031 | 2.804 | ||||
| 携带武器(暴力侵害) | - | - | - | - | - | - | 0.550 | 1.733 | ||||
| Constant | -2.915* | 0.054 | -2.980 | 0.051 | 0.932 | 2.540 | -0.998 | 0.369 | ||||
| 模型参数 | LR chi2 | 81.050*** | 38.090*** | 62.620*** | 32.980** | |||||||
| -2 Log likelihood | 323.496 | 141.158 | 89.727 | 36.015 | ||||||||
| Pseudo R2 | 0.200 | 0.213 | 0.411 | 0.478 | ||||||||
| Percentage Correct | 76.3% | 82.0% | 84.6% | 86.0% | ||||||||
| 样本量 | 316 | 178 | 110 | 50 | ||||||||
| 自由度 | 15 | 15 | 17 | 16 | ||||||||
注:***为P<0.001;**为P<0.01;*为P<0.05;“-”表示该模型中不含有该变量,该变量是某类犯罪特有的变量;B为回归系数,exp(β)为比值比。 |
The authors have declared that no competing interests exist.
| [1] |
[
|
| [2] |
[
|
| [3] |
[
|
| [4] |
[
|
| [5] |
[
|
| [6] |
[
|
| [7] |
[
|
| [8] |
|
| [9] |
[
|
| [10] |
[
|
| [11] |
[
|
| [12] |
[
|
| [13] |
[
|
| [14] |
[
|
| [15] |
[
|
| [16] |
[
|
| [17] |
[
|
| [18] |
[
|
| [19] |
|
| [20] |
|
| [21] |
|
| [22] |
|
| [23] |
|
| [24] |
|
| [25] |
|
| [26] |
|
| [27] |
|
| [28] |
[
|
/
| 〈 |
|
〉 |