
基于创新价值链视角下中国创新效率时空格局与影响因素分析
作者简介:刘树峰(1988-),男,山东泰安人,博士研究生,主要从事科技创新与区域发展研究。E-mail: liushufeng68@163.com
收稿日期: 2017-10-31
要求修回日期: 2018-01-24
网络出版日期: 2019-02-10
基金资助
国家自然科学基金项目(41471108)资助
Spatial-temporal Pattern and Influencing Factors of China's Innovation Efficiency Based on Innovation Value Chain
Received date: 2017-10-31
Request revised date: 2018-01-24
Online published: 2019-02-10
Supported by
National Natural Science Foundation of China (41471108).
Copyright
基于创新价值链视角,将创新过程分为知识凝结阶段和市场转化阶段,运用网络DEA-SBM模型、核密度分析、自然断裂点和空间面板计量模型等方法分析了2008~2015年中国省际创新总效率及两阶段效率演化动态及其成因,得出以下结论: 中国创新总效率、知识凝结效率和市场转化效率整体处在低位水平,呈波动上升趋势,近年来增速放缓; 创新效率存在明显的阶段性和区际差异,创新知识凝结、市场转化、总过程的效率值分别呈现低值集聚、离散发展和多峰分异格局,在空间上自东向西大体呈阶梯式递减分布,存在空间相关性,空间溢出效应显著; 科研队伍水平、政府政策支持力度与创新效率有显著的正相关关系,研发经费投入强度的持续增加对创新效率起到一定抑制作用,市场化发育程度和对外开放程度对创新效率的影响不显著。现阶段亟需解决企业自身研发能力不足,高校、研究机构科研评价体系不健全与成果转化收益分配不合理,基础研究投入不足和区际间知识生产能力与市场吸纳能力不匹配等问题。
刘树峰 , 杜德斌 , 覃雄合 , 侯纯光 . 基于创新价值链视角下中国创新效率时空格局与影响因素分析[J]. 地理科学, 2019 , 39(2) : 173 -182 . DOI: 10.13249/j.cnki.sgs.2019.02.001
From the perspective of the innovation value chain, the innovative process was divided into two stages in this article: knowledge condensation and market transformation. This article analyzes on the overall innovation efficiency, dynamic efficiency evolution and cause in the knowledge condensation stage and market transformation stage on a provincial scale in China from 2008 to 2015 with the methods of network DEA-SBM model, kernel density analysis, natural breaking point and Spatial Panel Econometric Model. We can draw the following conclusions: 1) The overall innovation efficiency, knowledge condensation and market transformation efficiency in China were in the low level with the slower fluctuating rise in the recent years; 2) There were obvious differences between different stages and inter regions. The innovative knowledge condensation efficiency presented a low value cluster, the market transformation efficiency presented a discrete development, and the overall efficiency showed us a double-peak pattern. From east to west, it was generally decreasing step by step in space. Spatial correlation can be seen and spatial spillover effect was remarkable; 3) The level of scientific research team and the support of government policy had a significant positive correlation with innovation efficiency. The continuously increased R&D expenditure depressed the innovation efficiency to a certain extent. While the impacts of degree of marketization development and opening up were not significant. The enterprises lacked of R&D ability; scientific research evaluation system of colleges, universities and research institutes is imperfect and the income distribution of achievement transformation is unreasonable; the investment on basic research is insufficient; the knowledge productivity does not match the market absorption capacity properly. All the above problems are urgently to be solved.
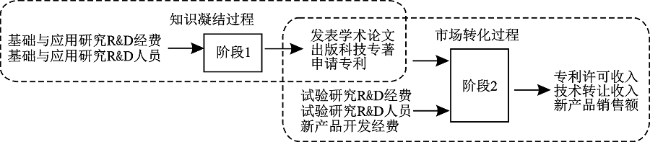
Fig.1 Two-stage chain process of innovation transformation图1 创新成果转化两阶段链式过程 |
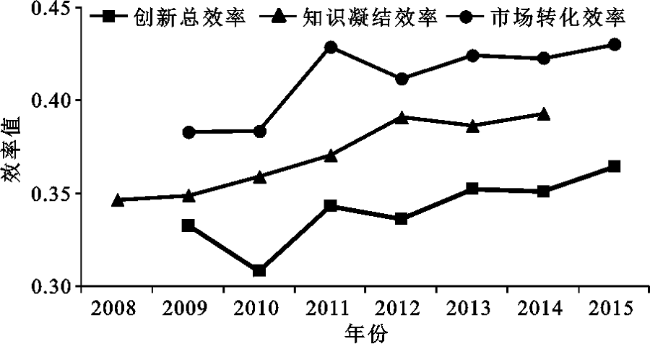
Fig. 2 Trend of China’s innovation efficiency in 2008-2015图2 2008~2015年中国两阶段创新效率均值变化趋势 |
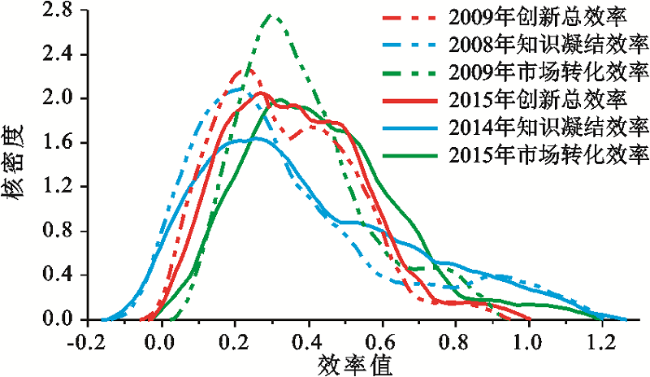
Fig.3 Kernel density analysis of China's two-stage-innovation efficiency in 2008-2015图3 2008~2015年中国两阶段创新效率核密度趋势 |
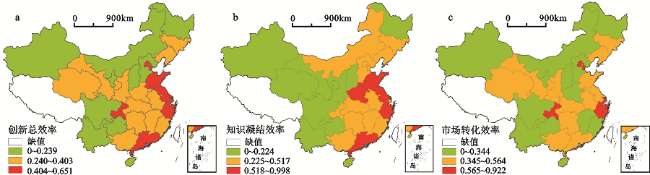
Fig. 4 Breaking point classification of China’s average innovation efficiency in 2008-2015图4 2008~2015年中国省际创新效率均值断裂点分级 |
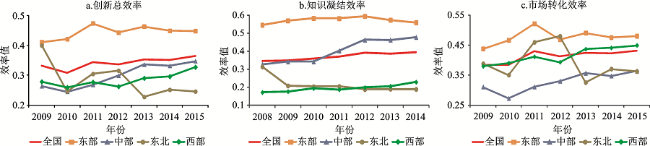
Fig. 5 Trend of China’s innovation efficiency in regional scale from 2008 to 2015图5 2008~2015年中国分区域创新效率变动趋势 |
Table 1 Global Moran's I of China’s innovation efficiency in 2008-2015表1 2008~2015年中国创新效率全局Moran's I指数值 |
| 2008年 | 2009年 | 2010年 | 2011年 | 2012年 | 2013年 | 2014年 | 2015年 | |
|---|---|---|---|---|---|---|---|---|
| 创新总效率 | / | -0.067 | 0.164* | 0.205** | 0.170** | 0.280*** | 0.328*** | 0.278** |
| / | (-0.305) | (1.700) | (1.844) | (1.690) | (2.685) | (2.613) | (1.518) | |
| 知识凝结效率 | 0.255** | 0.356*** | 0.329*** | 0.331*** | 0.315*** | 0.371*** | 0.351*** | / |
| (2.394) | (3.306) | (2.906) | (3.074) | (2.770) | (3.367) | (3.097) | / | |
| 市场转化效率 | / | -0.102 | -0.014 | -0.056 | 0.016 | 0.103* | 0.130* | 0.050 |
| / | (-0.586) | (0.170) | (-0.139) | (0.440) | (1.258) | (1.313) | (0.669) |
注:***、**、*分别表示通过1%、5%、10%显著性检验;括号内为Z的统计值;“/”为无此项。 |
Table 2 Influence factors of China’s innovation efficiency based on Spatial Panel Model表2 中国创新总效率影响因素空间面板估计结果 |
| OLS | SEM | SAR | |
|---|---|---|---|
| 研发经费投入强度 | 0.0314*(1.78) | -0.0814**(-2.35) | -0.0853**(-2.22) |
| 科研队伍水平 | -0.0015(-0.54) | 00095***(3.20) | 0.0102***(3.28) |
| 市场化发育程度 | 0.0356***(5.12) | 0.0059(0.68) | 0.0073(1.67) |
| 对外开放程度 | -0.0028(-0.87) | -0.0005(-0.14) | -0.0007(-0.20) |
| 政府政策支持度 | 0.0292*(1.67) | 0.0379**(2.11) | 0.0301*(1.62) |
| λ | / | 0.2141**(3.07) | / |
| ρ | / | / | 0.2202**(2.21) |
| R2 | 0.4274 | 0.4350 | 0.4038 |
注:***、**、*分别表示通过1%、5%、10%显著性检验;括号为t或Z的统计值;“/”为无此项;λ、ρ为模型空间溢出系数。 |
The authors have declared that no competing interests exist.
| [1] |
[
|
| [2] |
[
|
| [3] |
[
|
| [4] |
[
|
| [5] |
|
| [6] |
[
|
| [7] |
[
|
| [8] |
|
| [9] |
|
| [10] |
[
|
| [11] |
|
| [12] |
|
| [13] |
|
| [14] |
|
| [15] |
[
|
| [16] |
[
|
| [17] |
[
|
| [18] |
|
| [19] |
国家统计局, 科学技术部. 中国科技统计年鉴[M]. 北京: 中国统计出版社, 2007-2015.
[National Bureau of Statistics of China, The Ministry of Science and Technology. China statistical yearbook on science and technology. Beijing: China Statistics Press, 2007-2015.]
|
| [20] |
国家统计局. 中国统计年鉴[M]. 北京:中国统计出版社, 2007-2015.
[National Bureau of Statistics of China. China statistical yearbook. Beijing: China Statistics Press, 2007-2015.]
|
| [21] |
国家统计局. 中国城市统计年鉴[M]. 北京: 中国统计出版社, 2007-2015.
[National Bureau of Statistics of China. China Urban Statistical Yearbook. Beijing: China Statistics Press, 2007-2015.]
|
| [22] |
[
|
| [23] |
[
|
| [24] |
|
| [25] |
|
| [26] |
[
|
| [27] |
[
|
| [28] |
[
|
| [29] |
[
|
| [30] |
|
| [31] |
[
|
| [32] |
[
|
| [33] |
[
|
/
| 〈 |
|
〉 |