
基于多尺度的中国环境污染事件时空分布及其影响因素
|
赵雪雁(1971-),女,甘肃武都人,教授,主要从事生态经济研究。E-mail:zhaoxy@nwnu.edu.cn |
收稿日期: 2018-10-11
要求修回日期: 2019-01-15
网络出版日期: 2019-12-02
基金资助
中国科学院A类战略性先导科技专项(XDA19040502)
国家自然科学基金项目(41661115)
国家自然科学基金项目(41971268)
中国科学院内陆河流域生态水文重点实验室开放基金项目(KLEIRB-2S-16-03)
版权
Spatio-temporal Distribution and Influencing Factors of Environmental Pollution Incidents Based on Multi-scales in China
Received date: 2018-10-11
Request revised date: 2019-01-15
Online published: 2019-12-02
Supported by
Category of Strategic Priority Research Program of Chinese Academy of Sciences(XDA19040502)
National Natural Sciences Foundation of China(41661115)
National Natural Sciences Foundation of China(41971268)
Key Laboratory of Ecohydrology of Inland River Basin, Chinese Academy of Sciences(KLEIRB-2S-16-03)
Copyright
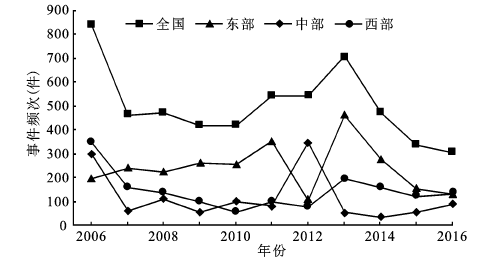
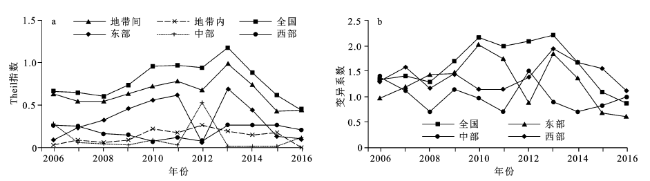
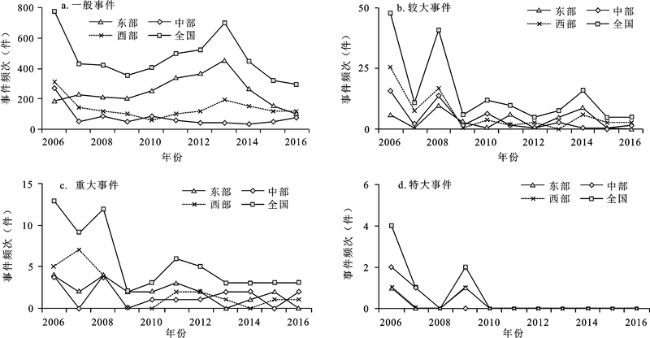
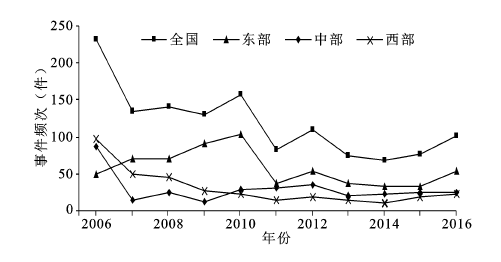
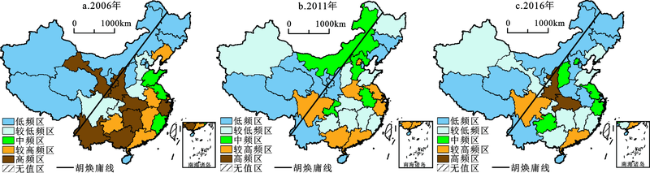
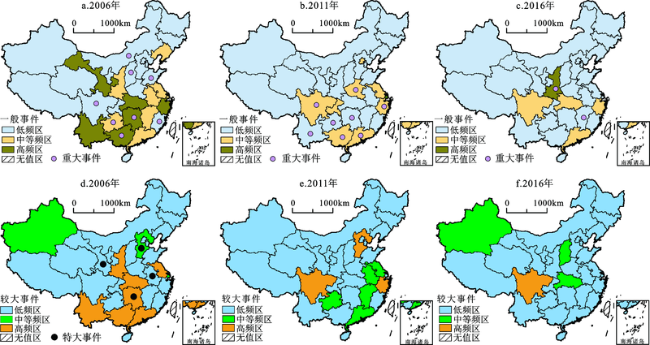
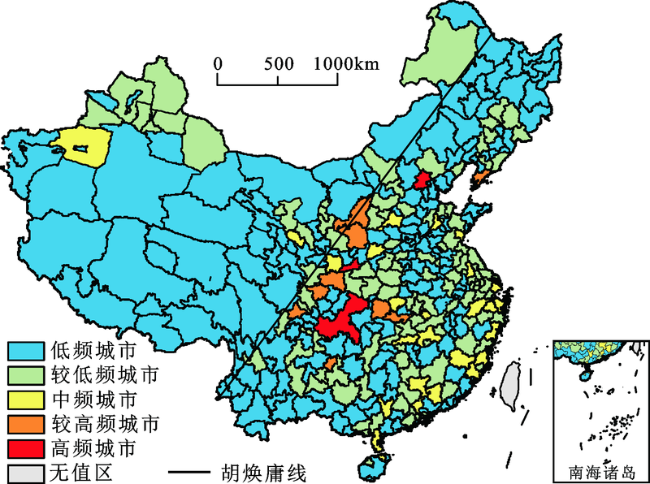
环境污染事件已成为人类社会发展面临的严峻挑战,严重制约着人类社会的可持续发展,当前急需厘清环境污染事件的时空特征及影响因素,为制定有效的环保政策提供借鉴。利用Theil指数、变异系数、ESDA等方法,分析了2006~2016年中国环境污染事件的时空分布特征,并借助地理探测器识别了不同尺度环境污染事件的影响因素。结果表明:① 2006~2016年省级尺度环境污染事件发生总频次与不同等级环境污染事件发生频次均呈波动下降趋势,其发生频次和区域差异呈“东-中-西”洼地型格局;② 地级市尺度环境污染事件发生频次随城市规模减小有所降低,随经济发展水平降低呈倒U型,同时,环保重点城市污染事件发生频次高于普通城市的特征;而环境污染事件的差异性表现为随城市规模减小有所降低,随经济发展水平降低而递减,及环保重点城市高于普通城市的特征。③ “胡焕庸线”以东地区环境污染事件多发且类型多样,以西地区污染事件少发且类型单一,不同等级环境污染事件的空间分布差异较大;④ 环境污染事件的影响因素存在差异,且随尺度增大,影响因素与环境污染事件的关联性趋于增强。其中,经济发展和环境监管水平对不同尺度环境污染事件均有显著影响,环境监管水平与其他因素的交互作用对不同尺度环境污染事件的解释力较高。
赵雪雁 , 王蓉 , 王晓琪 , 刘江华 . 基于多尺度的中国环境污染事件时空分布及其影响因素[J]. 地理科学, 2019 , 39(9) : 1361 -1370 . DOI: 10.13249/j.cnki.sgs.2019.09.001
Environmental pollution incidents have become a major challenge for human social development, seriously restrict the sustainable development. Therefore, it is urgently necessary to clarify the temporal and spatial characteristics of pollution incidents and its influencing factors, in order to provide references for the formulation of effective environmental protection policies. In this paper, used the Theil index, coefficient of variation, ESDA and other methods to analyze the spatial distribution characteristics of pollution incidents from 2006 to 2016 in China, and the GeoDetector to identify the influencing factors at different scales. The results showed that: 1) At the provincial scales, the occurrence frequencies of environmental pollution incidents and the occurrence of environmental pollution incidents at different levels both showed fluctuating downward trends, and their frequency and regional differences all showed 'East-Central-West' low-lying land patterns. 2)At the prefecture-level cities scale, the frequency of environmental pollution incidents is reduced as the decreases of city scale, and the U-shaped change occurs with the decrease of economic development level, the frequency of pollution incidents in key environmental protection cities is higher than ordinary cities, difference of environmental pollution incidents is reduced as the decreases of city scale and economic development level, and the environmental protection key cities are higher than ordinary cities. 3) The environmental pollution incidents in east of the 'Hu Line' are frequent and diverse, and the western pollution incidents are rare and single, and the spatial distribution of different levels of environmental pollution incidents were quite different. 4) There existed differences in impacting factors at different scales, and as the scale increased, the correlation between impacting factors and environmental pollution incidents also increased. Among them, the level of economic development and the level of environmental supervision all had vital impacts on environmental pollution incidents. The interaction between environmental supervision and other factors had the significant impacts to the environmental pollution incidents.
Key words: environmental pollution incidents; regional differences; GeoDector; China
表1 中国不同城市类型环境污染事件的差异性Table 1 The differences in environmental pollution incidents of different city types in China |
| 差异性 | 城市规模 | 城市经济发展水平 | 环保城市和普通城市 | |||||||||
|---|---|---|---|---|---|---|---|---|---|---|---|---|
| 特大城市 | 大城市 | 中等城市 | 小城市 | 发达城市 | 较发达城市 | 欠发达城市 | 不发达城市 | 环保重点城市 | 普通城市 | |||
| 污染事件比重(%) | 29.71 | 25.88 | 19.41 | 25.00 | 28.82 | 30.29 | 32.35 | 8.53 | 56.76 | 43.24 | ||
| 变异系数 | 3.44 | 1.69 | 1.08 | 1.56 | 2.72 | 2.28 | 1.35 | 1.18 | 2.64 | 1.25 | ||
| Theil指数 | 0.50 | 0.26 | 0.13 | 0.27 | 0.42 | 0.38 | 0.27 | 0.08 | 0.82 | 0.34 | ||
注: 不含港澳台数据。 |
表2 中国省级和地级市尺度影响因素对环境污染事件的解释力Table 2 The explanatory power of various influencing factors on environmental pollution incidents at the provincial and prefecture-level city scale in China |
| 探测指标 | 省级 | 地级市 | |||
|---|---|---|---|---|---|
| 2006年 | 2011年 | 2016年 | 2016年 | ||
| 年末人口数(x1) | 0.59*** | 0.35 | 0.32 | 0.09** | |
| GDP(x2) | 0.38* | 0.46** | 0.55** | 0.13*** | |
| 城镇化率(x3) | 0.20 | 0.28 | 0.17 | 0.06 | |
| 工业增加值占GDP比重(x4) | 0.40* | 0.11 | 0.41 | 0.02 | |
| 工业企业数(x5) | 0.50** | 0.23 | 0.28 | 0.06 | |
| 环保人员数(x6) | 0.40* | 0.60*** | 0.46* | 0.08* | |
| 环保机构数(x7) | 0.35 | 0.32 | 0.37 | 0.09** | |
| 环境污染治理投资占GDP比重(x8) | 0.21 | 0.38** | 0.07 | 0.02 | |
注:***、**和*分别表示P在0.01、0.05和0.10的水平上显著。不含港澳台数据。 |
表3 中国省级尺度环境污染事件影响因子间的交互作用Table 3 The interaction between influencing factors of environmental pollution events at provincial scale in China |
| 2006年 | 2011年 | 2016年 | |||||
|---|---|---|---|---|---|---|---|
| 交互因子 | 作用值 | 交互因子 | 作用值 | 交互因子 | 作用值 | ||
| x1∩x2 | 0.86 | x1∩x3 | 0.90 | x1∩x2 | 0.83 | ||
| x2∩x3 | 0.73 | x2∩x3 | 0.87 | x2∩x3 | 0.89 | ||
| x1∩x4 | 0.86 | x3∩x4 | 0.89 | x3∩x5 | 0.62 | ||
| x2∩x4 | 0.80 | x3∩x5 | 0.80 | x4∩x2 | 0.93 | ||
| x3∩x4 | 0.83 | x6∩x2 | 0.86 | x4∩x3 | 0.85 | ||
| x3∩x5 | 0.90 | x6∩x3 | 0.86 | x5∩x1 | 0.84 | ||
| x6∩x4 | 0.88 | x6∩x4 | 0.87 | x5∩x2 | 0.94 | ||
| x6∩x5 | 0.88 | x6∩x7 | 0.84 | x6∩x4 | 0.80 | ||
| x7∩x1 | 0.89 | x7∩x8 | 0.83 | x7∩x4 | 0.87 | ||
| x7∩x2 | 0.98 | x8∩x2 | 0.86 | x7∩x5 | 0.85 | ||
| x7∩x3 | 0.85 | x8∩x3 | 0.85 | x8∩x4 | 0.89 | ||
| x7∩x4 | 0.88 | x8∩x5 | 0.83 | x8∩x5 | 0.91 | ||
| x8∩x6 | 0.76 | x8∩x6 | 0.94 | x8∩x6 | 0.89 | ||
注:因篇幅限制,仅列举作用值较高的交互因子;不含港澳台数据。 |
表4 中国地级市尺度环境污染事件影响因子间的交互作用Table 4 The interaction between influencing factors of environmental pollution events at prefecture-level scale in China |
| x1 | x2 | x3 | x4 | x5 | x6 | x7 | |
|---|---|---|---|---|---|---|---|
| x2 | 0.26 | ||||||
| x3 | 0.33 | 0.31 | |||||
| x4 | 0.26 | 0.30 | 0.33 | ||||
| x5 | 0.26 | 0.24 | 0.23 | 0.28 | |||
| x6 | 0.16 | 0.29 | 0.36 | 0.24 | 0.23 | ||
| x7 | 0.17 | 0.29 | 0.31 | 0.30 | 0.25 | 0.23 | |
| x8 | 0.28 | 0.31 | 0.26 | 0.20 | 0.30 | 0.29 | 0.36 |
注:不含港澳台数据。 |
| [1] |
人民网.1956年日本水俣事件.[N/OL]. Japanese Minamata event in 1956. 2004- 12- 2. .
[ People.cn.Japanese Minamata event in 1956. 2004-12-27. .]
|
| [2] |
国际节能环保网.中国近年来最严重的十大环境污染事件[N/OL]. 2017- 06- 15. .
[ Huanbao. in-en.com. Chinese top ten most serious environmental pollution incidents in recent years. 2017-06-15. .]
|
| [3] |
新华网. 2018环保产业创新发展大会[N/OL]. 2018- 06- 07. .
[ Xinhuanet. Environmental Industry innovation and development conference, 2018. 2018-06-07. . Environmental Industry innovation and development conference, 2018. 2018-06-07. .]
|
| [4] |
联合国. 水和环境-可持续发展[N/OL]. 2015 -9-25.
[
|
| [5] |
|
| [6] |
陆大道 .中速增长: 中国经济的可持续发展[J]. 地理科学, 2015,35(10):1207-1219.
[
|
| [7] |
王敏, 黄滢 . 中国的环境污染与经济增长[J]. 经济学(季刊), 2015,14(2):557-578.
[
|
| [8] |
屈小娥 . 1990~2009年中国省际环境污染综合评价[J]. 中国人口•资源与环境, 2012,22(5):158-163.
[
|
| [9] |
李静, 吕永龙, 贺桂珍 , 等. 我国突发性环境污染事故时空格局及影响研究[J]. 环境科学, 2008,29(9):2684-2688.
[
|
| [10] |
周侃, 樊杰 . 中国环境污染源的区域差异及其社会经济影响因素:基于339个地级行政单元截面数据的实证分析[J]. 地理学报, 2016,71(11):1911-1925.
[
|
| [11] |
|
| [12] |
|
| [13] |
|
| [14] |
杨娅, 马俊伟, 刘仁志 . 上海市突发环境事件时空格局及影响因素分析[J]. 中国人口·资源与环境, 2012,22(141):105-109.
[
|
| [15] |
杨洁, 毕军, 张海燕 , 等. 中国环境污染事故发生与经济发展的动态关系[J]. 中国环境科学, 2010,30(4):571-576.
[
|
| [16] |
薛鹏丽, 曾维华 . 上海市突发环境污染事故风险区划[J]. 中国环境科学, 2011,31(10):1743-1750.
[
|
| [17] |
丁镭, 黄亚林, 刘云浪 , 等. 1995-2012年中国突发性环境污染事件时空演化特征及影响因素[J]. 地理科学进展, 2015,34(6):749-760.
[
|
| [18] |
国家统计局, 环境保护部. 中国环境统计年鉴[M]. 北京: 中国统计出版社,2007- 2017.
[ National Bureau of Statistics , Ministry of Environmental Protection of China. China Statistical yearbook on environment. Beijing: China Statistics Press, 2007- 2017.]
|
| [19] |
国家统计局. 中国统计年鉴[M]. 北京: 中国统计出版社, 2007- 2017.
[
|
| [20] |
中国环境年鉴编辑委员会. 中国环境年鉴[M]. 北京: 中国环境科学出版社, 2007-2017.
[ China Environmental Yearbook Editorial Board. China environment yearbook. Beijing: China Environmental Science Press,2007- 2017.]
|
| [21] |
国家统计局城市社会经济调查司. 中国城市统计年鉴[M]. 北京: 中国统计出版社, 2017.
[ Department of Urban Social Economic Survey of the National Bureau of Statistics. China city statistical yearbook. Beijing: China Statistics Press, 2017.]
|
| [22] |
赵雪雁, 王伟军, 万文玉 . 中国居民健康水平的区域差异:2003-2013[J]. 地理学报, 2017,72(4):685-698.
[
|
| [23] |
|
| [24] |
张杰, 唐根年 . 浙江省制造业空间分异格局及其影响因素[J]. 地理科学, 2018,38(7):1107-1117.
[
|
| [25] |
席强敏 . 城市效率与城市规模关系的实证分析:基于2001-2009年我国城市面板数据[J].经济问题, 2012(10):37-41.
[
|
| [26] |
李晶晶, 苗长虹 . 长江经济带人口流动对区域经济差异的影响[J]. 地理学报, 2017,72(2):197-212.
[
|
| [27] |
李名升, 张建辉, 张殷俊 , 等. 近10年中国大气PM10污染时空格局演变[J]. 地理学报, 2013,68(11):1504-1512.
[
|
| [28] |
胡志强, 苗健铭, 苗长虹 . 中国地市工业集聚与污染排放的空间特征及计量检验[J]. 地理科学, 2018,38(2):168-176.
[
|
| [29] |
周侃 . 中国环境污染的时空差异与集聚特征[J]. 地理科学, 2016,36(7):989-997.
[
|
| [30] |
王增利, 刘学军, 陆娟 . 入室盗窃多尺度地理因子分析[J]. 地理学报, 2017,72(2):329-340.
[
|
/
| 〈 |
|
〉 |