
中国市域工业污染对劳动力集聚的影响研究
|
张跃(1992-),男,安徽宿州人,博士研究生,主要从事区域经济学研究。E-mail:zhangyue6031669@163.com |
收稿日期: 2018-11-16
要求修回日期: 2019-02-01
网络出版日期: 2019-10-10
基金资助
国家社会科学基金青年项目(13CGL086)
版权
Impact of Industrial Pollution on Labor Agglomeration in China
Received date: 2018-11-16
Request revised date: 2019-02-01
Online published: 2019-10-10
Supported by
National Social Science Fund Youth Project(13CGL086)
Copyright
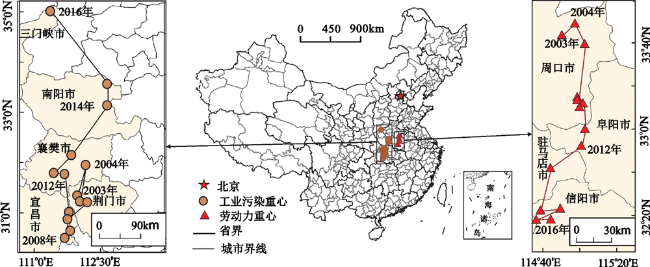
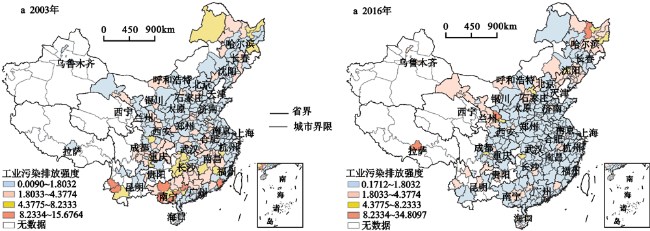
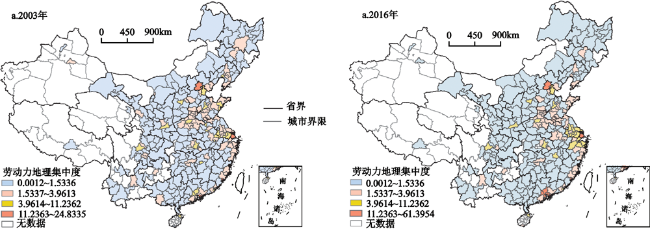
基于2003~2016年中国286个地级及以上城市数据,研究工业污染和劳动力空间分布的演化特征及内在联系,继而将地区收入水平和工业集聚作为门槛变量研究工业污染对劳动力集聚影响。结果表明:①工业污染和劳动力的重心在移动方向上背向而驰,工业污染重心整体向北移动,劳动力重心整体向南移动,工业污染与劳动力的空间分布演化特征与二者相应的重心移动轨迹相契合。②工业污染会造成劳动力集聚水平降低,且随着地区收入水平的提高,高污染水平导致劳动力集聚水平下降的现象愈发明显。③以工业集聚作为门槛变量时,工业污染对劳动力集聚的影响存在明显的区域差异性,全国和东部地区劳动力集聚水平呈现出先降低后升高特征,中部地区为逐步升高的正向效应,西部地区则是逐步降低的负向效应。
张跃 , 王图展 , 刘莉 . 中国市域工业污染对劳动力集聚的影响研究[J]. 地理科学, 2019 , 39(10) : 1654 -1662 . DOI: 10.13249/j.cnki.sgs.2019.10.014
Based on the data of 286 cities at or above the prefecture level in China from 2003 to 2016, the evolutionary characteristics and internal relations of industrial pollution and spatial distribution of labor force were studied, and then the regional income level and industrial agglomeration were taken as threshold variables to study the impact of industrial pollution on labor force agglomeration. The results show that: 1) The center of gravity of industrial pollution and labor force moves backwards in the direction of movement, the center of gravity of industrial pollution moves northward as a whole, and the center of gravity of labor force moves southward as a whole. 2) Industrial pollution emissions will lead to the reduction of labor concentration level, with the increase of regional income level, high pollution level leads to the decline of labor concentration level is more obvious. 3) When industrial agglomeration is taken as the threshold variable, the impact of industrial pollution on labor agglomeration has obvious regional differences. The labor agglomeration level in China and the eastern region first decreases and then increases. The central region has a positive effect of gradual increase, while the western region has a negative effect of gradual decrease.
表1 变量及数据的稳定性检验Table 1 Variable description and data stability test |
| 变量类型 | 变量 | 变量定义 | 变量代码 | HT检验 | |
|---|---|---|---|---|---|
| Z值 | P值 | ||||
| 因变量 | 劳动力集聚 | 劳动力地理集中度 | Y | -2.64 | 0.00 |
| 自变量 | 工业污染 | 工业污染排放强度 | pollute | -39.14 | 0.00 |
| 控制变量 | 收入水平 | 地区职工平均工资对数值与相应的全国值之比 | income | -35.15 | 0.00 |
| 工业集聚 | 地区工业密度与相应的全国值之比 | gather | -10.14 | 0.00 | |
| 产业结构 | 地区二三产业产值与GDP之比 | structure | -16.58 | 0.00 | |
| 基础设施 | 地区人均道路面积与国土面积之比 | road | -5.87 | 0.00 | |
注:不含港澳台数据。 |
表2 实证结果Table 2 The empirical results |
| 变量 | 基准模型实证结果(固定效应模型) | 变量 | 内生性实证结果(2SLS模型) | ||||||
|---|---|---|---|---|---|---|---|---|---|
| 全国 | 东部 | 中部 | 西部 | 全国 | 东部 | 中部 | 西部 | ||
| pollute | -0.03*** (-2.74) | -0.31*** (-5.45) | 0.03*** (2.59) | -0.001 (-0.24) | pollute-1 | -0.01*** (-3.09) | -0.16*** (-3.32) | 0.03*** (2.98) | -0.01 (-0.15) |
| income | 0.99* (1.83) | -20.42*** (-4.95) | 2.22* (1.82) | 0.072 (0.41) | income | 0.71** (2.23) | -20.76*** (-4.56) | 2.05** (2.80) | 0.08 (0.35) |
| gather | -0.28*** (-25.62) | -0.27*** (-14.62) | 0.32*** (7.85) | 0.06* (1.72) | gather | -0.28*** (-23.25) | -0.27*** (-15.31) | 0.29** (2.13) | 0.062* (1.72) |
| structure | 1.22*** (4.25) | 4.17*** (6.53) | 1.13*** (4.05) | 0.43** (2.78) | structure | 1.88*** (5.39) | 4.73*** (-5.35) | 0.95*** (2.91) | 0.35* (1.67) |
| road | 32.10*** (28.56) | 35.79*** (18.88) | 18.98*** (7.11) | 1.87* (1.79) | road | 32.19*** (26.36) | 36.62*** (18.42) | 18.6*** (6.75) | 1.83 (1.78) |
| Adj-R2 | 0.35 | 0.42 | 0.21 | 0.31 | Adj-R2 | 0.32 | 0.43 | 0.18 | 0.24 |
| F-test | 45.12*** | 152.11*** | 26.05*** | 28.26*** | F-test | 293.73*** | 180.43*** | 35.38*** | 25.49*** |
注:*、**、***表示10%,5%,1%的显著水平;括号内为t值;不含港澳台数据。 |
表3 门槛面板模型估计结果Table 3 Threshold panel model estimation results |
| 变量 | 模型(2) | 模型(3) | ||||||
|---|---|---|---|---|---|---|---|---|
| 全国 | 东部 | 中部 | 全国 | 东部 | 中部 | 西部 | ||
| pollute() | -0.03** (-2.53) | -0.33*** (-5.54) | 0.03*** (2.72) | -0.22*** (-2.75) | -0.33*** (-5.45) | 0.03*** (2.87) | -0.01 (-0.85) | |
| pollute() | -1.62** (-6.46) | -1.07*** (-8.19) | 0.21*** (7.19) | 1.85*** (9.18) | 3.82*** (9.31) | 0.42*** (8.12) | -0.53*** (-7.21) | |
| pollute() | -0.02 (-1.03) | -- | -- | -- | -- | -- | -- | |
| income | 0.94* (1.78) | -10.35** (-2.37) | 0.43 (1.41) | 0.89* (1.72) | -20.72*** (-4.59) | 0.82 (0.81) | 0.30 (1.02) | |
| gather | -0.31*** (-27.22) | -0.31*** (-14.71) | 0.35*** (8.12) | -0.33*** (-22.36) | -0.32*** (-18.52) | 0.36*** (9.42) | 0.11*** (3.14) | |
| structure | 1.23*** (4.42) | 4.03*** (6.29) | 0.56*** (3.08) | 1.73*** (5.36) | 3.14*** (4.05) | 1.27** (2.85) | 0.25*** (2.94) | |
| road | 31.62** (28.64) | 32.60*** (28.72) | 22.04*** (9.16) | 32.04*** (28.27) | 31.25*** (16.32) | 22.25*** (7.98) | 10.14*** (5.35) | |
| Adj-R2 | 0.36 | 0.42 | 0.33 | 0.37 | 0.52 | 0.52 | 0.45 | |
| F-test | 45.25*** | 50.32*** | 22.45*** | 45.27*** | 55.46*** | 24.52*** | 32.67*** | |
| Obs | 3718 | 1313 | 1300 | 3718 | 1313 | 1300 | 1105 | |
注:*、**、***表示10%,5%,1%的显著水平;括号内为t值;pollute()表示pollute变量处在i段区间时的回归系数;--表示不存在双门槛回归结果;Obs为观察值数量;不含港澳台数据。 |
| [1] |
刘修岩 . 市场潜能、经济集聚与地区差距——来自中国地级市数据额证据[M]. 南京: 南京大学出版社, 2009.
[
|
| [2] |
环境保护部. 中国生态环境状况公报[M]. 北京: 中国环境出版社, 2017.
[ Ministry of Environmental Protection. China ecological environment status bulletin. Beijing: China Environmental Science Press, 2017.]
|
| [3] |
李佳 . 空气污染对劳动力供给的影响研究——来自中国的经验证据[J]. 中国经济问题, 2014(5):67-77.
[
|
| [4] |
吕晓兰, 姚先国 . 农民工职业流动类型与收入效应的性别差异分析[J]. 经济学家, 2013(6):57-68.
[
|
| [5] |
胡志强, 苗健铭, 苗长虹 . 中国地市工业集聚与污染排放的空间特征及计量检验[J]. 地理科学, 2018,38(2):168-176.
[
|
| [6] |
聂晶鑫, 刘合林 . 中国人才流动的地域模式及空间分布格局研究[J]. 地理科学, 2018,38(12):1979-1987.
[
|
| [7] |
陈昆仑, 郭宇琪, 刘小琼 , 等. 长江经济带工业废水排放的时空格局演化及驱动因素[J]. 地理科学, 2017,37(11):1668-1677.
[
|
| [8] |
李晓春 . 劳动力转移和工业污染——在现行户籍制度下的经济分析[J]. 管理世界, 2005(6):27-33.
[
|
| [9] |
胡石其, 赵伟, 潘爱民 . 农村劳动力转移对工业污染排放的影响机制与空间效应研究[J]. 求索, 2014(11):59-62.
[
|
| [10] |
陈秋红 . 环境因素对人口迁移的作用机制分析[J]. 中国农村观察, 2015(3):87-95.
[
|
| [11] |
余庆年, 施国庆 . 环境、气候变化和人口迁移[J]. 中国人口·资源与环境, 2010,20(7):42-47.
[
|
| [12] |
|
| [13] |
杨俊, 盛鹏飞 . 环境污染对劳动生产率的影响研究[J]. 中国人口科学, 2012(5): 56-65+112.
[
|
| [14] |
肖挺 . 环境质量是劳动人口流动的主导因素吗?——“逃离北上广”现象的一种解读[J]. 经济评论, 2016(2):3-17.
[
|
| [15] |
席鹏辉, 梁若冰 . 城市空气质量与环境移民——基于模糊断点模型的经验研究[J]. 经济科学, 2015(4):30-43.
[
|
| [16] |
国家统计局,环境保护部. 中国环境统计年鉴[M]. 北京: 中国统计出版社, 2017.
[ National Bureau of Statistics, Ministry of Environmental Protection. China environmental statistics yearbook. Beijing: China Statistics Press, 2017.]
|
| [17] |
王莹莹, 童玉芬 . 首都圈劳动力空间分布格局的形成机制——基于新经济地理学的解释[J]. 人口与经济, 2017(1):35-43.
[
|
| [18] |
|
| [19] |
王莹莹 . 中国劳动力空间集聚的就业效应——基于个体就业质量的视角[J]. 人口与经济, 2018(4):53-62.
[
|
| [20] |
程进文, 杨利宏 . 空间关联、劳动集聚与工资分布[J]. 世界经济, 2018,41(2):145-168.
[
|
| [21] |
高军波, 谢文全, 韩勇 , 等. 1990~2013年河南省县域人口、经济和粮食生产重心的迁移轨迹与耦合特征——兼议与社会剥夺的关系[J]. 地理科学, 2018,38(6):919-926.
[
|
| [22] |
|
| [23] |
国家统计局. 中国城市统计年鉴[M]. 北京: 中国统计出版社, 2003-2016.
[ National Bureau of Statistics. China urban statistical yearbook. Beijing: China Statistics Press, 2003-2016.]
|
| [24] |
国家统计局. 中国统计年鉴[M]. 北京: 中国统计出版社, 2003-2016.
[ National Bureau of Statistics. China statistical yearbook. Beijing: China Statistics Press, 2003-2016.]
|
/
| 〈 |
|
〉 |