退耕还林还草工程对黄土高原植被总初级生产力的影响

  • 尤南山 1 ,
  • 董金玮 , 1 ,
  • 肖桐 2 ,
  • 刘纪远 1 ,
  • Xiao Xiangming 3
展开
  • 1. 中国科学院地理科学与资源研究所,北京 100101
  • 2. 生态环境部卫星环境应用中心,北京 100094
  • 3. 美国俄克拉荷马大学,美国诺曼市 73019
董金玮。E-mail:

尤南山(1993-),男,湖北宜昌人,博士研究生,主要从事土地利用变化遥感研究。E-mail: nanshany1993@outlook.com

收稿日期: 2019-02-12

  要求修回日期: 2019-07-01

  网络出版日期: 2020-04-09

基金资助

中国科学院战略性先导科技专项(A类)(XDA19040301)

版权

版权所有,未经授权,不得转载、摘编本刊文章,不得使用本刊的版式设计。

The Effects of the “Grain for Green” Project on Gross Primary Productivity in the Loess Plateau

  • You Nanshan 1 ,
  • Dong Jinwei , 1 ,
  • Xiao Tong 2 ,
  • Liu Jiyuan 1 ,
  • Xiao Xiangming 3
Expand
  • 1. Institute of Geographical Sciences and Natural Resources Research, Chinese Academy of Sciences, Beijing 100101, China
  • 2. Ministry of Ecology and Environment Center for Satellite Application on Ecology and Environment, Beijing 100094, China
  • 3. University of Oklahoma, Norman, OK 73019, USA

Received date: 2019-02-12

  Request revised date: 2019-07-01

  Online published: 2020-04-09

Supported by

Strategic Priority Research Program of the Chinese Academy of Sciences(A)(XDA19040301)

Copyright

Copyright reserved © 2019.

摘要

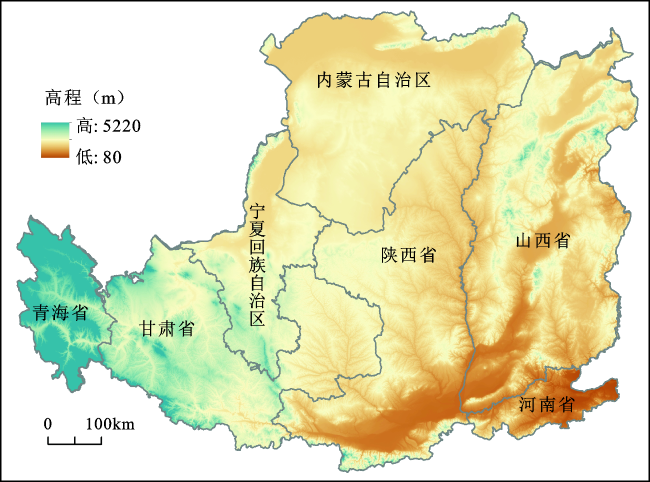
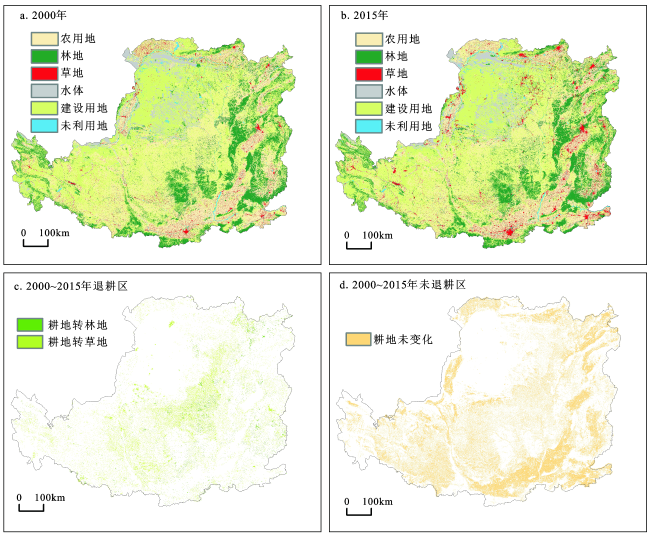
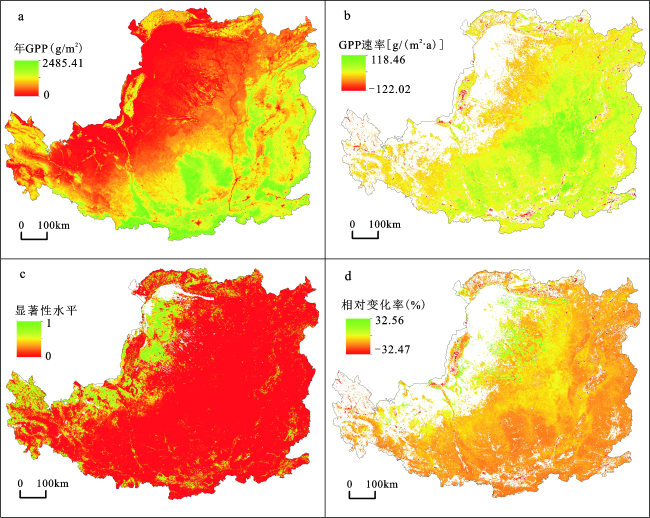
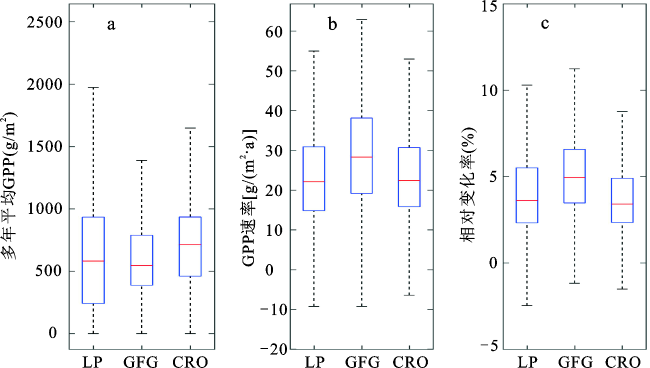
采用Landsat解译的2000年和2015年土地利用/覆盖数据和VPM模型(Vegetation Photosynthesis Model)模拟的2000~2016年总初级生产力(Gross Primary Productivity, GPP)数据,识别出了近16 a黄土高原退耕还林还草的空间范围,并估算了GPP的年际变化趋势。在此基础上,对比分析了退耕区和未退耕区GPP年际变化的差异,从而揭示退耕还林还草工程对GPP年际变化的影响。结果显示,2000~2015年,黄土高原退耕还林还草面积约3.5万km 2,占2000年耕地面积的16.8%。期间,GPP呈增加趋势,GPP显著上升区域占全区面积的67.3%,平均增速24.1 g/(m 2·a)(以C计,下同)。虽然退耕区多年平均GPP低于未退耕区,但退耕区GPP年际增速和相对变化率明显高于未退耕区,分别提高了5.9 g/(m 2·a)和1.5%。

本文引用格式

尤南山 , 董金玮 , 肖桐 , 刘纪远 , Xiao Xiangming . 退耕还林还草工程对黄土高原植被总初级生产力的影响[J]. 地理科学, 2020 , 40(2) : 315 -323 . DOI: 10.13249/j.cnki.sgs.2020.02.017

Abstract

The vegetation coverage and carbon sequestration have been reported experiencing a significant increase since the implementation of the “Grain for Green” (GFG) project in the Loess Plateau (LP). However, the assessment of the effects of the project on ecosystem is not timely and accurate due to the limit of data availability. Using the newest land use dataset (2000 and 2015) interpreted by Landsat and the Gross Primary Productivity (GPP) data from 2000 to 2016 based on the Vegetation Photosynthesis Model (VPM), we examined the spatiotemporal pattern of land use changes due to the GTG project and estimates the inter-annual trend of GPP. A systematic comparison of the inter-annual variations of GPP was conducted among the GFG areas and the unconverted cropland areas (CRO), to reveal the effects of the GFG project. The results showed that an area of 3.5×10 4km 2 croplands was converted into grasslands and forests. The annual GPP showed a significant increasing trend from 2000 to 2016 for the whole plateau with averaged increasing rate of 24.1 g/(m 2·a), and the area with a significant increasing trend of annual GPP accounted for 67.29% of the whole plateau. Although the multi-year averaged annual GPP in the GFG areas was lower than that in the CRO due to the relatively young ages, the increasing rate of annual GPP in the GFG areas was 5.9 g/(m 2·a) higher than that in the CRO. The relative change ratio of annual GPP showed the same situation, the relative change ratio in GFG areas was 1.5% higher than that in the CRO. The GFG project accelerated the increasing of GPP in GFG areas, and then promoted the rising trend in the whole LP. This study provided an updated and more accurate analysis on the pattern of land use change and its effects on GPP dynamics in the Loess Plateau, which could contribute to the effectiveness assessment of the GFG project, future planning of the project, and decision making for the sustainable development of the eco-socio-economic coupling system in the plateau.

人类活动和气候变化引起的土地利用/覆被变化是全球变化的重要组成部分,对全球生态与环境产生了深刻影响[1,2,3,4,5]。改革开放以来,随着社会经济的迅速发展和城镇化进程的不断加快,中国生态环境持续恶化。为了减缓水土流失,恢复植被覆盖度,中国政府于1999年在陕西、甘肃、四川3省率先开展退耕还林试点。2002年,退耕还林还草工程全面推广到全国25个省份,成为自1949年以来中国最大的生态修复工程。黄土高原作为最早实施退耕还林还草工程的区域之一,对中国森林覆盖度的提升做出了较大贡献[4,6,7]。1999~2010年,黄土高原造林面积累计达到1 890.6万hm2[8],植被覆盖度从31.6%(1999年)增加至59.6%(2013年)[9,10]。退耕还林还草也对区域生态系统固碳能力等生态系统服务产生了深刻影响[11,12]。识别黄土高原退耕还林还草工程带来的土地利用变化及其生态效应,对于合理评估工程实施的成效和实现自然生态-社会经济耦合系统的可持续发展均具有重要意义。
诸多学者对黄土高原退耕还林还草工程带来的土地利用变化及其生态效应进行了研究。一方面,Landsat系列遥感影像被广泛用于监测黄土高原退耕还林还草工程引起的土地利用变化[13,14,15,16,17]。例如,Zhou等利用多时相Landsat MSS、TM和ETM+等数据解译出了安塞县1978~2010年共6个时间点上的土地利用类型,发现1995~2010年安塞县森林面积急剧上升[17]。Guo 等基于Landsat 4、5、7、8影像和决策树方法,识别出了延安市1995~2015年退耕还林的成效与损失,强调了巩固现有退耕成果的必要性[15]。另一方面,黄土高原植被动态变化得到了关注。SPOT-VGT 归一化植被指数(NDVI)、LTDT和MODIS融合得到的长时间序列NDVI均表明了黄土高原植被呈现变绿趋势[18,19,20,21,22]。MODIS 增强型植被指数(EVI)、叶面积指数(LAI)和植被吸收光合有效辐射比(fPAR)等也被用于揭示黄土高原退耕还林还草的生物物理后果[23]
已有研究对2010年以前黄土高原土地利用变化进行了充分报道,揭示了退耕还林还草工程的初步成效,但土地利用的最新变化有待进一步分析。因此,需要借助更实时准确的遥感数据,揭示黄土高原退耕还林还草工程在2000年以来长时间跨度下的整体成效。此外,退耕还林还草工程带来的生态系统功能变化有待进一步强化。已有研究多聚焦于NDVI的变化,但NDVI反映植被绿度信息,不能直接体现出生态系统的功能性状。而生态系统总初级生产力(GPP)直接反映植被光合作用强弱,对气候变化以及人类活动的敏感性往往高于NDVI等植被指数[24]。分析GPP的变化、揭示退耕还林还草工程对黄土高原生态系统光合作用的影响,能更直观表现退耕还林还草工程的生态效应。
本文采用2000~2015年高精度土地利用数据集和GPP数据集,系统评估黄土高原退耕还林还草工程带来的土地利用变化及其对GPP的影响。退耕还林还草工程和气候变化会对GPP同时产生影响,为了客观评价退耕还林还草工程的贡献,则需要去除气候变化对GPP的作用。由于退耕区(耕地变为林草地的像元)和未退耕区(耕地未发生变化的像元)在空间上相互交错、彼此相邻,故这两类像元气候变化的统计特征无显著差异,那么退耕区和未退耕区GPP年际变化的差异主要是由退耕还林还草工程造成的。基于此,本文首先准确识别出2000~2015年退耕还林还草的空间分布范围;然后逐像元计算GPP的年际变化趋势;最后,对比分析退耕区和未退耕区GPP年际变化的差异,评估退耕还林还草工程对GPP年际变化的影响。

1 数据与方法

1.1 研究区概况

黄土高原位于黄河中游(107°28′~111°15′E, 35°21′~39°34′ N),面积约6.2×10⁵km2,占据中国陆地面积的6.7%(图1)。黄土高原属于温带大陆性季风气候,年平均温度介于4~14℃,年降水量200~750 mm,跨越了半湿润、半干旱以及干旱区[12]。在过去50 a中,黄土高原年均温增加了1.19℃,年降水量减少了29.1 mm,气候呈现变暖变干的趋势[25]。由于数千年来对脆弱生态系统的过度开发,黄土高原成为了世界上侵蚀最为严重的区域之一。1999年,中国开始实施退耕还林还草工程,黄土高原作为试点率先进行,植树造林、将坡耕地退为林草地等举措有效增加了植被覆盖,也缓解了水土流失严重的问题。
图1 黄土高原区位

Fig.1 The location of the Loess Plateau

1.2 数据来源

1.2.1 土地利用数据集
采用2000年和2015年两期黄土高原土地利用数据。数据来自于中国科学院资源和环境数据中心1:10万中国土地利用数据集,对应的栅格数据空间分辨率为100 m。该数据集是目前覆盖全国的高分辨率土地利用产品中时相最多、时间跨度最大的产品。其中,2000年土地利用数据以Landsat TM为信息源,辅以中巴资源一号卫星(CBERS-1)CCD数据,通过目视解译获得土地利用类型数据,数据精度在92%以上[26]。2015年土地利用数据以Landsat 8 OLI、GF-2等遥感数据为基础,通过人机交互解译方法得到土地利用矢量现状数据集,进而得到100 m分辨率的土地利用栅格数据。土地利用一级类型综合评价精度高于93%,二级类型综合精度高于90%[6]
1.2.2 VPM GPP数据集
黄土高原生态系统GPP数据来源于VPM GPP V20数据集[27]。该数据集提供了2000~2016年500 m和8 d 分辨率的GPP产品。VPM GPP模型以光合利用效率模型(LUE)为基础,利用MODIS反射率数据(MOD09A1 C6)获取增强型植被指数(EVI)和地表水分指数(LSWI),结合NCEP 再分析气候数据和C4植被分布数据,估算了全球尺度的GPP。VPM GPP产品精度整体优于MODIS GPP产品。利用CO2 涡度相关通量数据对VPM GPP V20 验证,结果显示该数据集GPP模拟值与实测值R2达到0.74,均方根误差(RMSE)仅有2.08 g/(m2·a)[27]

1.3 研究方法

1) 土地利用变化分析方法。叠加2000年和2015年黄土高原100 m分辨率的土地利用数据,获得2000~2015年土地利用转移矩阵,进而提取耕地转为林地和草地的像元,得到退耕还林还草的空间分布范围。
2) GPP年际变化趋势分析方法。基于8 d和500 m分辨率的VPM GPP数据提取2000~2016年每年生长季内GPP总量,其中生长季定义为GPP > 1 g/(m2·a)对应的时期[28]。分析GPP年际变化特征,求解年GPP随时间变化的线性回归系数,通过斜率反映GPP的年际变化趋势(公式1)。线性回归的显著性水平设为0.05(P< 0.05),不通过显著性检验的像元不参与后续分析。结合GPP变化趋势(线性回归的斜率)和GPP多年均值,计算GPP年际相对变化率,从而得到每个像元GPP相对于自身平均水平的变化速率(公式2)。
θ slope = n × i = 1 n ( i × GP P i ) - i = 1 n i i = 1 n GP P i n × i = 1 n i 2 - ( i = 1 n i ) 2
式中, θ slope 表示GPP年际变化趋势,i表示年份数(由于时间范围是2000~2016年,故i的取值范围为1~17),GPPi表示第i年生长季内GPP总量,n表示累计年数(即17 a)。
δ = θ slope GPP ¯
式中, δ 表示GPP年际相对变化率(%), θ slope 表示GPP年际变化趋势, GPP ¯ 表示GPP 在2000~2016年的多年均值。
3) 退耕还林还草工程对GPP的影响分析方法。从3个方面对比分析退耕还林还草工程对GPP年际变化的影响:其一,计算所有退耕像元、未退耕像元以及黄土高原所有像元GPP年际变化速率的中值,比较这3类像元中值的相对大小;其二,统计这3类像元每年的GPP均值,并分别计算这3类像元GPP均值的年际变化速率;其三,随机选取2个相邻的退耕与未退耕像元,对比相邻像元(500 m)的GPP在2000~2015年的年际变化差异,同时对比相邻像元(30 m)的Landsat NDVI在1986~2018年的年际变化差异。

2 结果分析

2.1 2000~2015年黄土高原土地利用变化

草地与耕地广泛分布于整个黄土高原,而林地多分布于东南部,未利用地集中于西北部(图2a和图2b)。与2000年相比,2015年耕地与未利用地面积全区占比分别下降了1.67%和0.57%;而建设用地、林地与草地面积全区占比分别增加了1.60%、0.55%和0.08%。退耕还林还草面积约为3.5万km2,占2000年耕地的16.79%,占区域总面积的5.56%(表1)。退耕还林还草主要发生在黄土高原中部,尤其是在黄河中游段的西侧(陕西省)最为集中,还包括宁夏回族自治区南部、青海省的东部地区(图2c)。
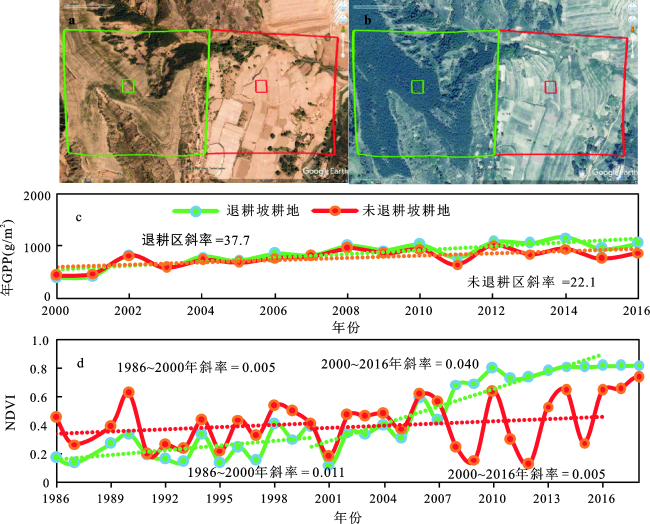
图2 黄土高原2000年(a)、2015年(b)土地利用图和2000~2015年退耕区(c)、未退耕区(d)的空间分布

Fig.2 The land use pattern in 2000 (a) and 2015 (b) and the extent of Grain for Green (GFG) area (c) and unconverted cropland (d) in the Loess Plateau from 2000 to 2015

表1 黄土高原2000~2015年土地利用转移矩阵(km2)

Table 1 The land use transfer matrix in the Loess Plateau from 2000 to 2015 (km2)

2015年 2000年
总计
耕地 林地 草地 水体 建设用地 未利用地
2000 年 耕地 160603 6048 28648 1395 9107 820 206621
林地 4090 78593 7458 216 698 417 91472
草地 25591 9371 215309 924 3303 4905 259404
水体 1242 174 886 5627 279 440 8649
建设用地 3078 156 617 81 10853 52 14837
未利用地 1610 532 6993 429 609 32778 42950
2015年总计 196214 94876 259910 8671 24850 39412 623933

2.2 2000~2016年黄土高原GPP年际变化

2000~2016年,黄土高原多年平均生长季内GPP总量为630.0 g/(m2·a)。GPP空间分布格局受降水量控制,呈现东南高西北低的特征(图3a)。期间,黄土高原GPP整体呈增加趋势,其中GPP显著上升(P<0.05)的像元面积占区域总面积的67.3%,平均增速为24.1 g/(m2·a),平均相对变化率为4.5%。这些像元多分布于黄河东西两侧的陕西与山西(图3b,3c)。与GPP年际趋势的空间格局不同,GPP相对变化率的高值区位于黄土高原西北部,而东南部的相对变化率较低(图3d),这是由于东南部GPP平均值远高于西北部,抵消了相对较高的GPP线性趋势(斜率)。
图3 黄土高原2000~2016年多年平均GPP(a)、GPP速率(b)、显著性水平(c)和相对变化率(d)

Fig.3 The multi-year averaged annual GPP (a), the trend of annual GPP (b), the significant level (c) and the relative change ratiod (d) in the Loess Plateau from 2000 to 2016

2.3 黄土高原退耕还林还草工程对GPP年际变化的影响

对比所有退耕像元、未退耕像元以及黄土高原所有像元GPP的均值和变化速率,发现退耕像元多年平均GPP(中值为545.2 g/m2)低于区域平均(中值为581.3 g/m2)和未退耕像元(中值为712.9 g/m2)(图4a)。退耕像元多由新转入的林草地构成,年龄较小,故生产力水平较低。但是,退耕像元GPP增长速率[中值为28.3 g/(m2·a)]却明显高于未退耕像元和区域所有像元[中值分别为22.4和22.1 g/(m2·a)](图4b)。GPP相对变化率在退耕像元、区域所有像元和未退耕像元中也呈现显著区别,相对变化率的中值依次为4.9%、3.6%和3.4%(图4c)。此外,对退耕区、未退耕区以及整个区域每年的GPP进行区域平均,进而分析这3个区域GPP年际变化的差异,也能得到类似的结果(图5)。综上,无论从像元尺度还是区域尺度,退耕区的GPP增速和相对变化率均高于未退耕区和区域整体水平。
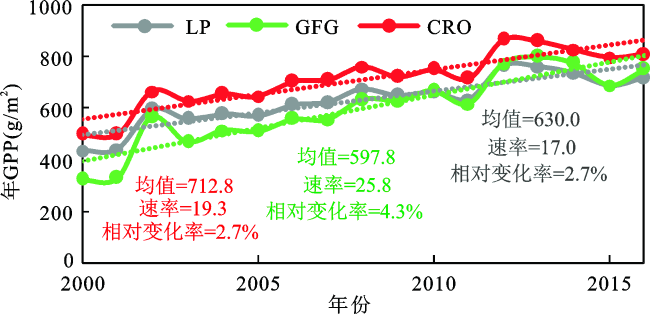
图4 黄土高原2000~2016年多年平均GPP(a)、GPP速率(b)和相对变化率(c)在整个区域、退耕区和未退耕区的差异

LP整个区域、GFG退耕区、CRO未退耕区

Fig.4 The difference of multi-year averaged annual GPP (a), the trend of annual GPP (b) and the relative change ratio of annual GPP (c) among the whole Loess Plateau, the Grain for Green area and the unconverted cropland in 2000-2016

图5 2000~2016年黄土高原整体区域、退耕还林还草区以及耕地未变化区平均GPP的年际变化

LP整个区域、GFG退耕区、CRO未退耕区;实线代表实际值,虚线代表线性拟合值

Fig.5 The inter-annual variability of the area-averaged GPP among the whole Loess Plateau, the Grain for Green area and the unconverted cropland from 2000 to 2016

为了进一步论证退耕还林还草工程对GPP的影响,在陕西省延安市随机选取了一对相邻的退耕与未退耕样地(109°12′36″E,36°34′48″N)。如图6a和6b所示,2003年,退耕像元(绿色框)布满了人工挖掘的育林坑(俗称鱼鳞坑),表明此像元内的坡耕地正在实施退耕还林工程,2015年,该像元内的坡耕地几乎全被森林覆盖。而未退耕像元(红色框)在2003年和2015年均为耕地。2000~2016年退耕样地GPP的年际增速比未退耕样地高15.6 g/(m2·a)(图6c)。同时,2000年以后退耕像元NDVI的年际增速明显高于2000以前(1986~2000年),而未退耕像元的NDVI增速在2000年前后并无差别(图6d)。典型样地的分析进一步证明了退耕还林工程对退耕区GPP的提速作用。
图6 典型退耕样地和未退耕样地GPP与NDVI的变化

a.2003年Google Earth 高分辨率影像;b.2015年Google Earth 高分辨率影像;c.2000~2016年相邻样地GPP的年际变化;d.1986~2018年相邻样地NDVI的年际变化(绿色为退耕样地,红色为未退耕样地);实线代表实际值,虚线代表线性拟合值

Fig.6 The inter-annual variability of the GPP and NDVI in two adjacent fields

3 讨论

3.1 土地利用变化过程识别的不确定性及未来展望

退耕还林还草是一个典型的土地利用变化(土地利用类型转换)过程,动态追踪退耕还林还草工程带来的地表生物物理性质的变化过程,准确识别退耕还林还草的空间范围,对于评估生态工程效益、分析土地利用变化的生态、水文与能量效应具有重要意义。本文通过叠加2000年和2015年的1:10万土地利用数据,提取退耕还林还草范围,具有较高的可信度。首先,中国科学院资源和环境数据中心1:10万中国土地利用数据整体精度较高(能达到90%),广泛用于不同尺度的土地利用变化研究[4,6,26]。其次,本文采用了2000年和2015年两期数据进行分析,较已有研究时间跨度更大,能更客观反映黄土高原累计退耕的成效。然而,由于两期数据均通过人机交互目视解译的方法在不同时间生产得到,对土地利用变化识别结果仍存在一定的不确定性。
准确识别土地利用变化,需要突破两期土地利用类型图静态叠加的方法,采用更有效的途径。一方面,基于多源遥感数据(如Landsat、MODIS、Sentinel、CBERS、HJ等)和高性能计算(如云计算),利用先进算法(如基于物候的算法、机器学习与深度学习等),实现土地利用动态变化的逐年连续自动监测[29]。另一方面,利用植被指数时间序列(NDVI、EVI、LAI序列等)和变化检测算法(例如BFAST和LandTrendr等),直接识别出不同土地利用变化类型[30,31,32],可能是未来提高土地利用变化过程认识的重要途径。

3.2 退耕还林还草工程的生态效应

GPP的年际变化受到人类活动(如退耕还林还草工程)和气候变化的共同影响。客观分析退耕还林还草工程对GPP的直接影响,需要剥离开气候变化的作用。已有研究多采用回归与残差分析探讨人类活动对生态系统的影响[8],残差分析基本能反映出各种人类活动作用的总和,但不能明确表现出退耕还林还草工程单独的作用。而本文采用了对比分析的思路,以未退耕区(即耕地未发生变化)为参考,比较退耕区与未退耕区GPP年际变化的差异,两者的差值就能体现出退耕还林还草工程的影响。并且本文比较了气候条件相同的相邻退耕与未退耕地块上GPP变化的差异,证实了区域尺度上像元统计分析的结果。
研究表明,退耕还林还草工程明显提高了退耕区GPP的增速,从而带动了区域整体GPP的增长。但是,GPP的变化并不能完全反映出黄土高原固碳能力的改变,结合NPP、NEP以及NPP的人类占用等,才能完整刻画出退耕还林还草工程对黄土高原碳循环的影响[11]。此外,在关注生态系统固碳功能的同时,还需考虑各种生态系统服务的权衡与协同[12],确定退耕还林还草的合理规模与阈值[33],最终实现区域可持续发展。

4 结论

本文利用2000年和2015年两期土地利用数据,准确识别出了黄土高原退耕还林还草面积。基于此,在像元、区域和样地3个尺度上对比分析了退耕区和未退耕区GPP年际变化的差异。退耕像元GPP增速的中值比未退耕像元高5.9 g/(m2·a),退耕区域年均GPP增速比未退耕区域高6.5 g/(m2·a)。此外,退耕样地2000年以后的NDVI增速显著高于2000年以前,NDVI增速高出0.03。空间和时间上的对比分析均表明,退耕还林还草工程促进了退耕区植被生长,提高了退耕区GPP的年际增速,进而带动了整个区域GPP的增长。
[1]
李秀彬 . 全球环境变化研究的核心领域-土地利用/土地覆被变化的国际研究动向[J]. 地理学报, 1996,51(6):553-558.

[ Li Xiubin . A review of the international researches on land use/land cover change. Acta Geographica Sinica, 1996,51(6):553-558.]

[2]
Foley Jonathan A, Defries Ruth, Asner Gregory P et al. Global consequences of land use[J]. Science, 2005,309:570-574.

[3]
Turner B L, Skole D, Sanderson S et al. Land-use and land-cover change: science/research plan [R]. IGBP Report No.35 and HDP Report No.7,Stovkholm and Geneva, 1995.

[4]
刘纪远, 匡文慧, 张增祥 , 等. 20世纪80年代末以来中国土地利用变化的基本特征与空间格局[J]. 地理学报, 2014,69(1):3-14.

[ Liu Jiyuan, Kuang Wenhui, Zhang Zengxiang et al. Spatiotemporal characteristics, patterns and causes of land use changes in China since the late 1980s. Acta Geographica Sinica, 2014,69(1):3-14.]

[5]
葛全胜, 赵名茶, 郑景云 . 20世纪中国土地利用变化研究[J]. 地理学报, 2000,55(6):698-706.

[ Ge Quansheng, Zhao Mingcha, Zheng Jingyun . Land use change of China during the 20th century. Acta Geographica Sinica, 2000,55(6):698-706.]

[6]
刘纪远, 宁佳, 匡文慧 , 等. 2010-2015年中国土地利用变化的时空格局与新特征[J]. 地理学报, 2018,73(5):789-802.

[ Liu Jiyuan, Ning Jia, Kuang Wenhui et al. Spatio-temporal patterns and characteristics of land-use change in China during 2010-2015. Acta Geographica Sinica, 2018,73(5):789-802.]

[7]
杨智奇, 董金玮, 徐新良 , 等. 黄土高原森林破碎化的基本特征与时空格局演变[J]. 资源科学, 2018,40(6):1246-55.

[ Yang Zhiqi, Dong Jinwei, Xu Xinliang et al. Spatiotemporal pattern of forest fragmentation in the Loess Plateau. Resources Science, 2018,40(6):1246-1255.]

[8]
易浪, 任志远, 张翀 , 等. 黄土高原植被覆盖变化与气候和人类活动的关系[J]. 资源科学, 2014,36(1):166-174.

[ Yi Lang, Ren Zhiyuan, Zhang Chong et al. Vegetation cover, climate and human activities on the Loess Plateau. Resources Science, 2014,36(1):166-174.]

[9]
Chen Yiping, Wang Kaibo, Lin Yishan et al. Balancing green and grain trade[J]. Nature Geoscience, 2015,8(10):739-741.

[10]
张翀, 王静, 雷田旺 , 等. 退耕还林工程以来黄土高原植被覆盖与地表湿润状况时空演变[J]. 干旱区研究, 2018,35(6):1468-1476.

[ Zhang Chong, Wang Jing, Lei Tianwang et al. Spatiotemporal evolution of vegetation cover and surface humidity since implementing the Grain for Green project in the Loess Plateau. Arid Zone Research, 2018,35(6):1468-1476.]

[11]
Feng Xiaoming, Fu Bojie, Lu Nan et al. How ecological restoration alters ecosystem services: an analysis of carbon sequestration in China's Loess Plateau[J]. Scientific Reports, 2013,3(2846):1-5.

[12]
Su Changhong, Fu Bojie . Evolution of ecosystem services in the Chinese Loess Plateau under climatic and land use changes[J]. Global and Planetary Change, 2013,101:119-128.

[13]
Restrepo Angela, Yang Yurong, Hamm Nicholas A et al. Land cover change during a period of extensive landscape restoration in Ningxia Hui Autonomous Region, China[J]. Science of the Total Environment, 2017,598:669-679.

[14]
Li Jingjing, Li Zhi, Zhemin . Analysis of spatiotemporal variations in land use on the Loess Plateau of China during 1986-2010[J]. Environmental Earth Sciences, 2016,75:997.

[15]
Guo Jing, Gong Peng . Forest cover dynamics from Landsat time-series data over Yan’an city on the Loess Plateau during the Grain for Green Project[J]. International Journal of Remote Sensing, 2016,37(17):4101-4118.

[16]
Fan Xingang, Ma Zhuguo, Yang Qing et al. Land use/land cover changes and regional climate over the Loess Plateau during 2001-2009. Part I: observational evidence[J]. Climatic Change, 2015,129(3-4):427-440.

[17]
Zhou Decheng, Zhao Shuqing, Zhu Chao . The Grain for Green Project induced land cover change in the Loess Plateau: A case study with Ansai County, Shanxi Province, China[J]. Ecological Indicators, 2012,23:88-94.

[18]
Sun Wenyi, Song Xiaoyan, Mu Xingmin et al. Spatiotemporal vegetation cover variations associated with climate change and ecological restoration in the Loess Plateau[J]. Agricultural and Forest Meteorology, 2015, ( 209-210):87-99.

[19]
Li Shuangshuang, Yang Saini, Liu Xianfeng et al. NDVI-based analysis on the influence of climate change and human activities on vegetation restoration in the Shaanxi-Gansu-Ningxia Region, Central China[J]. Remote Sensing, 2015,7(9):11163-11182.

[20]
杨延征, 赵鹏祥, 郝红科 , 等. 基于SPOT-VGT NDVI 的陕北植被覆盖时空变化[J]. 应用生态学报, 2012,23(7):1897-1903.

[ Yang Yanzheng, Zhao Pengxiang, Hao Hongke et al. Spatiotemporal variation of vegetation in northern Shaanxi of Northwest China based on SPOT-VGT NDVI. Chinese Journal of Applied Ecology, 2012,23(7):1897-1903.]

[21]
Zhou Hongjian, Rompaey Anton V . Detecting the impact of the “Grain for Green” program on the mean annual vegetation cover in the Shaanxi province, China using SPOT-VGT NDVI data[J]. Land Use Policy, 2009,26:954-960.

[22]
孙锐, 陈少辉, 苏红波 . 2000-2016年黄土高原不同土地覆盖类型植被NDVI时空变化[J]. 地理科学进展, 2019,8:1248-1258.

[ Sun Rui, Chen Shaohui, Su Hongbo . Spatiotemporal variations of NDVI of different land cover types on the Loess Plateau from 2000 to 2016. Progress in Geography, 2019,38(8):1248-1258.]

[23]
Xiao Jingfeng . Satellite evidence for significant biophysical consequences of the “Grain for Green” Program on the Loess Plateau in China[J]. Journal of Geophysical Research: Biogeosciences, 2014,119(12):2261-2275.

[24]
Wagle Pradeep, Xiao Xiangming, Margaret Torn et al. Sensitivity of vegetation indices and gross primary production of tallgrass prairie to severe drought[J]. Remote Sensing of Environment, 2014,152:1-14.

[25]
Wang Qixiang, Fan Xiaohui, Qin Zuodong et al. Change trends of temperature and precipitation in the Loess Plateau Region of China, 1961-2010[J]. Global and Planetary Change, 2012, 92-93:138-147.

[26]
刘纪远, 张增祥, 庄大方 , 等. 20世纪90年代中国土地利用变化时空特征及其成因分析[J]. 地理研究, 2003,22(1):1-12.

[ Liu Jiyuan, Zhang Zengxiang, Zhuang Dafang et al. A study on the spatial-temporal dynamic changes of land-use and driving forces analyses of China in the 1990s. Geographical Research, 2003,22(1):1-12.]

[27]
Zhang Yao, Xiao Xiangming, Wu Xiaocui et al. A global moderate resolution dataset of gross primary production of vegetation for 2000-2016[J]. Scientific Data, 2017,4:170165.

[28]
Dong Jinwei, Xiao Xiangming, Wagle Pradeep et al. Comparison of four EVI-based models for estimating gross primary production of maize and soybean croplands and tallgrass prairie under severe drought[J]. Remote Sensing of Environment, 2015,162:154-68.

[29]
Dong Jinwei, Kuang Wenhui, Liu Jiyuan . Continuous land cover change monitoring in the remote sensing big data era[J]. Science China-Earth Sciences, 2017,60(12):2223-2224.

[30]
Verbesselt Jan, Hyndman Rob, Newnham Glenn et al. Detecting trend and seasonal changes in satellite image time series[J]. Remote Sensing of Environment, 2010,114(1):106-115.

[31]
Cao Zhi, Li Yurui, Liu Yansui et al. When and where did the Loess Plateau turn “green”? Analysis of the tendency and breakpoints of the normalized difference vegetation index[J]. Land Degradation & Development, 2018,29(1):162-175.

[32]
Saxena R, Watson L T, Wynne R H et al. Towards a polyalgorithm for land use change detection[J]. ISPRS Journal of Photogrammetry and Remote Sensing, 2018,144, 217-234.

[33]
Feng Xiaoming, Fu Bojie, Piao Shilong et al. Revegetation in China’s Loess Plateau is approaching sustainable water resource limits[J]. Nature Climate Change, 2016,6(11):1019-1022.

文章导航

/