
内蒙古河套平原耕地盐碱化时空演变及其对产能的影响
|
王俊枝(1979-),女,内蒙古呼和浩特人,副高级工程师,硕士,主要从事测绘地理信息与遥感、测绘工程。E-mail:459564507@qq.com |
收稿日期: 2018-05-04
要求修回日期: 2018-08-20
网络出版日期: 2021-03-17
基金资助
内蒙古自治区科技重大专项资助
版权
Spatio-temporal Evolution of Saline-alkali Cultivated Land and Its Impact on Productivity in Hetao Plain of Inner Mongolia
Received date: 2018-05-04
Request revised date: 2018-08-20
Online published: 2021-03-17
Supported by
Science and Technology Major Projects in Inner Mongolia Autonomous Region
Copyright
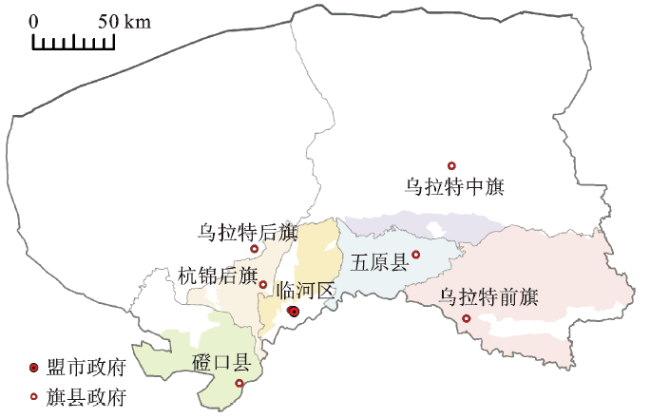
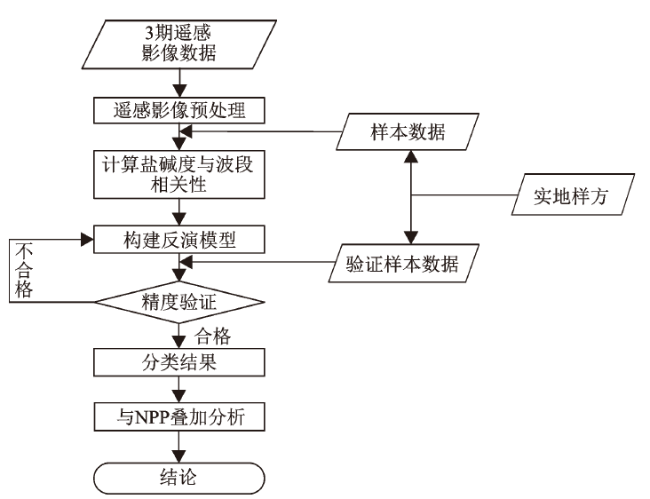
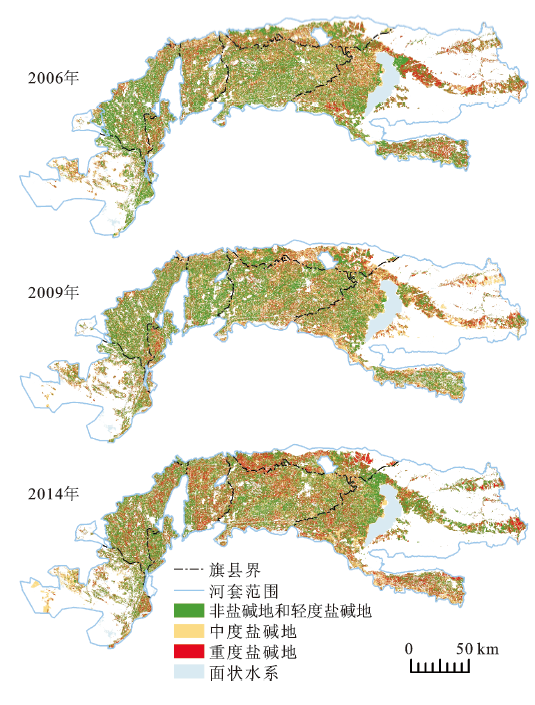
以内蒙古自治区巴彦淖尔市河套平原为研究区,利用RS和GIS技术在野外样本采集的基础上,以第一次地理国情普查数据和LandsatTM/OLI、GF-1卫星影像为数据源,通过计算盐碱度与波段的相关性构建出反演模型,以专家决策树进行分类,对2006~2014年耕地盐碱化进行动态监测,并分析了不同盐碱化程度农田植被净初级生产力(NPP)时空变化特征。结论表明:2006~2014年研究区域非盐碱耕地和轻度盐碱耕地面积呈现持续减少的趋势,减少幅度为6.23%,占耕地总面积的3.55%,NPP先增后降,减少了2.06%;中度盐碱耕地面积呈先降后增的趋势,净增加幅度为22.40%,占耕地总面积的5.10%,NPP先不变后增加,增加了6.73%;而重度盐碱耕地面积呈现先增后降的趋势,净减少7.68%,占耕地总面积的1.55%,NPP则持续增加,增加了3.81%。总体上看,9 a间虽然因为自然、人为因素的影响,中度盐碱耕地面积增长,但可利用土地面积和有效耕地面积不断增加,且改良区域的NPP处于持续增长的趋势,在一定程度上说明盐碱地治理取得了成效。
王俊枝 , 薛志忠 , 张弛 , 常屹冉 . 内蒙古河套平原耕地盐碱化时空演变及其对产能的影响[J]. 地理科学, 2019 , 39(5) : 827 -835 . DOI: 10.13249/j.cnki.sgs.2019.05.014
This study takes Hetao Plain of Inner Mongolia as the research area, based on the RS and GIS technical support and the field sample collection, and uses the China first national geoinformation survey data as the data source, constructs the inversion model through calculating the correlation between the salinity degree and the band, classifies it with expert decision tree, and carries out dynamic monitoring of cultivated land salinization-alkalization in 2006-2014, and analyzes the spatio-temporal characteristics of NPP in different salinization-alkalization degree of cultivated land. The results shows that: Between 2006-2014, the non-saline-alkali cultivated land and the light-saline-alkali cultivated land in the study area showed a decreasing trend, with a reduction of 6.23%, that accounts for 3.55% of the total area of cultivated land. During this period, NPP increases first and then decreases, with a reduction of 2.06%. The medium-saline-alkali cultivated land showed a trend of first decline and then increase, with a net increase of 22.40%, that accounts for 5.10% of the total area of cultivated land. During this period, NPP changed none first and then increased, with a increase of 6.73%. The severe-saline-alkali cultivated land showed a trend of increase first and then decline, with a net decline of 7.68%, that accounts for 1.55% of the total area of cultivated land. During this period, NPP continued to increase, with a increase of 3.81%. In general, although the area of medium-saline-alkali cultivated land increased in nine years because of natural and artificial factors, the available land area and effective cultivated land increased continuously, and the NPP in the improved area shows a trend of continuous growth. The results shows that the control of saline-alkali land has achieved success to a certain extent.
Key words: cultivated land salinization-alkalization; RS; GIS; NPP; Hetao Plain
表1 水溶性盐分与波段DN值间的相关性分析Table 1 Correlation analysis between water-solubility salinity and band DN value |
| Band1 | Band2 | Band3 | Band4 | Band5 | Band7 | |
|---|---|---|---|---|---|---|
| 皮尔森(Pearson)相关 | 0.441 | 0.275 | 0.491 | -0.104 | 0.671 | 0.593 |
| 显著性(双尾) | 0.001 | 0.05 | 0.001 | 0.05 | 0.001 | 0.001 |
| 样本数 | 1378 | 1378 | 1378 | 1378 | 1378 | 1378 |
表2 盐碱耕地监测模型精度评价与分类精度验证结果表Table 2 The monitoring model, accuracy evaluation and classification accuracy verification results of saline-alkali cultivated land |
| 年份 | 盐碱类型 | 模型精度评价 | 分类精度 |
|---|---|---|---|
| 2006年 | 钙化 | R=0.9145,F=216.085>1 | 通过验证样点验证,2006年模型总体精度为78.1% |
| 潮化 | R=0.8813,F=23.2099>1 | ||
| 2009年 | 钙化 | R=0.9467,F=217.9>1 | 通过验证样点验证,2009年模型总体精度为77.6% |
| 潮化 | R=0.8688,F=8.712>1 | ||
| 2014年 | 钙化 | R=0.9353,F=227.9>1 | 通过验证样点验证,2014年模型总体精度为83.6% |
| 潮化 | R= 0.9417,F=127.8>1 |
表3 研究区不同年份各类型盐碱耕地面积变化(km2)Table 3 Changes of saline-alkali cultivated land acreage in study area in different years (km2) |
| 盐碱耕地类型 | 2006年 | 2009年 | 2014年 | 2006~2009年 | 2009~2014年 |
|---|---|---|---|---|---|
| 非和轻度 | 4468.34 | 4338.33 | 4266.23 | -130.02 | -72.1 |
| 中度 | 1784.86 | 1777.6 | 2224.47 | -7.26 | 446.86 |
| 重度 | 1578.62 | 1768.01 | 1484 | 189.39 | -284 |
| 耕地面积 | 7831.82 | 7883.94 | 7974.7 | 52.12 | 90.76 |
表4 2006~2014年不同程度盐碱化耕地面积变化的转移矩阵(km2)Table 4 The transfer matrix of changes of saline-alkali arable land area in different degrees in 2006-2014(km2) |
| 2009年 | 2006年 | ||||||
|---|---|---|---|---|---|---|---|
| 非和轻度盐碱耕地 | 中度盐碱耕地 | 重度盐碱耕地 | 耕地增加 | 2009年总面积 | |||
| 非和轻度盐碱耕地 | 2835.03 | 868.14 | 567.11 | 68.05 | 4338.33 | ||
| 中度盐碱耕地 | 866.90 | 494.38 | 363.97 | 52.35 | 1777.60 | ||
| 重度盐碱耕地 | 678.99 | 392.68 | 585.40 | 110.93 | 1768.00 | ||
| 耕地减少 | 89.13 | 30.10 | 59.87 | ||||
| 2006年总面积 | 4470.05 | 1785.31 | 1576.35 | ||||
| 2014年 | 2009年 | ||||||
| 非和轻度盐碱耕地 | 中度盐碱耕地 | 重度盐碱耕地 | 耕地增加 | 2014年总面积 | |||
| 非和轻度盐碱耕地 | 2362.11 | 1000.39 | 847.03 | 56.68 | 4266.21 | ||
| 中度盐碱耕地 | 1284.04 | 486.76 | 424.93 | 28.71 | 2224.44 | ||
| 重度盐碱耕地 | 646.50 | 263.30 | 474.77 | 99.42 | 1483.99 | ||
| 耕地减少 | 45.69 | 27.15 | 21.27 | ||||
| 2009年总面积 | 4338.33 | 1777.60 | 1768.00 | ||||
| 2014年 | 2006年 | ||||||
| 非和轻度盐碱耕地 | 中度盐碱耕地 | 重度盐碱耕地 | 耕地增加 | 2014年总面积 | |||
| 非和轻度盐碱耕地 | 2448.12 | 966.87 | 755.36 | 95.87 | 4266.21 | ||
| 中度盐碱耕地 | 1254.16 | 533.80 | 367.02 | 69.47 | 2224.44 | ||
| 重度盐碱耕地 | 671.64 | 253.00 | 413.00 | 146.34 | 1483.99 | ||
| 耕地减少 | 96.13 | 31.64 | 40.97 | ||||
| 2006年总面积 | 4470.05 | 1785.31 | 1576.35 | ||||
表5 2006~2014年不同程度盐碱化耕地NPP平均值[gC/m2·a]Table 5 The NPP mean value of varying degrees saline-alkali cultivated land in 2006-2014 [gC/(m2·a)] |
| 年份 | 区域 | 非盐碱化和轻度 | 中度 | 重度 |
|---|---|---|---|---|
| 2006年 | 磴口县 | 593.640 | 502.177 | 453.980 |
| 杭锦后旗 | 692.211 | 649.950 | 561.806 | |
| 临河区 | 637.908 | 595.961 | 502.713 | |
| 乌拉特前旗 | 444.829 | 422.317 | 388.870 | |
| 乌拉特中旗 | 465.740 | 422.204 | 350.445 | |
| 五原县 | 538.983 | 512.096 | 505.457 | |
| 河套平原 | 552.508 | 495.437 | 448.838 | |
| 2009年 | 磴口县 | 550.609 | 490.176 | 455.439 |
| 杭锦后旗 | 677.877 | 646.070 | 593.785 | |
| 临河区 | 609.643 | 608.873 | 539.802 | |
| 乌拉特前旗 | 498.913 | 395.664 | 378.981 | |
| 乌拉特中旗 | 491.689 | 437.509 | 396.170 | |
| 五原县 | 538.063 | 520.718 | 491.190 | |
| 河套平原 | 558.409 | 495.225 | 453.230 | |
| 2014年 | 磴口县 | 536.625 | 530.569 | 411.932 |
| 杭锦后旗 | 681.166 | 672.317 | 641.847 | |
| 临河区 | 633.555 | 628.849 | 585.067 | |
| 乌拉特前旗 | 461.022 | 460.726 | 421.898 | |
| 乌拉特中旗 | 469.495 | 459.895 | 422.284 | |
| 五原县 | 515.753 | 510.930 | 489.478 | |
| 河套平原 | 541.124 | 528.764 | 465.918 |
| [1] |
亢庆, 于嵘, 张增祥, 等. 土壤盐碱化遥感应用研究进展[J]. 遥感技术与应用, 2005,20(4):447-454.
[
|
| [2] |
李建国, 濮励杰, 朱明, 等. 土壤盐渍化研究现状及未来研究热点[J]. 地理学报, 2012,67(9):1233-1245.
[
|
| [3] |
王佳丽, 黄贤金, 钟大洋, 等. 盐碱地可持续利用研究综述[J]. 地理学报, 2011,66(5):673-684.
[
|
| [4] |
申文明, 王文杰, 罗海江, 等. 基于决策树分类技术的遥感影像分类方法研究[J]. 遥感技术与应用, 2007,22(3):333-338.
[
|
| [5] |
李彤, 吴骅. 采用决策树分类技术对北京市土地覆盖现状进行研究[J]. 遥感技术与应用, 2004,19(6):485-487.
[
|
| [6] |
延森. 遥感数字影像处理导论(原书第3版).Jensen, J R著.陈晓玲等译[M]. 北京: 机械工业出版社, 2007.
[
|
| [7] |
薄树奎, 丁琳. 训练样本数目选择对面向对象影像分类方法精度的影响[J]. 中国图象图形学报, 2010,15(7):1106-1111.
[
|
| [8] |
|
| [9] |
|
| [10] |
|
| [11] |
|
| [12] |
|
| [13] |
|
| [14] |
|
| [15] |
关元秀, 刘高焕, 刘庆生, 等. 黄河三角洲盐碱地遥感调查研究[J]. 遥感学报, 2001,5(1):46-52.
[
|
| [16] |
邓小炼, 于嵘, 亢庆 等. 基于遥感的黄河三角洲地区盐碱地分布监测[J]. 遥感信息, 2006,5:34-36.
[
|
| [17] |
骆玉霞, 陈焕伟. GIS支持下的TM图像土壤盐碱化分级[J]. 遥感信息, 2001(4):12-15.
[
|
| [18] |
陈静清, 闫慧敏, 王绍强, 等. 中国陆地生态系统总初级生产力VPM遥感模型估算[J]. 第四纪研究, 2014,34(4):732-742.
[
|
| [19] |
匡文慧, 闫慧敏, 张树文, 等. 呼伦贝尔农垦集团草畜平衡状况与粮经饲配置模式[J]. 科学通报, 2018,17:1711-1721.
[
|
| [20] |
苏日古嘎, 苏根成, 闫慧敏, 等. 21世纪以来呼伦贝尔市植被净初级生产力时空变化特征分析[J]. 干旱区资源与环境, 2017,31(10):150-155.
[
|
| [21] |
巩国丽, 刘纪远, 邵全琴. 草地覆盖度变化对生态系统防风固沙服务的影响分析—以内蒙古典型草原为例[J]. 地球信息科学, 2014,16(3):426-434.
[
|
| [22] |
牛忠恩, 闫慧敏, 黄玫, 等. 基于MODIS-OLI遥感数据融合技术的农田生产力估算[J]. 自然资源学报, 2016,31(5):875-884.
[
|
| [23] |
冀咏赞, 闫慧敏, 刘纪远, 等. 基于MODIS数据的中国耕地高中低产田空间分布格局[J]. 地理学报, 2015,70(5):766-778.
[
|
| [24] |
吴成东, 许可, 韩中华, 等. 基于粗糙集和决策树的数据挖掘方法[J]. 东北大学学报, 2006,27(5):481-484.
[
|
| [25] |
乔梅, 韩文秀. 基于Rough集的决策树算法[J]. 天津大学学报, 2005,38(9):842-846.
[
|
| [26] |
周兴东, 于胜文, 赵长胜, 等. 利用遥感图像进行土地利用分类方法的研究[J]. 煤炭学报, 2007,32(5):481-484.
[
|
| [27] |
杨静, 张楠男, 李建. 决策树算法的研究与应用[J]. 计算机技术与发展, 2010(2):114-116.
[
|
| [28] |
柯新利, 边馥苓. 基于C5.0决策树算法的元胞自动机土地利用变化模拟模型[J]. 长江流域资源与环境, 2010,19(4):403-408.
[
|
| [29] |
汪海锐, 李伟. 基于关联规则的决策树算法[J]. 计算机工程, 2011,37(9):104-106.
[
|
| [30] |
孙娟, 王熙照. 自适应模糊决策树算法[J]. 计算机工程与设计, 2013,34(2):649-653.
[
|
| [31] |
|
| [32] |
汪炜, 汪云甲, 连达军. 基于决策树分类的某市土地利用变化研究[J]. 测绘标准化, 2011,27(1):4-7.
[
|
/
| 〈 |
|
〉 |