
基于点评数据的武汉市餐饮发展水平空间差异
|
杜晓初(1972−),男,湖北武汉人,博士,副教授,主要从事GIS与城市地理研究。E-mail: duxiaochu@hubu.edu.cn |
收稿日期: 2020-04-02
网络出版日期: 2021-10-11
基金资助
湖北省技术创新专项重大项目(2018ABA078)资助
版权
Spatial Difference of Catering Industry Development Level Based on Online Public Data in Wuhan
Received date: 2020-04-02
Online published: 2021-10-11
Supported by
Major Projects of Technological Innovation in Hubei Province (2018ABA078)
Copyright
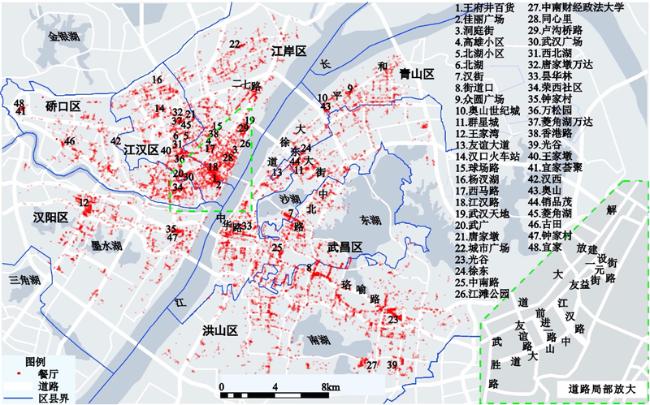
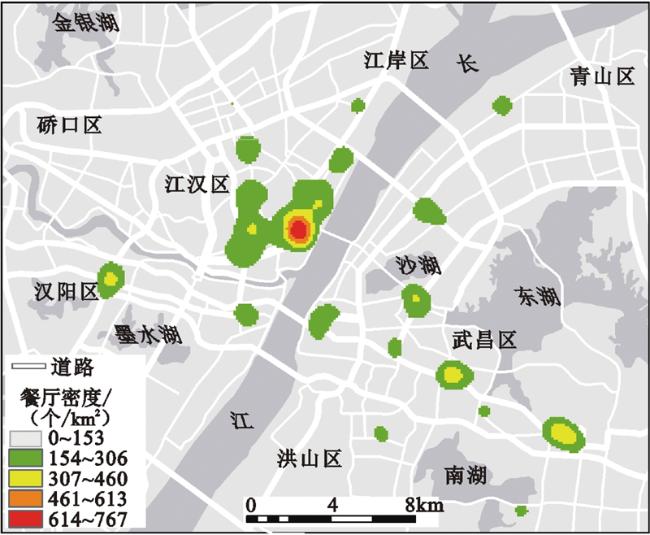
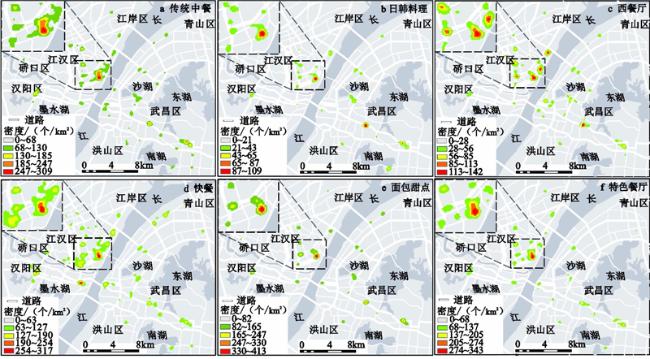
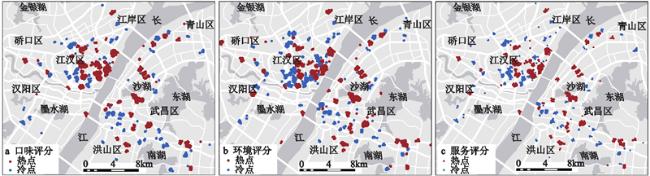
基于网络点评数据,采用核密度分析、空间自相关分析等空间统计方法,分析武汉市主城区餐饮行业聚集特征以及餐饮发展水平的空间差异及其影响因素。主要结论如下:① 武汉市餐饮类型丰富,同时也保持较明显的地方特色,不同类型餐饮人均消费差异明显;② 顾客对武汉餐饮口味、环境和服务3种评分总体得分较好,对这3个方面的服务满意程度排序为口味>服务>环境,3种评分与人均消费都存在显著的正相关;③ 三环内餐厅高密度分布区主要沿轨道交通线分布,并与各商圈高度相关,餐饮满意度评价的3种评分都存在显著的聚集;④ 3种评分热点分布区大多保持一致,且3种评分的热点数较为均衡,主要分布在传统商业与住宅混合区以及重要商业设施及其周边;⑤ 3种评分冷点区的分布有一致也有不一致,冷点数有明显差异,主要分布在火车站、医院和学校周边以及老旧和偏远小区附近。
杜晓初 , 李中元 , 陈潇 . 基于点评数据的武汉市餐饮发展水平空间差异[J]. 地理科学, 2021 , 41(8) : 1389 -1397 . DOI: 10.13249/j.cnki.sgs.2021.08.010
Based on online public data, spatial clustering characteristic, spatial difference and influence factors of catering industry development level are analyzed by some spatial statistic methods such as kernel density estimation and spatial autocorrelation index. The main conclusions are as follows. At first, there are plenty of types of restaurants in Wuhan, the catering maintain obvious local flavor, and there are apparent differences among different types of restaurant. Secondly, customers in Wuhan have given good scores to all three index taste, environment and service, in terms of sorting, the taste score is larger than service score and service score is larger than environment score. Furthermore, all of the three scores have significant positive correlation with consumption price per capita. Thirdly, the high density area of catering service point distribution is along with rail transit line in Wuhan, and has highly related with business circles. At the same time, the three scores of catering service satisfaction have significant spatial aggregation. Fourthly, the hotspot distribution areas of the three scores, which mainly distribute in the traditional commercial and residential mixed areas and surrounding areas of important commercial facilities, are consistent overall, and the number of three types of hotspots is roughly equal. At last, some of the cold spot distribution areas of the three scores are consistent and some of them are not consistent. These cold spots mainly distribute around railway stations, hospitals and schools and old and remote community, and the number of cold spots is different obviously. The research results of this article could give some advices to urban planning, site selection of catering service point and smart travel for consumers.
Key words: online public data; catering industry development level; Wuhan
表 1 2019年武汉城区餐厅顾客满意度评分统计表Table 1 Statistic results of customer satisfaction score about restaurants in Wuhan in 2019 |
| 评分类别 | 极小值 | 极大值 | 众数 | 中值 | 均值 | 偏度 | 峰度 | 标准差 |
| 口味评分 | 5.4 | 9.3 | 6.9 | 7.2 | 7.331 | 1.157 | 1.633 | 0.4987 |
| 环境评分 | 4.7 | 9.4 | 6.9 | 7.2 | 7.316 | 1.229 | 1.781 | 0.5456 |
| 服务评分 | 5.2 | 9.4 | 6.9 | 7.2 | 7.322 | 1.186 | 1.868 | 0.5147 |
表 2 2019年不同类型餐饮间的同位商指数值Table 2 CLQ values between two different types of restaurants in 2019 |
| 传统中餐 | 日韩料理 | 西餐 | 快餐 | 面包甜点 | 特色美食 | |
| 传统中餐 | 1.331 | — | 0.809 | 0.824 | 0.769 | — |
| 日韩料理 | — | 1.281 | 0.803 | 0.923 | 0.784 | — |
| 西餐 | 0.817 | 0.819 | 2.454 | 0.756 | 1.124 | 1.537 |
| 快餐 | 0.778 | 0.911 | 0.765 | 1.485 | 0.916 | 0.717 |
| 面包甜点 | 0.772 | 0.827 | 1.264 | 0.920 | 1.627 | 1.346 |
| 特色美食 | — | — | 1.453 | 0.706 | 1.256 | 2.420 |
注:—表示2种类型间的同位关系不显著;加黑数字表示聚集或存在同位关系。 |
| [1] |
Pillsburg R. From hamburger alley to hedgerose heights: Toward a model of restaurant location dynamics[J]. The Professional Geographer, 1987, 39 (3): 326- 344.
|
| [2] |
Austin S, Melly S, Sanchez B et al. Clustering of fast-food restaurants around schools: A novel application of spatial statistics to the study of food environments[J]. American Journal of Public Health, 2005, 95 (9): 1575- 1581.
|
| [3] |
Sadahiro Y. Spatiotemporal analysis of the distribution of urban facilities in terms of accessibility[J]. Papers in Regional Science, 2005, 84 (1): 61- 84.
|
| [4] |
Buck C, Börnhorst C, Pohlabeln H et al. Clustering of unhealthy food around german schools and its influence on dietary behavior in school children: A pilot study[J]. International Journal of Behavioral Nutrition & Physical Activity, 2013, 10, 65- 74.
|
| [5] |
方嘉雯. 北京五道口地区韩国餐饮业空间布局特征与集聚机理分析[J]. 经济地理, 2014, 34 (12): 106- 113.
Fang Jiawen. The distribution characteristics and clustering mechanism of korean catering service in Wudaokou District, Beijing[J]. Economic Geography, 2014, 34 (12): 106- 113.
|
| [6] |
秦萧, 甄峰, 朱寿佳, 等. 基于网络口碑度的南京城区餐饮业空间分布格局研究——以大众点评网为例[J]. 地理科学, 2014, 34 (7): 810- 817.
Qin Xiao, Zhen Feng, Zhu Shoujia et al. Spatial pattern of catering industry in Nanjing urban area based on the degree of public praise from internet: A case study of Dianping.com[J]. Scientia Geographica Sinica, 2014, 34 (7): 810- 817.
|
| [7] |
谭欣, 黄大全, 赵星烁. 北京市主城区餐厅空间分布格局研究[J]. 旅游学刊, 2016, 31 (2): 75- 85.
Tan Xin, Huang Daquan, Zhao Xingshuo. A study on the spatial distribution pattern of restaurants in Beijing’s main urban area[J]. Tourism Tribune, 2016, 31 (2): 75- 85.
|
| [8] |
梅林, 韩蕾. 中国星级酒店空间分布与影响因子分析[J]. 经济地理, 2011, 31 (9): 1580- 1584.
Mei Lin, Han Lei. A study into the factors influencing the spatial distribution of Star-Rated Hotels in China[J]. Economic Geography, 2011, 31 (9): 1580- 1584.
|
| [9] |
邬伦, 刘亮, 田原, 等. 基于网络函数法的地理对象分布模式分析——以香港岛餐饮业空间格局为例[J]. 地理与地理信息科学, 2013, 29 (5): 7- 11.
Wu Lun, Liu Liang, Tian Yuan et al. Spatial pattern analysis of geographic features using network -function methods with a case study of restaurant distribution in Hong Kong Island[J]. Geography and Geo-Information Science, 2013, 29 (5): 7- 11.
|
| [10] |
涂建军, 唐思琪, 张骞, 等. 山地城市格局对餐饮业区位选择影响的空间异质性[J]. 地理学报, 2019, 74 (6): 1163- 1177.
Tu Jianjun, Tang Siqi, Zhang Qian et al. Spatial heterogeneity of the effects of mountains city pattern on catering industry location[J]. Acta Geographica Sinica, 2019, 74 (6): 1163- 1177.
|
| [11] |
张旭, 徐逸伦. 南京市餐饮设施空间分布及其影响因素研究[J]. 热带地理, 2009, 29 (4): 362- 367.
Zhang Xu, Xu Yilun. Study on the distribution in space of urban caterings and its influencing factors: A case study of Nanjing[J]. Tropical Geography, 2009, 29 (4): 362- 367.
|
| [12] |
梁璐. 城市餐饮业的空间格局及其影响因素分析——以西安市为例[J]. 西北大学学报(自然科学版), 2007, 37 (6): 925- 930.
Liang Lu. The distribution in space of urban catering and its factors: Xi’an as an example[J]. Journal of Northwest University (Natural Science Edition), 2007, 37 (6): 925- 930.
|
| [13] |
舒舍玉, 王润, 孙艳伟, 等. 城市餐饮业的空间格局及影响因素分析——以厦门市为例[J]. 热带地理, 2012, 32 (2): 134- 140.
Shu Sheyu, Wang Run, Sun Yanwei et al. Spatial distribution of urban catering industry and its influenced factors: A case study of Xiamen City[J]. Tropical Geography, 2012, 32 (2): 134- 140.
|
| [14] |
曾媛, 吴国清. 上海中心城区餐饮网点空间格局及影响因素[J]. 城市学刊, 2019, 40 (5): 56- 62.
Zeng Yuan, Wu Guoqing. Spatial pattern of catering outlets in the central city of Shanghai and its influencing factors[J]. Journal of Urban Studies, 2019, 40 (5): 56- 62.
|
| [15] |
吴立周, 权东计, 朱海霞. 西安城区餐饮老字号空间格局及其影响因素研究[J]. 世界地理研究, 2017, 26 (5): 105- 114.
Wu Lizhou, Quan Dongji, Zhu Haixia. Study on the spatial distribution of Time-honored Catering Brand and its influencing factors in Xi’an[J]. World Regional Studies, 2017, 26 (5): 105- 114.
|
| [16] |
薛冰, 肖骁, 李京忠, 等. 基于POI大数据的沈阳市住宅与零售业空间关联分析[J]. 地理科学, 2019, 39 (3): 442- 449.
Xue Bing, Xiao Xiao, Li Jingzhong et al. POI based spatial correlation of the residences and retail industry in Shenyang City[J]. Scientia Geographica Sinica, 2019, 39 (3): 442- 449.
|
| [17] |
李建国, 袁冯伟, 赵宴青, 等. 中国东部沿海地区暴雨对植被活动的影响[J]. 地理科学, 2020, 40 (2): 324- 334.
Li Jianguo, Yuan Fengwei, Zhao Yanqing et al. Effect of rainstorms on vegetation activities in eastern coastal area of China[J]. Scientia Geographica Sinica, 2020, 40 (2): 324- 334.
|
| [18] |
Silverman B W. Density estimation for statistics and data analysis[M]. London, UK: Chapman Hall, 1986.
|
| [19] |
Bailey T C, Gatrell A C. Interactive spatial data analysis[M]. Harlow, UK: Longman Scientific, 1995.
|
| [20] |
Leslie T F, Kronenfeld B J. The colocation quotient: A new measure of spatial association between categorical subsets of points[J]. Geographical Analysis, 2011, 43, 306- 326.
|
| [21] |
Yue H, Zhu X, Ye X et al. The local colocation patterns of crime and land-use features in Wuhan, China[J]. ISPRS International Journal of Geo-Information, 2017, 6, 307.
|
| [22] |
Cromley R G, Hanink D M, Bentley G C. Geographically weighted colocation quotients: Specification and application[J]. The Professional Geographer, 2014, 66 (1): 138- 148.
|
| [23] |
Wang F, Hu Y, Wang S et al. Local indicator of colocation quotient with a statistical significance test: Examining spatial association of crime and facilities[J]. The Professional Geographer, 2017, 69 (1): 22- 31.
|
| [24] |
Moran P A. The interpretation of statistical maps[J]. Journal of the Royal Statistician, 1948, 5, 115- 145.
|
| [25] |
张向敏, 罗燊, 李星明, 等. 中国空气质量时空变化特征[J]. 地理科学, 2020, 40 (2): 190- 199.
Zhang Xiangmin, Luo Shen, Li Xingming et al. Spatio-temporal variation features of air quality in China[J]. Scientia Geographica Sinica, 2020, 40 (2): 190- 199.
|
| [26] |
Getis A, Ord J K. The analysis of spatial association by use of distance statistics[J]. Geographical Analysis, 1992, 24, 189- 206.
|
| [27] |
Ord J K, Getis A. Local spatial autocorrelation statistics: Distributional issues and an application[J]. Geographical Analysis, 1995, 27, 286- 306.
|
| [28] |
冯喆, 蒋洪强, 卢亚灵. 基于大数据方法和SOFM聚类的中国经济−环境综合分区研究[J]. 地理科学, 2019, 39 (2): 242- 251.
Feng Zhe, Jiang Hongqiang, Lu Yaling. China’s economic-environment comprehensive zoning based on big data method and SOFM clustering[J]. Scientia Geographica Sinica, 2019, 39 (2): 242- 251.
|
/
| 〈 |
|
〉 |