
基于随机森林与特征选择的藏东南土地覆被分类方法及精度评价
|
张炳华(1991—),女,山东潍坊人,博士研究生,主要从事土地覆被变化、环境遥感研究。E-mail: zhangyl@igsnrr.ac.cn |
收稿日期: 2022-01-06
修回日期: 2022-04-17
网络出版日期: 2023-03-20
基金资助
第二次青藏高原综合科学考察研究项目(2019QZKK0603)
中国科学院战略性先导科技专项(XDA20040201)
版权
Land cover classification based on random forest and feature optimism in the Southeast Qinghai-Tibet Plateau
Received date: 2022-01-06
Revised date: 2022-04-17
Online published: 2023-03-20
Supported by
The Second Tibetan Plateau Scientific Expedition and Research(2019QZKK0603)
Strategic Priority Research Program of the Chinese Academy of Sciences(XDA20040201)
Copyright
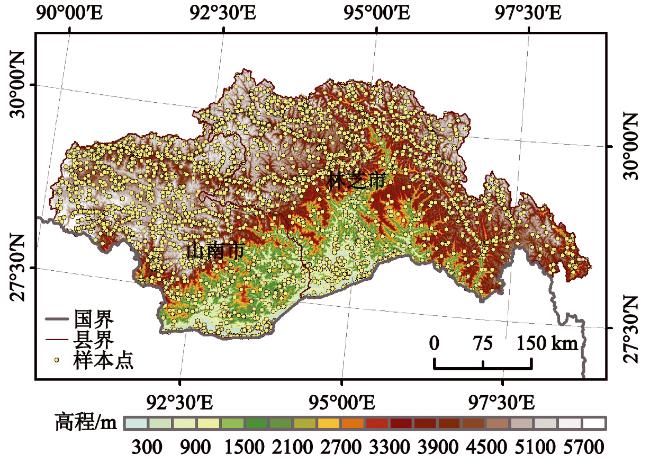
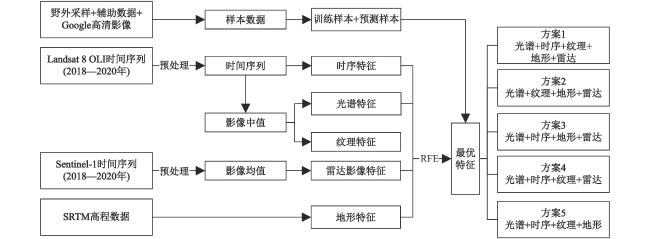
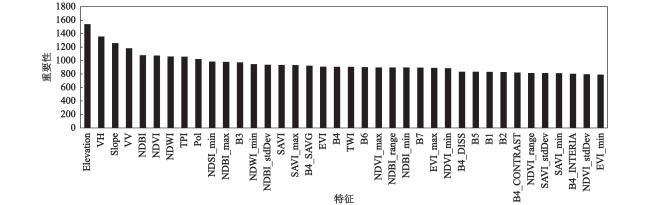
由于云污染、实地验证点的匮乏,以及地形地貌的复杂、破碎化,多云山区土地覆被的准确分类较难实现。以藏东南这一典型的多云山区及生态过渡区为研究区,基于Google Earth Engine(GEE)平台和野外实测数据,结合多光谱数据、雷达数据、高程数据、辅助数据,提取光谱特征、纹理特征、地形特征等信息,利用递归特征消除法对特征进行优化,并采用随机森林算法构建分类模型,以期有效利用多源遥感数据提高土地覆被分类精度。结果表明:① 并非特征越多分类精度越高,特征选择后数量由58个减至38个,分类精度(总体精度93.96%,Kappa系数0.92)较未优化前(总体精度93.11%,Kappa系数0.92)略有提升。② 地形特征及雷达特征对藏东南土地覆被分类具有重要作用,地形特征对多数土地覆被类型的分类精度具有影响,而雷达数据对裸地、建设用地、灌丛影响较大,分类过程中如不考虑地形及雷达特征,总体精度分别降至88.98%,92.48%。纹理特征以及时序特征仅对提高具有明显纹理以及时序变化的土地覆被类型的精度有帮助。结合随机森林和特征优化算法,能够在保证土地覆被分类精度的同时,高效整合多源数据信息,加快模型运算速度,为多云山区土地覆被分类提供切实可行的方法。
关键词: 随机森林; 土地覆被分类; Google Earth Engine (GEE)平台; 特征优化; 藏东南
张炳华 , 张镱锂 , 谷昌军 , 魏博 . 基于随机森林与特征选择的藏东南土地覆被分类方法及精度评价[J]. 地理科学, 2023 , 43(3) : 388 -397 . DOI: 10.13249/j.cnki.sgs.2023.03.002
Obtaining accurate land cover information in cloudy mountain areas are severely impacted by cloud contaminations, the scarcity of field validation points, and the complexity and fragmentation of landforms. Taken the Southeast Qinghai-Tibet Plateau, a typical cloudy mountainous area and ecological transition zone, as study area, this research first extract the spectral features, radar features, textual features, topographic features through the spectral data, radar data, DEM data and auxiliary data based on the Google Earth Engine and filed observed data. Then we built the random forest model and made feature reduction using recursive feature elimination, in order to improve the accuracy of land cover classification by using multi-source remote sensing data effectively. Results showed that: 1) The feature numbers reduced from 58 to 38 after feature optimization, classification accuracy (overall accuracy 93.96%, Kappa coefficient 0.92) slightly improved compared to unoptimized (overall accuracy 93.11%, Kappa coefficient 0.92); 2) Topographic and radar features played an essential role in the land cover classification of mountainous cloudy areas. If the topographic features and radar feature were excluded, accuracies would decrease to 88.98% and 92.48%, respectively. Topographic features would influence the classification accuracy of most land cover types, while radar features had more impacts on bare lands, construction lands, and shrublands. Textual features and sequential features could only help to increase the accuracy of land cover type with significant textual features and temporal variations. More accurate land cover information can be detected by combing the random forest and feature optimization algorithm, while also provide a more efficient and faster way of integrating multisource data, thus making contribution to land cover classification of the cloudy and mountainous area.
表1 本研究采用指数反演公式及含义解释Table 1 Formulas used in this study and their explanations |
| 指数 | 指数反演公式 | 指数含义解释 | 文献 |
| 注:NIR,近红外波段;MIR,中红外波段;SWIR,短波红外波段; | |||
| 归一化植被指数(NDVI) | | 表征植被生长状态和植被覆盖度的重要参数。研究输入:中值,max,min,range,stdDev | [28] |
| 归一化水体指数(NDWI) | | 用于水体信息的提取,能在一定程度上抑制植被信息。研究输入:中值,max,min,range,stdDev | [29] |
| 归一化建筑指数(NDBI) | | 用于提取建设用地信息。研究输入:中值,max,min,range,stdDev | [30] |
| 土壤调节植被指数(SAVI) | | 降低土壤背景对植被的影响。研究输入:中值,max,min,range,stdDev | [31] |
| 增强植被指数(EVI) | | 相比NDVI,对冠层结构、生物量高值区更为敏感。研究输入:中值,max,min,range,stdDev | [32] |
| 积雪指数(NDSI) | | 用于分辨积雪。研究输入:min | [33] |
| 归一化极化指数(Pol) | | 对粗糙表面、植被结构、生物量有较好的敏感性,可用于区别裸地以及森林。输入:平均值 | [34] |
| 地形位置指数(TPI) | | 代表某点相对于周边的相对高度,可以用来描绘低洼的地形 | [35] |
| 地形湿度指数(TWI) | | 代表某点的相对土壤湿度。值越高说明潜在土壤湿度更高 | [36] |
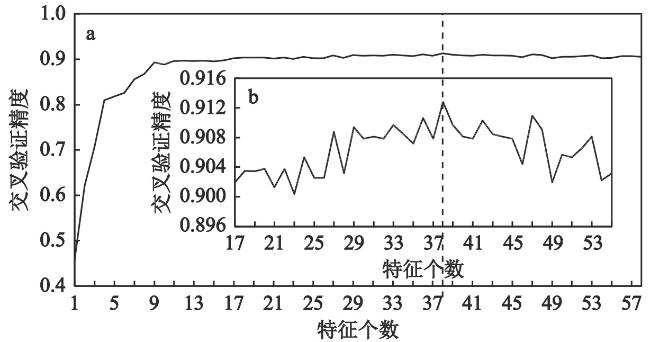
图3 不同特征条件下随机森林分类精度变化b为a在特征个数为17~55的局部放大,虚线用来标明交叉验证精度最高时对应的特征个数 Fig. 3 Accuracy variation of random forest classification under different feature schemes |
表2 经过特征优化的随机森林分类结果与未经特征优化的结果对比Table 2 Comparison of the results of random forest classification before and after the feature optimism |
| 土地覆被类型 | 原始结果 | 特征优化结果1(29) | 特征优化结果2(38) | |||||
| 制图精度/% | 用户精度/% | 制图精度/% | 用户精度/% | 制图精度/% | 用户精度/% | |||
| 注:括号内数字为优化特征数量;黑体数值表示横向比较不同分类结果精度的最大值,当最大值对应的方案个数超过1个时未标明。 | ||||||||
| 裸地 | 91.03 | 92.21 | 91.03 | 93.42 | 91.03 | 91.03 | ||
| 农田 | 96.62 | 90.51 | 95.95 | 89.87 | 97.97 | 91.77 | ||
| 森林 | 97.22 | 98.79 | 98.02 | 99.20 | 97.62 | 98.80 | ||
| 草地 | 78.16 | 87.18 | 82.76 | 87.80 | 81.61 | 89.87 | ||
| 灌丛 | 91.78 | 87.58 | 89.73 | 87.33 | 92.47 | 90.00 | ||
| 湿地 | 80.00 | 91.43 | 80.00 | 91.43 | 82.50 | 94.29 | ||
| 建设用地 | 89.39 | 89.39 | 86.36 | 87.69 | 89.39 | 89.39 | ||
| 积雪 | 100.00 | 97.98 | 100.00 | 97.98 | 100.00 | 97.98 | ||
| 水体 | 100.00 | 100.00 | 100.00 | 100.00 | 100.00 | 100.00 | ||
| 总体精度/% | 93.11 | 93.11 | 93.96 | |||||
| Kappa系数 | 0.92 | 0.92 | 0.93 | |||||
| 袋外误差 | 0.08 | 0.08 | 0.07 | |||||
表3 基于不同特征选择的随机森林分类方案结果精度比较Table 3 Accuracy comparison of random forest classification results based on different feature selection schemes |
| 方案一 | 方案二 | 方案三 | 方案四 | 方案五 | ||||||||||
| 制图 精度/% | 用户 精度/% | 制图 精度/% | 用户 精度/% | 制图 精度/% | 用户 精度/% | 制图 精度/% | 用户 精度/% | 制图 精度/% | 用户 精度/% | |||||
| 注:黑体数值表示横向比较不同分类方案中精度的最大值,当最大值对应的方案个数超过1个时未标明。 | ||||||||||||||
| 裸地 | 91.03 | 92.21 | 83.33 | 91.55 | 91.03 | 91.03 | 84.62 | 91.67 | 88.46 | 90.79 | ||||
| 农田 | 96.62 | 90.51 | 93.92 | 84.24 | 95.95 | 89.87 | 93.24 | 84.66 | 97.30 | 91.14 | ||||
| 森林 | 97.22 | 98.79 | 97.22 | 98.79 | 97.22 | 98.39 | 97.22 | 97.61 | 97.62 | 99.19 | ||||
| 草地 | 78.16 | 87.18 | 77.01 | 85.90 | 81.61 | 88.75 | 74.71 | 83.33 | 77.01 | 85.90 | ||||
| 灌丛 | 91.78 | 87.58 | 87.67 | 84.77 | 88.36 | 86.58 | 82.19 | 78.43 | 88.36 | 87.76 | ||||
| 湿地 | 80.00 | 91.43 | 80.00 | 88.89 | 80.00 | 94.12 | 75.00 | 90.91 | 82.50 | 94.29 | ||||
| 建设用地 | 89.39 | 89.39 | 87.88 | 87.88 | 87.88 | 86.57 | 74.24 | 75.38 | 87.87 | 80.55 | ||||
| 积雪 | 100.00 | 97.98 | 100.00 | 97.98 | 100.00 | 97.98 | 100.00 | 97.98 | 100.00 | 97.98 | ||||
| 水体 | 100.00 | 100.00 | 100.00 | 100.00 | 100.00 | 100.00 | 100.00 | 100.00 | 100.00 | 96.77 | ||||
| 总体精度/% | 93.96 | 91.21 | 92.69 | 88.98 | 92.48 | |||||||||
| Kappa系数 | 0.93 | 0.90 | 0.91 | 0.87 | 0.91 | |||||||||
| 袋外误差 | 0.07 | 0.09 | 0.08 | 0.11 | 0.08 | |||||||||
感谢2019年参与藏东南野外工作的刘丹辉、许雪敏、贾力哈斯·节恩斯、孟克祖勒、洛桑加措、平措;感谢刘琼欢、李兰晖为本文提出了有价值的修改意见。
| [1] |
FAO. Mapping the vulnerability of mountain peoples to food insecurity[M]. Rome, Italy: Food and Agriculture Organization of the United Nations, 2015.
|
| [2] |
Tiwari P C. Land-use changes in Himalaya and their impact on the plains ecosystem: Need for sustainable land use[J]. Land Use Policy, 2000, 17(2): 101-111.
|
| [3] |
Lambin E F, Geist H, Rindfuss R R. Introduction: Local processes with global impacts[M]. Berlin, Heidelberg: Springer Berlin Heidelberg, 2006.
|
| [4] |
Liu Q, Zhang Y, Liu L et al. The spatial local accuracy of land cover datasets over the Qiangtang Plateau[J]. Journal of Geographical Sciences, 2019, 29(11): 1841-1858.
|
| [5] |
谷晓天, 高小红, 马慧娟, 等. 复杂地形区土地利用/土地覆被分类机器学习方法比较研究[J]. 遥感技术与应用, 2019, 34(1): 57-67.
Gu Xiaotian, Gao Xiaohong, Ma Huijuan et al. Comparison of machine learning methods for land use/land cover classification in the complicated terrain regions. Remote Sensing Technology and Application, 2019, 34(1): 57-67.
|
| [6] |
Adepoju K A, Adelabu S A. Improving accuracy evaluation of Landsat-8 OLI using image composite and multisource data with Google Earth Engine[J]. Remote Sensing Letters, 2020, 11(2): 107-116.
|
| [7] |
Maxwell A E, Warner T A, Fang F. Implementation of machine-learning classification in remote sensing: An applied review[J]. International Journal of Remote Sensing, 2018, 39(9): 2784-2817.
|
| [8] |
Gartzia M, Alados C L, Pérez-Cabello F et al. Improving the accuracy of vegetation classifications in mountainous areas[J]. Mountain Research and Development, 2013, 33(1): 63-74.
|
| [9] |
Jin Y, Liu X, Chen Y et al. Land-cover mapping using random forest classification and incorporating NDVI time-series and texture: A case study of central Shandong[J]. International Journal of Remote Sensing, 2018, 39(23): 8703-8723.
|
| [10] |
Gorelick N, Hancher M, Dixon M et al. Google Earth Engine: Planetary-scale geospatial analysis for everyone[J]. Remote Sensing of Environment, 2017, 202: 18-27.
|
| [11] |
Liu D, Chen N, Zhang X et al. Annual large-scale urban land mapping based on Landsat time series in Google Earth Engine and OpenStreetMap data: A case study in the middle Yangtze River Basin[J]. ISPRS Journal of Photogrammetry and Remote Sensing, 2020, 159: 337-351.
|
| [12] |
Gu C, Zhao P, Chen Q et al. Forest cover change and the effectiveness of protected areas in the Himalaya since 1998[J]. Sustainability, 2020, 12(15): 6123.
|
| [13] |
Cheng K, Wang J, Yan X. Mapping forest types in China with 10 m resolution based on spectral-spatial-temporal features[J]. Remote Sensing, 2021, 13(5): 973.
|
| [14] |
Pricet K P, Guo X, Stiles J M. Optimal Landsat TM band combinations and vegetation indices for discrimination of six grassland types in eastern Kansas[J]. International Journal of Remote Sensing, 2002, 23(23): 5031-5042.
|
| [15] |
Gregorutti B, Michel B, Saint-Pierre P. Correlation and variable importance in random forests[J]. Statistics and Computing, 2017, 27(3): 659-678.
|
| [16] |
Zeferino L B, Souza L, Amaral C et al. Does environmental data increase the accuracy of land use and land cover classification?[J]. International Journal of Applied Earth Observation and Geoinformation, 2020, 91: 102128.
|
| [17] |
解淑毓, 付波霖, 李颖, 等. 基于多维度遥感影像的洪河国家级自然保护区沼泽湿地分类方法研究[J]. 湿地科学, 2021, 19(1): 1-16.
Xie Shuyu, Fu Bolin, Li Ying et al. Classification method on marsh wetlands in Honghe National Nature Reserve based on multi-dimensional remote sensing images. Wetland Science, 2021, 19(1): 1-16.
|
| [18] |
Myers N, Mittermeier R A, Mittermeier C G et al. Biodiversity hotspots for conservation priorities[J]. Nature, 2000, 403(6772): 853-858.
|
| [19] |
Olson D M, Dinerstein E. The global 200: A representation approach to conserving the earth's most biologically valuable ecoregions[J]. Conservation Biology, 1998, 12(3): 502-515.
|
| [20] |
王兵, 任晓旭, 胡文. 中国森林生态系统服务功能及其价值评估[J]. 林业科学, 2011, 47(2): 145-153.
Wang Bin, Ren Xiaoxu, Hu Wen. Assessment of forest ecosystem services value in China. Scientia Silvae Sinicae, 2011, 47(2): 145-153.
|
| [21] |
刘天仇. 雅鲁藏布江水文特征[J]. 地理学报, 1999, 54(s1): 157-164.
Liu Tianchou. Hydrological characteristics of Yalungzangbo River. Acta Geographica Sinica, 1999, 54(s1): 157-164.
|
| [22] |
潘建平, 夏鑫, 阳春花. 结合特征组与分层策略的遥感图像分类研究[J]. 测绘科学, 2019, 44(1): 104-111.
Pan Jianping, Xia Xin, Yang Chunhua. Research on remote sensing image classification combined feature groups and hierarchy strategy. Science of Surveying and Mapping, 2019, 44(1): 104-111.
|
| [23] |
Reddy C S, Sreelekshmi S, Jha C S et al. National assessment of forest fragmentation in India: Landscape indices as measures of the effects of fragmentation and forest cover change[J]. Ecological Engineering, 2013, 60: 453-464.
|
| [24] |
苏立彬, 郭永刚, 吴悦, 等. 基于RS和GIS的西藏林芝地区土地利用类型动态变化[J]. 中国农业大学学报, 2019, 24(10): 170-178.
Su Libin, Guo Yonggang, Wu Yue et al. Dynamic change of land use types in Linzhi prefecture of Tibet based on RS and GIS. Journal of China Agricultural University, 2019, 24(10): 170-178.
|
| [25] |
Zhang X, Liu L, Chen X et al. GLC_FCS30: Global land-cover product with fine classification system at 30 m using time-series Landsat imagery[J]. Earth System Science Data, 2020, 13: 2753-2776.
|
| [26] |
刘时银, 姚晓军, 郭万钦, 等. 基于第二次冰川编目的中国冰川现状[J]. 地理学报, 2015, 70(1): 3-16.
Liu Shiyin, Yao Xiaojun, Guo Wanqin et al. The contemporary glaciers in China based on the Second Chinese Glacier Inventory. Acta Geographica Sinica, 2015, 70(1): 3-16.
|
| [27] |
Ghorbanian A, Kakooei M, Amani M et al. Improved land cover map of Iran using Sentinel imagery within Google Earth Engine and a novel automatic workflow for land cover classification using migrated training samples[J]. ISPRS Journal of Photogrammetry and Remote Sensing, 2020, 167: 276-288.
|
| [28] |
Rouse J R, Haas R H, Schell J A et al. Monitoring the vernal advancement and retrogradation (green wave effect) of natural vegetation[R]. Greenbelt, MD: NASA/GSFC, Type III, Final Report., 1974.
|
| [29] |
Mcfeeters S K. The use of the Normalized Difference Water Index (NDWI) in the delineation of open water features[J]. International Journal of Remote Sensing, 1996, 17(7): 1425-1432.
|
| [30] |
Zha Y, Gao J, Ni S. Use of normalized difference built-up index in automatically mapping urban areas from TM imagery[J]. International Journal of Remote Sensing, 2003, 24(3): 583-594.
|
| [31] |
Huete A R. A Soil-Adjusted Vegetation Index (SAVI)[J]. Remote Sensing of Environment, 1988, 25(3): 295-309.
|
| [32] |
Huete A, Didan K, Miura T et al. Overview of the radiometric and biophysical performance of the MODIS vegetation indices[J]. Remote Sensing of Environment, 2002, 83(1): 195-213.
|
| [33] |
Hall D K, Salomonson V V, Riggs G A. Development of methods for mapping global snow cover using moderate resolution imaging spectroradiometer data[J]. Remote Sensing of Environment, 1995, 54(2): 127-140.
|
| [34] |
Hird J N, Delancey E R, Mcdermid G J et al. Google Earth Engine, open-access satellite data, and machine learning in support of large-area probabilistic wetland mapping[J]. Remote Sensing, 2017, 9(12): 1315.
|
| [35] |
Gallant J C, Wilson J P. Primary topographic attitudes[M]. New York: Wiley, 2000.
|
| [36] |
Beven K J, Kirby M J. A physically based, variable contributing area model of basin hydrology[J]. Hydrological Sciences Journal, 1979, 24(1): 43-69.
|
| [37] |
Haralick R M, Shanmugam K, Dinstein I. Textural features for image classification[J]. Studies in Media and Communication, 1973, SMC-3(6): 610-621.
|
| [38] |
方匡南, 吴见彬, 朱建平, 等. 随机森林方法研究综述[J]. 统计与信息论坛, 2011, 26(3): 32-38.
Fang Kuangnan, Wu Jianbin, Zhu Jianping et al. A review of technologies on random forests. Statistics & Information Forum, 2011, 26(3): 32-38.
|
| [39] |
Stone M. Cross-validatory choice and assessment of statistical predictions[J]. Journal of the Royal Statistical Society[J]. Series B (Methodological), 1974, 36(2): 111-147.
|
| [40] |
Stromann O, Nascetti A, Yousif O et al. Dimensionality reduction and feature selection for object-based land cover classification based on Sentinel-1 and Sentinel-2 time series using Google Earth Engine[J]. Remote Sensing, 2020, 12(1): 76
|
| [41] |
Qu L A, Chen Z, Li M et al. Accuracy improvements to pixel-based and object-based LULC classification with auxiliary datasets from Google Earth Engine[J]. Remote Sensing, 2021, 13(3): 453.
|
| [42] |
Lin Y, Zhang H, Lin H et al. Incorporating synthetic aperture radar and optical images to investigate the annual dynamics of anthropogenic impervious surface at large scale[J]. Remote Sensing of Environment, 2020, 242(111757).
|
| [43] |
Vuolo F, Neuwirth M, Immitzer M et al. How much does multi-temporal Sentinel-2 data improve crop type classification?[J]. International Journal of Applied Earth Observation and Geoinformation, 2018, 72: 122-130.
|
| [44] |
Dekker R J. Texture analysis and classification of ERS SAR images for map updating of urban areas in the Netherlands[J]. IEEE Transactions on Geoscience and Remote Sensing, 2003, 41(9): 1950-1958.
|
| [45] |
Mananze S, Pôças I, Cunha M. Mapping and assessing the dynamics of shifting agricultural landscapes using Google Earth Engine cloud computing, a case study in Mozambique[J]. Remote Sensing, 2020, 12(8): 1279.
|
/
| 〈 |
|
〉 |