
基于地理加权随机森林的青藏地区放牧强度时空格局模拟
|
李兰晖(1989—),男,江西赣州人,副教授,主要从事人类活动对地表覆被变化的影响。E-mail: lilh@xmut.edu.cn |
收稿日期: 2022-06-20
修回日期: 2022-08-20
网络出版日期: 2023-03-20
基金资助
中国科学院战略性先导科技专项(XDA20040201)
第二次青藏高原综合科学考察研究(2019QZKK0603)
国家自然科学基金项目(42101099)
版权
Mapping the multi-temporal grazing intensity on the Qinghai-Tibet Plateau using geographically weighted random forest
Received date: 2022-06-20
Revised date: 2022-08-20
Online published: 2023-03-20
Supported by
Strategic Priority Research Program of Chinese Academy of Sciences(XDA20040201)
the Second Tibetan Plateau Scientific Expedition and Research(2019QZKK0603)
National Natural Science Foundation of China(42101099)
Copyright
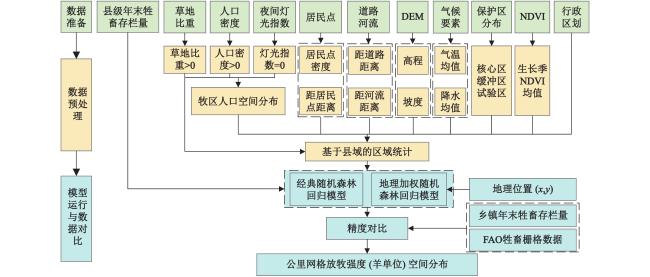
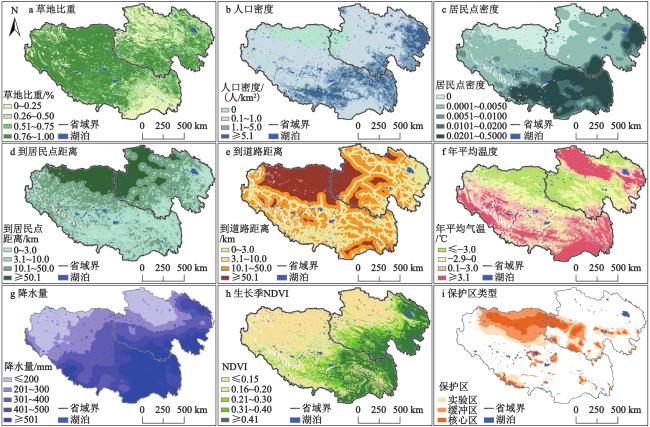
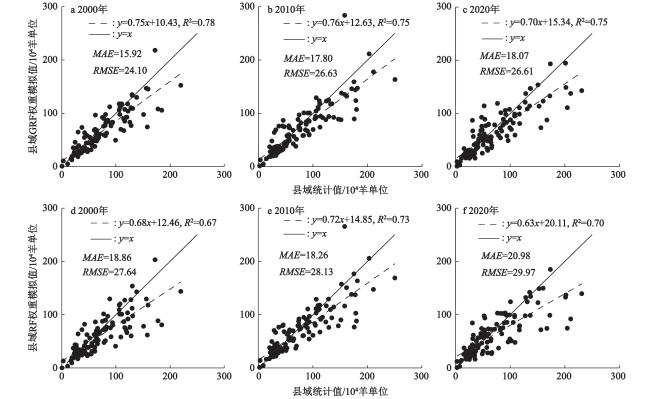
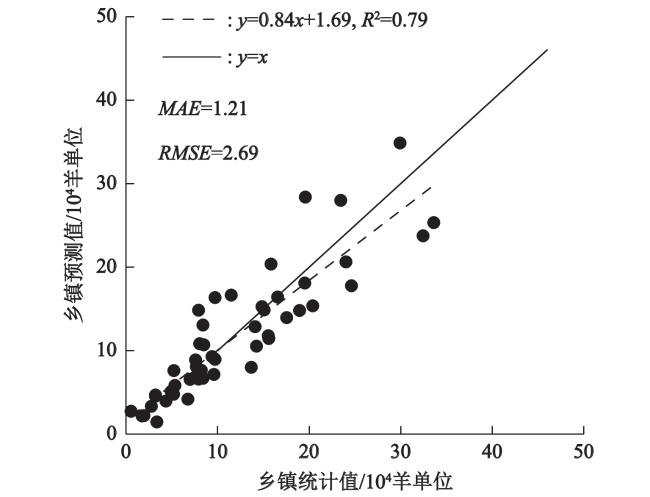
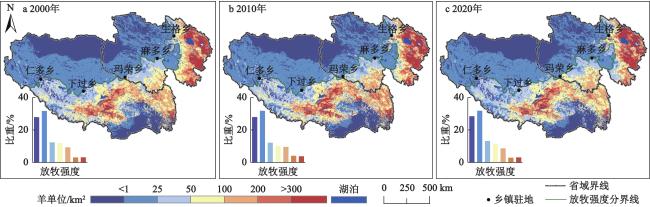
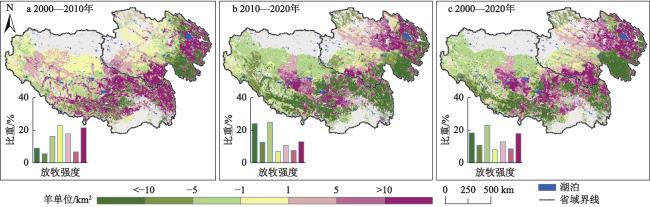
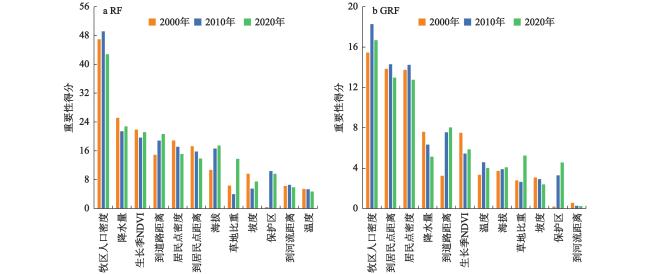
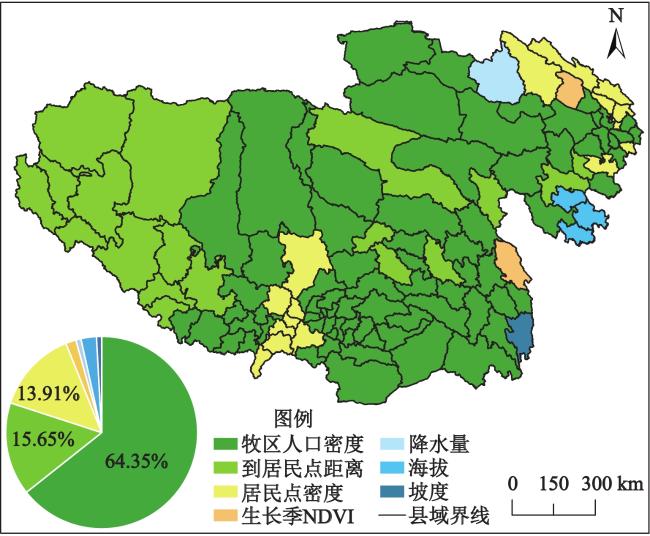
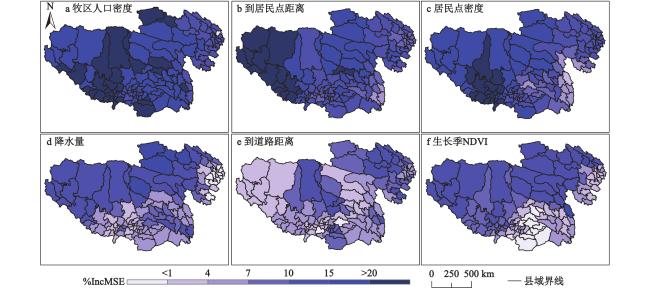
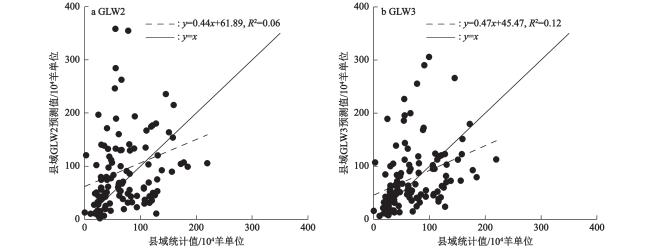
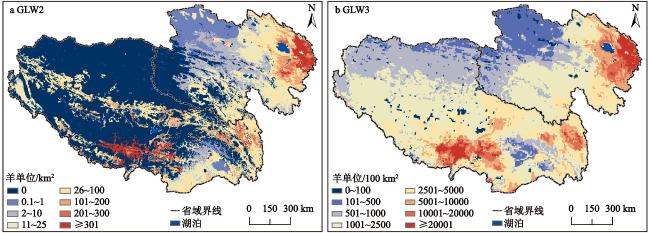
精确刻画放牧强度时空格局是深刻理解青藏地区高寒草地服务功能动态及其驱动机制的重要基础,对辅助制定区域生态安全和可持续发展战略具有意义。基于牲畜年末存栏量、牧区人口密度、生长季NDVI、年降水量、年平均气温和居民点分布等数据,采用地理加权随机森林模型,模拟了2000年、2010年和2020年3期青藏地区放牧强度的空间格局,并定量评价了环境因子对放牧强度空间分布解释性的区域差异。结果表明:① 地理加权随机森林模拟结果可精细地刻画青藏地区放牧强度的空间特征,与经典随机森林模型相比,判定系数更高,平均绝对值误差和均方根误差更低。② 青藏地区放牧强度呈现东南高、西北低的基本特征,其中,西北部地区放牧强度低于25羊单位/km2的区域约占青藏地区面积的1/2。③ 与2000年和2010年相比,2020年青藏地区放牧强度呈现总体下降、局部抬升的态势;其中,较2010年,2020年放牧强度下降超过1羊单位/km2的区域占牧区面积的61.69%。④ 牧区人口密度是解释放牧强度空间异质性最主要的因素,其相对重要性呈现西高东低的特征,而降水量和生长季NDVI的相对重要性则呈现西北高、东南低的特征。研究结论可为青藏地区草地可持续管理和生态安全屏障建设提供科学参考。
李兰晖 , 黄聪聪 , 张镱锂 , 刘林山 , 王兆锋 , 张海燕 , 丁明军 , 张华敏 . 基于地理加权随机森林的青藏地区放牧强度时空格局模拟[J]. 地理科学, 2023 , 43(3) : 398 -410 . DOI: 10.13249/j.cnki.sgs.2023.03.003
Accurately quantifying the spatiotemporal pattern of grazing intensity on the Qinghai-Tibet Plateau (QTP) is crucial to improving our understanding of the driving mechanism of alpine grassland change, and is of great significance for maintaining regional ecological security and promoting sustainable development policies. Based on the data of livestock inventory at the end of the year and environmental covariates (e.g. population density in pastoral areas, growing season NDVI, annual precipitation, annual mean temperature, and settlements), the gridded grazing intensities on the QTP in 2000, 2010, and 2020 were simulated by geographically weighted random forest (GRF), and the regional differences in the interpretability of environmental variables were then analyzed. The results showed that grazing intensity maps predicted by the GRF could mirror the spatial distribution of grazing intensity on the QTP, compared with the classic random forest model, the R2 was higher, and both the mean absolute value error (MAE) and root mean square error (RMSE) were lower. The grazing intensity was generally higher in the southeast and lower in the northwest of the QTP. The areas with grazing intensity of less than 25 sheep units/km2 in the northwest part accounted for about half of the QTP. Compared with 2000 and 2010, the grazing intensity of the QTP in 2020 showed a trend of overall decrease but local increase. For example, compared with 2010, the areas of grazing intensity decreased by higher than 1 sheep unit/km2 in 2020 accounting for 61.69% of the pastoral area. The population density in pastoral areas was the most important factor explaining the spatial heterogeneity of grazing intensity, and its relative importance was higher in the western QTP and lower in the eastern QTP. On the contrary, the relative importance of both precipitation and growing season NDVI was higher in the northwest part and lower in the southeast part of QTP. Our results provide scientific references for sustainable grassland management and ecological safety barrier construction on the QTP.
表1 数据来源汇总Table 1 Summary of the datasets in this study |
| 数据名称 | 时间粒度(年份) | 数据类型/分辨率 | 来源/参考文献 |
| 注:区县、地级市和自治州牲畜年末存栏统计数据来源于《西藏统计年鉴》和《青海统计年鉴》( https://data.cnki.net/Yearbook/)及当地政府的统计数据;资源环境科学与数据中心网址 https://www.resdc.cn/;“–”为无此项。 | |||
| 县级牲畜年末存栏量 | 2000,2010,2020 | Excel | 统计数据 |
| 乡镇牲畜年末存栏量(部分) | 2010 | Excel | 统计数据 |
| 地表覆盖类型 | 2000,2010,2020 | 1 000 m | Liu等[31]、Zhang等[32] |
| 夜间灯光指数 | 2000,2010,2020 | 15 arcsec (~500 m) | Chen等[33] |
| 人口密度 | 2000,2010,2020 | 1 000 m | Li等[34] |
| 到居民点距离 | 2000,2012,2016 | 1 000 m | Li等[34] |
| 居民点密度 | 2000,2012,2016 | 1 000 m | Li等[34] |
| 到道路的距离 | 2000,2012,2016 | 1 000 m | Li等[34] |
| 河流 | – | 矢量 | 资源环境科学与数据中心 |
| 保护区 | – | 矢量 | 资源环境科学与数据中心 |
| 行政区划 | – | 矢量 | 资源环境科学与数据中心 |
| DEM | – | 1 000 m | 资源环境科学与数据中心 |
| 生长季NDVI均值 | 2000—2016 | 1 000 m | 资源环境科学与数据中心 |
| 年平均气温均值 | 2000—2016 | 0.1° | He等[35] |
| 年降水量均值 | 2000—2016 | 0.1° | He等[35] |
| GLW2牲畜密度 | 2001 | ~1 000 m | Robinson等[12] |
| GLW3牲畜密度 | 2001 | ~10 000 m | Gilbert等[11] |
| [1] |
Scurlock J M O, Hall D O. The global carbon sink: A grassland perspective[J]. Global Change Biology, 2002, 4(2): 229-233.
|
| [2] |
Bardgett R D, Bullock J M, Lavorel S et al. Combatting global grassland degradation[J]. Nature Reviews: Earth & Environment, 2021, 2(10): 720-735.
|
| [3] |
文雯, 周丁扬, 李广泳, 等. 基于牧民放牧行为的青海湖流域放牧路线研究——以刚察县为例[J]. 干旱区资源与环境, 2016, 30(7): 95-100.
Wen Wen, Zhou Dingyang, Li Guangyong et al. The research on grazing routes in Qinghai Lake watershed based on the grazing behavior of herdsmen—A case of Gangcha County. Journal of Arid Land Resources and Environment, 2016, 30(7): 95-100.
|
| [4] |
Hankerson B R, Schierhorn F, Prishchepov A V et al. Modeling the spatial distribution of grazing intensity in Kazakhstan[J]. PLOS ONE, 2019, 14(1): e210051
|
| [5] |
胡晓阳, 王兆锋, 张镱锂, 等. 青藏高原放牧强度空间化方法与应用[J]. 地理学报, 2022, 77(3): 547-558.
Hu Xiaoyang, Wang Zhaofeng, Zhang Yili et al. Spatialization method of grazing intensity and its application in Tibetan Plateau. Acta Geographica Sinica, 2022, 77(3): 547-558.
|
| [6] |
Dara A, Baumann M, Freitag M et al. Annual landsat time series reveal post-Soviet changes in grazing pressure[J]. Remote Sensing of Environment, 2020, 239: 111667.
|
| [7] |
Hilker T, Natsagdorj E, Waring R H et al. Satellite observed widespread decline in Mongolian grasslands largely due to overgrazing[J]. Global Change Biology, 2014, 20(2): 418-428.
|
| [8] |
李文龙, 薛中正, 郭述茂, 等. 基于3S技术的玛曲县草地植被覆盖度变化及其驱动力[J]. 兰州大学学报(自然科学版), 2010, 46(1): 85-90,95.
Li Wenlong, Xue Zhongzheng, Guo Sumao et al. Vegetation coverage changes and analysis of the driving forces in Maqu county based on 3S technology. Journal of Lanzhou University (Natural Science), 2010, 46(1): 85-90,95.
|
| [9] |
Li X, Hou J, Huang C. High-resolution gridded livestock projection for Western China based on machine learning[J]. Remote Sensing, 2021, 13(24): 5038.
|
| [10] |
Robinson T P, Franceschini G, Wint W. The food and agriculture organization's gridded livestock of the world[J]. Veterinaria Italiana, 2007, 43(3): 745
|
| [11] |
Gilbert M, Nicolas G, Cinardi G et al. Global distribution data for cattle, buffaloes, horses, sheep, goats, pigs, chickens and ducks in 2010[J]. Scientific Data, 2018, 5: 180227.
|
| [12] |
Robinson T P, Wint G R W, Conchedda G et al. Mapping the global distribution of livestock[J]. PLOS ONE, 2014, 9(5): e96084.
|
| [13] |
Sun Y, Liu S, Liu Y et al. Grazing intensity and human activity intensity data sets on the Qinghai-Tibetan Plateau during 1990–2015[J]. Geoscience Data Journal, 2022, 9(1): 140-153.
|
| [14] |
Zhu Z, Zhang X, Dong H et al. Integrated livestock sector nitrogen pollution abatement measures could generate net benefits for human and ecosystem health in China[J]. Nature Food, 2022, 3(2): 161-168.
|
| [15] |
Georganos S, Grippa T, Niang Gadiaga A et al. Geographical random forests: A spatial extension of the random forest algorithm to address spatial heterogeneity in remote sensing and population modelling[J]. Geocarto International, 2021, 36(2): 121-136.
|
| [16] |
Khan S N, Li D, Maimaitijiang M. A geographically weighted random forest approach to predict corn yield in the US Corn Belt[J]. Remote Sensing, 2022, 14(12): 2843.
|
| [17] |
Alampi Sottini V, Barbierato E, Capecchi I et al. Assessing the perception of urban visual quality: An approach integrating big data and geostatistical techniques[J]. Aestimum, 2022, 79: 75-102.
|
| [18] |
Grekousis G, Feng Z, Marakakis I et al. Ranking the importance of demographic, socioeconomic, and underlying health factors on US COVID-19 deaths: A geographical random forest approach[J]. Health & Place, 2022, 74: 102744
|
| [19] |
Luo Y, Yan J, Mcclure S. Distribution of the environmental and socioeconomic risk factors on COVID-19 death rate across continental USA: A spatial nonlinear analysis[J]. Environmental Science and Pollution Research, 2021, 28(6): 6587-6599.
|
| [20] |
孙鸿烈, 郑度, 姚檀栋, 等. 青藏高原国家生态安全屏障保护与建设[J]. 地理学报, 2012, 67(1): 3-12.
Sun Honglie, Zheng Du, Yao Tandong et al. Protection and construction of the national ecological security shelter zone on Tibetan Plateau. Acta Geographica Sinica, 2012, 67(1): 3-12.
|
| [21] |
贺有龙, 周华坤, 赵新全, 等. 青藏高原高寒草地的退化及其恢复[J]. 草业与畜牧, 2008(11): 1-9.
He Youlong, Zhou Huakun, Zhao Xinquan et al. Alpine grassland degradation and its restoration on Qinghai-Tibet Plateau. Prataculture & Animal Husbandry, 2008(11): 1-9.
|
| [22] |
吴雪, 刘峰贵, 刘林山, 等. 青藏高原牲畜数量变化及其空间特征[J]. 生态科学, 2021, 40(6): 38-47.
Wu Xue, Liu Fenggui, Liu Linshan et al. Changes and spatial characteristics of livestock population in Tibetan Plateau. Ecological Science, 2021, 40(6): 38-47.
|
| [23] |
Chen B, Zhang X, Tao J et al. The impact of climate change and anthropogenic activities on alpine grassland over the Qinghai-Tibet Plateau[J]. Agricultural and Forest Meteorology, 2014, 189–190: 11-18.
|
| [24] |
Zhang L, Fan J, Zhou D et al. Ecological protection and restoration program reduced grazing pressure in the Three-River Headwaters Region, China[J]. Rangeland Ecology & Management, 2017, 70(5): 540-548.
|
| [25] |
王小青. 2000-2018年青藏高原放牧活动时空变化及草畜平衡分析[D]. 西安: 长安大学, 2021: 72.
Wang Xiaoqing. Analysis on the temporal and spatial changes of grazing activities and the balance between forage and livestock in the Qinghai-Tibet Plateau from 2000 to 2018. Xi'an: Chang'an University, 2021: 72.
|
| [26] |
Li S, Zhang Y, Wang Z et al. Mapping human influence intensity in the Tibetan Plateau for conservation of ecological service functions[J]. Ecosystem Services, 2018, 30: 276-286.
|
| [27] |
Wei Y, Lu H, Wang J et al. Dual influence of climate change and anthropogenic activities on the spatiotemporal vegetation dynamics over the Qinghai-Tibetan Plateau from 1981 to 2015[J]. Earth's Future, 2022, 10(5): e2021E-e2566E.
|
| [28] |
张文强, 罗格平, 郑宏伟, 等. 基于随机森林模型的内陆干旱区植被指数变化与驱动力分析: 以北天山北坡中段为例[J]. 植物生态学报, 2021, 44(11): 1-14.
Zhang Wenqiang, Luo Geping, Zheng Hongwei et al. Analysis of vegetation index changes and driving forces in inland arid areas based on random forest model: A case study of the middle part of northern slope of the north Tianshan Mountains. Chinese Journal of Plant Ecology, 2021, 44(11): 1-14.
|
| [29] |
Han Q, Luo G, Li C et al. Simulated grazing effects on carbon emission in Central Asia[J]. Agricultural and Forest Meteorology, 2016, 216: 203-214.
|
| [30] |
段群滔, 罗立辉. 1990—2015年青藏高原人类足迹数据集[J]. 中国科学数据(中英文网络版), 2020, 5(3): 303-312.
Duan Quntao, Luo Lihui. A dataset of human footprint over the Qinghai-Tibet Plateau during 1990—2015. China Scientific Data, 2020, 5(3): 303-312.
|
| [31] |
Liu J, Kuang W, Zhang Z et al. Spatiotemporal characteristics, patterns, and causes of land-use changes in China since the late 1980s[J]. Journal of Geographical Sciences, 2014, 24(2): 195-210.
|
| [32] |
Zhang X, Liu L, Chen X et al. GLC_FCS30: global land-cover product with fine classification system at 30 m using time-series Landsat imagery[J]. Earth System Science Data, 2021, 13(6): 2753-2776.
|
| [33] |
Chen Z, Yu B, Yang C et al. An extended time series (2000–2018) of global NPP-VIIRS-like nighttime light data from a cross-sensor calibration[J]. Earth System Science Data, 2021, 13(3): 889-906.
|
| [34] |
Li L, Zhang Y, Liu L et al. Mapping changing population distribution on the Qinghai-Tibet Plateau since 2000 with multi-temporal remote sensing and point-of-interest data[J]. Remote Sensing, 2020, 12(24): 4059.
|
| [35] |
He J, Yang K, Tang W et al. The first high-resolution meteorological forcing dataset for land process studies over China[J]. Scientific Data, 2020, 7(1): 1-11.
|
| [36] |
李青丰, 乌云其木格. 草畜平衡管理系列研究(6)——家畜数量动态变化[J]. 草业科学, 2012, 29(6): 997-1001.
Li Qingfeng, Wu Yunqi, Mu Ge. Animal demanding-feed availability balance control series(6)—Animal number monthly change. Pratacultural Science, 2012, 29(6): 997-1001.
|
| [37] |
Nicolas G, Robinson T P, Wint G R W et al. Using random forest to improve the downscaling of global livestock census data[J]. PLOS ONE, 2016, 11(3): e150424
|
| [38] |
Leyk S, Gaughan A E, Adamo S B et al. The spatial allocation of population: A review of large-scale gridded population data products and their fitness for use[J]. Earth System Science Data, 2019, 11(3): 1385-1409.
|
| [39] |
Breiman L. Random forests[J]. Machine Learning, 2001(4545): 1-5.
|
| [40] |
Gromping U. Variable importance assessment in regression: linear regression versus random forest[J]. The American Statistician, 2009, 63(4): 308-319.
|
| [41] |
Fotheringham A S, Brunsdon C, Charlton M. Geographically weighted regression: The analysis of spatially varying relationships[M].Hoboken: Wiley, 2002.
|
| [42] |
Georganos S, Kalogirou S. Package 'Spatialml'[DB/OL]. 2019. https://mran.microsoft.com/snapshot/2020-04-25/web/pack-ages/SpatialML/index.html
|
| [43] |
Ye T, Zhao N, Yang X et al. Improved population mapping for China using remotely sensed and points-of-interest data within a random forests model[J]. Science of The Total Environment, 2019, 658: 936-946.
|
| [44] |
Reed F, Gaughan A, Stevens F et al. Gridded population maps informed by different built settlement products[J]. Data, 2018, 3(3): 33.
|
| [45] |
林珲, 张鸿生, 林殷怡, 等. 基于城市不透水面–人口关联的粤港澳大湾区人口密度时空分异规律与特征[J]. 地理科学进展, 2018, 37(12): 1644-1652.
Lin Hun, Zhang Hongsheng, Lin Yinyi et al. Spatiotemporal changes of gridded urban population in the Guangdong-Hong Kong-Macao Greater Bay Area based on impervious surface-population correlation. Progress in Geography, 2018, 37(12): 1644-1652.
|
| [46] |
Tan M, Li X, Li S et al. Modeling population density based on nighttime light images and land use data in China[J]. Applied Geography, 2018, 90: 239-247.
|
| [47] |
Zhuang H, Liu X, Yan Y et al. Mapping multi-temporal population distribution in China from 1985 to 2010 using Landsat images via deep learning[J]. Remote Sensing, 2021, 13(17): 3533.
|
| [48] |
Wu S, Wang Z, Du Z et al. Geographically and temporally neural network weighted regression for modeling spatiotemporal non-stationary relationships[J]. International Journal of Geographical Information Science, 2021, 35(3): 582-608.
|
/
| 〈 |
|
〉 |