
城市形态结构对空间紧凑发展的影响机制分析——以上海为例
|
陈飞 (1975—), 男,河南商丘人, 副教授,博士,主要从事城市低碳与紧凑发展研究。E-mail: ldcarch@163.com |
收稿日期: 2022-03-11
修回日期: 2022-08-11
网络出版日期: 2023-05-20
基金资助
上海市哲学社科规划项目(2022BCK001)
版权
Impact of urban morphological structure on space compact development: A case study of Shanghai
Received date: 2022-03-11
Revised date: 2022-08-11
Online published: 2023-05-20
Supported by
Shanghai Office of Philosophy and Social Science(2022BCK001)
Copyright
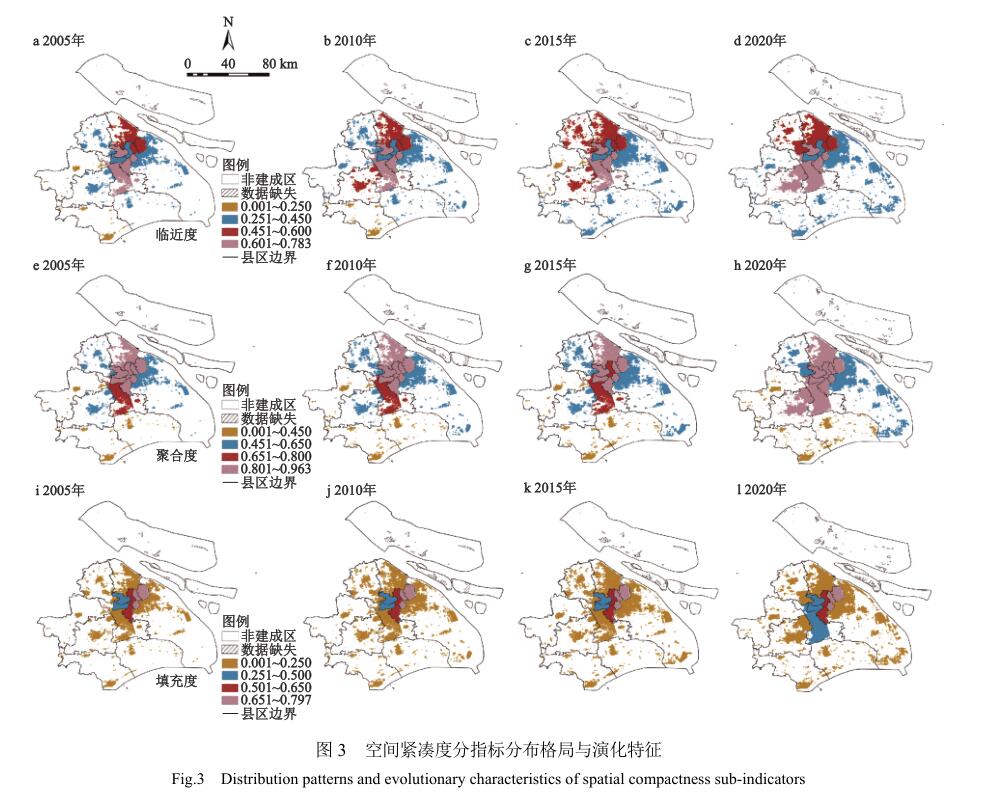
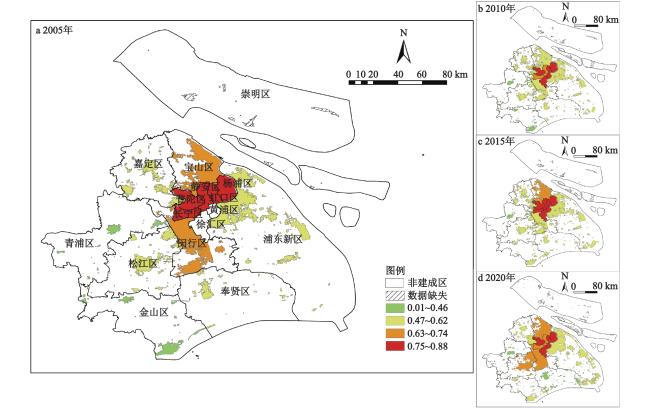
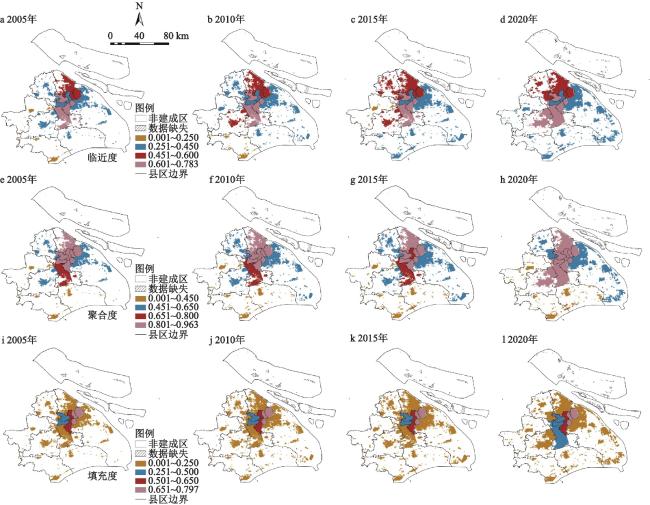
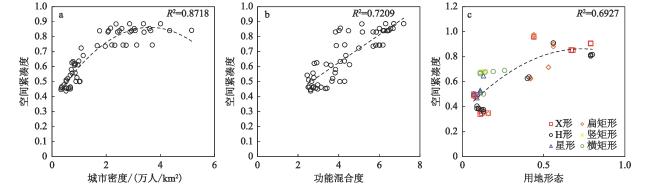
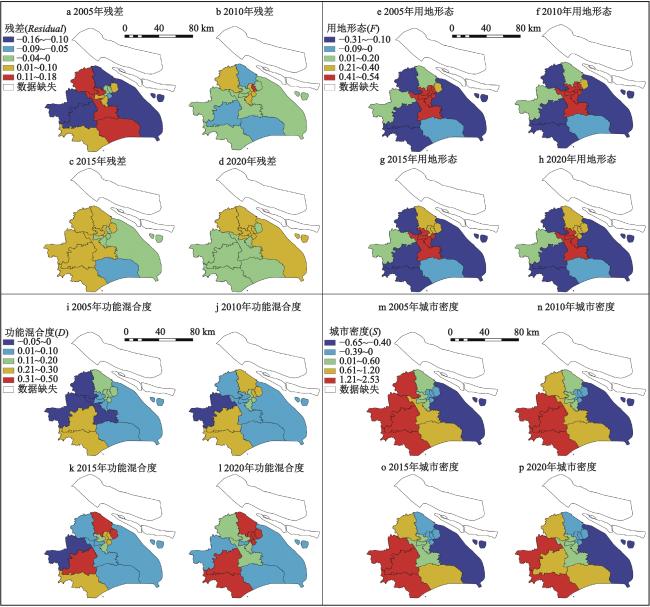
基于空间紧凑发展内涵,构建综合指数模型,分析2005—2020年上海空间紧凑度的演变特征并与国内外城市进行比较,进一步利用时空地理加权回归模型分析城市形态结构对空间紧凑度的影响效应。研究发现:① 空间紧凑度呈现中心高外围低的圈层式分布特征,中心城区普遍趋于稳定,外围城区增长较快,且与其他同类城市比较处于高紧凑发展水平;但受政策及规划影响,紧凑度分指标在空间格局上存在显著差异。② 城市密度与空间紧凑度呈倒“U”型关系,功能混合度和用地形态与空间紧凑度呈近线性关系,且城市密度与之关联性最强。③ 整体上城市密度和功能混合度均对空间紧凑发展产生促进效应,而用地形态表现出抑制效应;分区尺度上形态、功能和密度要素对空间紧凑度的影响效应存在显著差异。④ 通过中心城区与外围城区的差异性空间结构调整,控制国土空间规划形态结构指标来提升城市紧凑发展水平。
陈飞 , 李永贺 , 张帅 , 马晓晴 , 于艺婷 . 城市形态结构对空间紧凑发展的影响机制分析——以上海为例[J]. 地理科学, 2023 , 43(5) : 763 -773 . DOI: 10.13249/j.cnki.sgs.2023.05.001
The disorderly sprawl of land hinders the effectiveness of urban operations. Achieving compact development through optimized territorial spatial planning tools has become a crucial issue for high-quality urban development. This is particularly true for large cities where there is a significant disparity in land expansion rates between the suburbs and the central urban areas. Thus, this study emphasizes the importance of targeted zoning optimization suggestions to achieve efficient space utilization. Based on the connotation of spatially compact development, a comprehensive index model is constructed to analyze the evolution characteristics of spatial compactness in Shanghai during 2005-2020 and compare it with domestic and foreign cities. In addition, a polynomial functional relationship regression model is used to explore the correlation between the sub-indices of urban form structure and spatial compactness, as well as the factors contributing to any differentiation observed. Finally, a Geographically and Temporally Weighted Regression model is used to analyze the effect of urban morphological structure on spatial compactness from the perspective of different city districts. Research Findings: 1) Shanghai is at a high level of compact development compared to similar cities. The pattern of spatial compactness is circular. It shows a high center and a low periphery, with the central region generally tending to be stable and the peripheral region growing faster. However, there are significant differences in the spatial pattern of compactness sub-indicators due to the influence of policies and planning. Compared with domestic and foreign cities, Shanghai presents the characteristics of highly compact development. 2) Urban density has an inverted "U"-shaped relationship with spatial compactness, and correlation is the strongest. In contrast, the mix degree of urban function and land-use form have a nearly linear relationship with spatial compactness, respectively. 3) Overall, it is evident that land-use form can inhibit spatially compact development, though both urban density and the mix degree contribute to it. At the zoning scale, the impacts of form, function, and density on spatial compactness vary dramatically. In the peripheral urban areas, the impacts of the three types of factors on spatial compactness align with the overall findings. However, in the central urban areas, urban density tends to have a negative effect on improving spatial compactness, while land-use form has a notable positive impact. 4) An adjustment to the spatial and morphological structures associated with territorial spatial planning may facilitate compact development within core and periphery areas. Specifically, the central urban areas should prioritize reducing urban density and optimizing land use structure, while the peripheral urban areas should focus on improving urban attractiveness and reducing land use fragmentation.
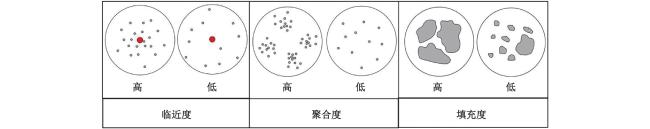
表1 空间紧凑度指标汇总Table 1 Spatial compactness index summary table |
| 紧凑度指标 | 公式 | 来源 | 内涵 | 指标解释 |
| 临近度 | | 参考文献[22] | 临近可达性 | |
| 聚合度 | | 参考文献[22] | 设施集聚性 | |
| 连接度 | | 参考文献[21] | 地块连接性 | |
表2 城市形态结构指标汇总Table 2 Urban morphological structure indicators |
| 形态结构指标 | 公式 | 来源 | 内涵 | 指标解释 |
| 用地形态 | | 参考文献[25] | 布局形态 | ri是辐射点i的半径,表示图形优势点距外围辐射点的 长度,优势点可取中央商务点中心,n为 辐射半径个数,本研究取n=32 |
| 功能混合度 | | 参考文献[26-27] | 功能形态 | Pi表示第i类土地类型的出现概率 |
| 城市密度 | | / | 强度形态 | P0建成区人口规模,L表示建成区面积 |
表3 1990—2010空间紧凑度与城市形态结构的城市层面比较Table 3 City-level comparison of spatial compactness and urban morphological structure in 1990—2010 |
| 指标 | 快速扩张型城市 | 资源集约型城市 | 后工业内涵增长型城市 | |||||||||
| 上海 | 北京 | 广州 | 香港 | 东京 | 新加坡 | 纽约 | 伦敦 | 巴黎 | ||||
| 注:1.以上数据由《Atlas of Urban Expansion—The 2016 Edition Volume 1: Areas and Densities》(http://www.atlasofurbanexpansion.org/data)文献整理所得;2.邻近度、聚合度、用地形态增长率均为1990—2010年均增长率。 | ||||||||||||
| 建成区扩张速率/% | 1.60 | 6.70 | 6.80 | 0.80 | 2.40 | 0.70 | 0.30 | 0.20 | 1.30 | |||
| 城市人口增加速率/% | 3.50 | 5.20 | 5.10 | 0.50 | 0.80 | 2.30 | 0.20 | 1.10 | 0.80 | |||
| 开敞空间下降率/% | 2.70 | −1.50 | 0.90 | 0.60 | 0.40 | 1.20 | 0.20 | 0.50 | 0.60 | |||
| 邻近度 | 1990年 | 0.80 | 0.90 | 0.82 | 0.66 | 0.84 | 0.68 | 0.69 | 0.83 | 0.86 | ||
| 2000年 | 0.90 | 0.70 | 0.71 | 0.69 | 0.83 | 0.72 | 0.70 | 0.82 | 0.85 | |||
| 2010年 | 0.96 | 0.80 | 0.79 | 0.69 | 0.84 | 0.74 | 0.70 | 0.82 | 0.85 | |||
| 增长率/% | 0.40 | 0.90 | 0.80 | 0.00 | 0.10 | 0.30 | 0.10 | 0.00 | 0.10 | |||
| 聚合度 | 1990年 | 0.79 | 0.89 | 0.80 | 0.65 | 0.83 | 0.69 | 0.67 | 0.80 | 0.84 | ||
| 2000年 | 0.90 | 0.69 | 0.69 | 0.68 | 0.81 | 0.72 | 0.69 | 0.79 | 0.82 | |||
| 2010年 | 0.95 | 0.77 | 0.77 | 0.68 | 0.82 | 0.75 | 0.69 | 0.79 | 0.83 | |||
| 增长率/% | 0.40 | 0.80 | 0.70 | −0.10 | 0.10 | 0.30 | 0.00 | 0.00 | 0.10 | |||
| 用地形态 | 1990年 | 竖矩形 | 圆形 | 星形 | H形 | 圆形 | 横矩形 | 菱形 | 圆形 | 星形 | ||
| 2000年 | 正方形 | 横矩形 | 扁矩形 | H形 | 菱形 | 横矩形 | 菱形 | 圆形 | 横矩形 | |||
| 2010年 | 圆形 | H形 | 横矩形 | H形 | 正方形 | 横矩形 | 菱形 | 圆形 | 横矩形 | |||
表4 回归模型检验结果Table 4 Regression model test results |
| 指标 | VIF | t | P | 稳健回归检验 | 稳健回归P值 | 稳健概率蒙卡托检验 |
| 注:S为城市密度,F为用地形态,D功能混合度;/为无此项。 | ||||||
| 常数项 | / | 9.555 | 0.000 | 10.767 | 0.000 | 0.000 |
| S | 4.283 | 4.631 | 0.000 | 3.598 | 0.000 | 0.000 |
| D | 4.193 | 3.372 | 0.001 | 3.102 | 0.003 | 0.000 |
| F | 1.090 | −2.762 | 0.008 | −5.590 | 0.001 | 0.000 |
表5 回归模型拟合优度结果比较Table 5 Comparison of regression model goodness-of-fit results |
| 指标 | OLS | TWR | GWR | MGWR | GTWR |
| 注:S为城市密度,F为用地形态,D功能混合度;P*<0.05,P**<0.01,P***<0.001 ;/为无此项。 | |||||
| 常数项 | 0.417*** | 0.440*** | 0.665** | 0.000* | 0.438* |
| S | 0.072*** | 0.027* | 0.087* | 0.559*** | 0.045* |
| D | 0.044*** | 0.509 | 0.063* | 0.403*** | 0.495* |
| F | −0.001*** | −0.137** | −0.026** | −0.168** | −0.133** |
| R2 | 0.809 | 0.945 | 0.809 | 0.809 | 0.925 |
| 残差平方和(RSS) | 0.284 | 0.084 | 0.284 | 11.446 | 0.114 |
| 赤池信息准则(ALC) | / | −140.837 | 78.869 | / | / |
| 阿凯克信息准则(ALCc) | −139.726 | −175.136 | −139.726 | 81.980 | −75.284 |
| 联合F统计量 | 79.186 | / | / | / | / |
| 联合卡方统计量 | 384.725 | / | / | / | / |
| P[Koenker (BP)] | 0.010* | / | / | / | / |
| P(Jarque-Bera) | 0.112 | / | / | / | / |
图5 城市形态结构分类指数回归系数与残差时空演化特征Fig. 5 Regression coefficients and spatiotemporal evolution characteristics of urban morphological structure classification index |
表6 残差空间自相关值Table 6 Residual spatial autocorrelation values |
| 残差空间自相关 | 2005年 | 2010年 | 2015年 | 2020年 |
| Moran's I指数 | −0.051 | 0.193 | 0.158 | 0.221 |
| 预期指数 | −0.071 | −0.071 | −0.071 | −0.071 |
| 方差 | 0.029 | 0.025 | 0.019 | 0.025 |
| Z得分 | 0.117 | 1.656 | 1.676 | 2.469 |
| P | 0.907 | 0.098 | 0.094 | 0.054 |
| [1] |
Bussiere R. The spatial distribution of urban populations[M]. Paris: Centre de Recherched' Urbanisme, 1970.
|
| [2] |
Dantzing G B, Saaty T L. Compact city: A plan for a liveable urban environment[J]. Contemporary Sociology, 1975, 4(4) 447
|
| [3] |
Newman P, Kenworthy J R. The transport energy trade-off: Fuel-efficient traffic versus fuel-efficient cities[J]. Transportation Research Part A General, 1988, 22(3) 163-174.
|
| [4] |
Commission of the European Communities. Green paper on the urban environment[R/OL]. http://aei.pitt.edu/1205/,1990-06-27.
|
| [5] |
Morrison N. The compact city: Theory versus practice—The case of cambridge[J]. Netherlands Journal of Housing and the Built Environment, 1998, 13(2) 157-179.
|
| [6] |
仇保兴. 紧凑度与多样性(2.0版): 中国城市可持续发展的两大核心要素[J]. 城市发展研究, 2012, 19(11) 1-12.
Qiu Baoxing. Compactness and diversity (Version 2.0): Two core elements of sustainable urban development in China[J]. Urban Studies, 2012, 19(11) 1-12.
|
| [7] |
马强, 徐循初. "精明增长"策略与中国的城市空间扩展[J]. 城市规划学刊, 2004, 151(3) 16-22.
Ma Qiang, Xu Xunchu. Smart growth policy and urban spatial expansion in China[J]. Urban Planning Forum, 2004, 151(3) 16-22.
|
| [8] |
方创琳, 祁巍锋. 紧凑城市理念与测度研究进展及思考[J]. 城市规划学刊, 2007(4) 65-73.
Fang Chuanglin, Qi Weifeng. Research progress and thinking of compact city and its measurement methods[J]. Urban Planning Forum, 2007(4) 65-73.
|
| [9] |
Cole J P. Study of major and minor civil divisions in political geography[C]. The 20th international geographical congress, Mimeographed, 1964.
|
| [10] |
林炳耀. 城市空间形态的计量方法及其评价[J]. 城市规划汇刊, 1998(3) 42-45+65.
Lin Bingyao. The calculation method of urban spatial form and its evaluation[J]. Urban Planning Forum, 1998(3) 42-45+65.
|
| [11] |
Burton, Elizabeth. Measuring urban compactness in UK towns and cities[J]. Planning and Design, 2016, 29(2) 219-250.
|
| [12] |
陈涛, 张越. 城市紧凑度对经济活力的影响机制——基于中国直辖市、省会城市的实证分析[J]. 城市问题, 2021(6) 34-42.
Chen Tao, Zhang Yue. A study on the mechanism of urban compactness on economic vitality: Based on the empirical analysis of direct-administered municipalities and provincial capitals in China[J]. Urban Problems, 2021(6) 34-42.
|
| [13] |
杨浩, 卢新海, 匡兵, 等. 城市紧凑度与碳排放强度的时空互动关系及驱动因素——以长株潭城市群为例[J]. 长江流域资源与环境, 2021, 30(11) 2618-2629.
Yang Hao, Lu Xinhai, Kuang Bing et al. Spatial-temoral interaction and driving factors of urban compactness and carbon emission intensity: A case study in Changsha-Zhuzhou-Xiangtan Urban Agglomeration[J]. Resources and Environment in The Yangtze Basin, 2021, 30(11) 2618-2629.
|
| [14] |
Saniroychansyah M, Farmawati A, Anindyah D S et al. Urban compactness effects on the distributions of healthy houses in Yogyakarta city[J]. Procedia-Social and Behavioral Sciences, 2016, 227: 168-173.
|
| [15] |
周春山, 叶昌东. 中国特大城市空间增长特征及其原因分析[J]. 地理学报, 2013, 68(6) 728-738.
Zhou Chunshan, Ye Changdong. Features and causes of urban spatial growth in Chinese metropolises[J]. Acta Geographica Sinica, 2013, 68(6) 728-738.
|
| [16] |
曹小曙, 梁斐雯, 陈慧灵. 特大城市空间形态差异对交通网络效率的影响[J]. 地理科学, 2019, 39(1) 41-51.
Cao Xiaoshu, Liang Feiwen, Chen Huiling. Influence of different spatial forms for metropolitans on transportation network efficiency[J]. Scientia Geographica Sinica, 2019, 39(1) 41-51.
|
| [17] |
Angel S. 城市星球[M]. 贺灿飞,等译. 北京: 科学出版社, 2015.
Angel S. Planet of cities. Translated by He Canfei et al. Beijing: Science Press, 2015.
|
| [18] |
蓝婷, 唐立娜, 徐智邦, 等. 基于Web of Science的城市空间紧凑度研究知识图谱分析[J]. 生态学报, 2022, 42(4) 1-11.
Lan Ting, Tang Lina, Xu Zhibang et al. Knowledge mapping analysis of urban compactness based on Web of Science[J]. Acta Ecologica Sinica, 2022, 42(4) 1-11.
|
| [19] |
Angel S, Jason P, Daniel L D. Ten compactness properties of circles: Measuring shape in geography[J]. Canadian Geographer, 2010, 54(4) 441-461.
|
| [20] |
沈清基, 徐溯源. 城市多样性与紧凑性: 状态表征及关系辨析[J]. 城市规划, 2009, 33(10) 25-34.
Shen Qingji, Xu Shuoyuan. Urban diversity and compactness: Characterization and relationship[J]. City Planning Review, 2009, 33(10) 25-34.
|
| [21] |
Richardson H. The economics of urban size[M]. Lexington: Lexington Books, 1973.
|
| [22] |
Angel S, Franco S A, Liu Y et al. The shape compactness of urban footprints[J]. Progress in Planning, 2018, 139: 100429
|
| [23] |
Huang J, X Lu X, M Sellers J. A global comparative analysis of urban form: Applying spatial metrics and remote sensing[J]. Landscape & Urban Planning, 2007, 82(4) 184-197.
|
| [24] |
贾梦圆, 刘晓阳, 陈天, 等. 中国地级及以上城市紧凑度测度[J]. 城市问题, 2019(11) 4-12.
Jia Mengyuan, Liu Xiaoyang, Chen Tian et al. Assessment of urban compactness in prefectural and above level cities of China[J]. Urban Problem, 2019(11) 4-12.
|
| [25] |
Boyce R R, Clark W A V. The concept of shape in geography[J]. The Geographical Review, 1964, 54: 561-572.
|
| [26] |
Soto V, Frias-Martinez V, Virseda J et al. Prediction of socioeconomic levels using cell phone records[C]// Girona, Spain: Proceedings of the 19th International Conference on User Modeling, Adaption, and Personalization, 2011: 377-388.
|
| [27] |
龙瀛, 茅明睿, 毛其智, 等. 大数据时代的精细化城市模拟: 方法、数据和案例[J]. 人文地理, 2014, 29(3) 7-13.
Long Ying, Mao Mingrui, Mao Qizhi et al. Fine-scale urban modeling and its opportunities in the "Big Data" era: Methods, data and empirical studies[J]. Human Geography, 2014, 29(3) 7-13.
|
| [28] |
Huang B, Wu B, Barry M. Geographically and temporally weighted regression for modeling spatio-temporal variation in house prices[J]. International Journal of Geographical Information Science, 2010, 24(4) 383-401.
|
| [29] |
赵广英, 宋聚生. 城市用地功能混合测度的方法改进[J]. 城市规划学刊, 2022(1) 51-58.
Zhao Guangying, Song Jusheng. Improving the measurement of urban land-use mix[J]. Urban Planning Forum, 2022(1) 51-58.
|
| [30] |
潘竟虎, 戴维丽. 1990—2010年中国主要城市空间形态变化特征[J]. 经济地理, 2015, 35(1) 44-52.
Pan Jinghu, Dai Weili. Spatial-temporal characteristics in urban morphology of majior cities in China during 1990—2010[J]. Economic Geography, 2015, 35(1) 44-52.
|
| [31] |
Angel S, Parent J, Civco D L et al. Atlas of urban expansion—2016 edition, volume 1: Areas and densities[M]. New York: New York University, 2016.
|
| [32] |
Feng L A, Xg A, Hd A et al. How do population inflow and social infrastructure affect urban vitality? Evidence from 35 large- and medium-sized cities in China—ScienceDirect[J]. Cities, 2020, 100: 102454
|
| [33] |
Pakz M Z, Ik M. Rethinking urban density, vitality and healthy environment in the post-pandemic city: The case of Istanbul[J]. Cities, 2022, 124: 103598
|
/
| 〈 |
|
〉 |