
企业异地投资视角下长三角城市经济增长的网络外部性研究
|
高鹏(1989—),男,山东济南人,博士,助理研究员,主要从事城市地理与区域发展研究。E-mail: geogaopeng@shnu.edu.cn |
收稿日期: 2022-01-26
修回日期: 2022-04-11
网络出版日期: 2023-07-20
基金资助
国家社会科学基金重大项目(22&ZD067)
版权
Network externalities of urban economic growth in the Yangtze River Delta from the perspective of enterprises' non-local investment
Received date: 2022-01-26
Revised date: 2022-04-11
Online published: 2023-07-20
Supported by
National Social Science Foundation of China(22&ZD067)
Copyright
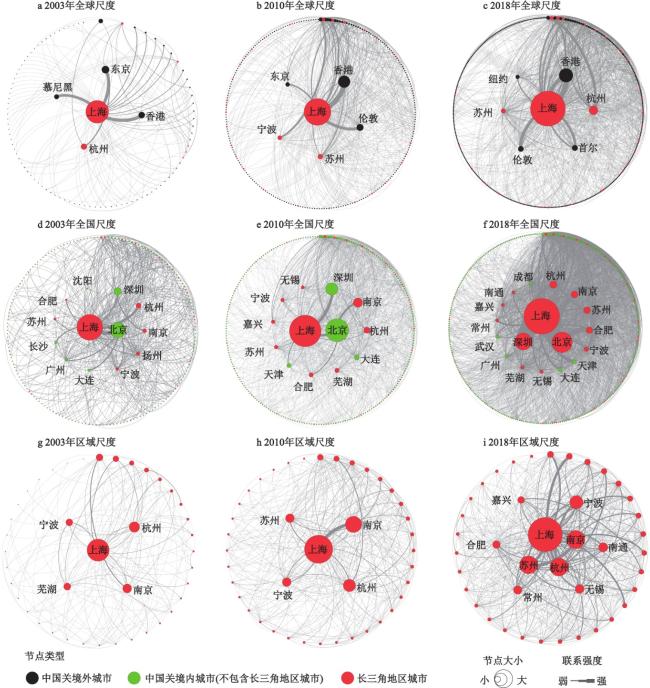
基于企业异地投资数据构建2003—2018年全球、全国及区域3个空间尺度的长三角城市网络,利用空间面板计量模型从分尺度、分时段、分区域等角度分析城市网络对城市经济增长的影响,揭示长三角存在的城市网络外部性特征。结果表明:① 长三角各尺度城市网络均在持续扩张,且呈现典型的核心-边缘结构特征。② 各尺度城市网络对城市经济增长均产生积极的影响,但影响程度呈现出全球>全国>区域的尺度差异。③ 随着时间的推移,嵌入全国和区域城市网络所带来的经济效益逐渐超过全球城市网络的影响,这从城市网络的角度证实了长三角地区转向内循环为主,既是现实表现,也是必然选择。④ 城市网络外部性存在明显的区域异质性,位于核心区域的城市在网络中获益较多,但城市网络对位于外围区域的城市影响逐渐增强。⑤ 与集聚外部性相比,网络外部性的重要性越来越突出,城市发展愈发依赖于建立和维持与其他城市之间联系的能力。
高鹏 , 宁越敏 , 何丹 , 张凡 . 企业异地投资视角下长三角城市经济增长的网络外部性研究[J]. 地理科学, 2023 , 43(7) : 1216 -1226 . DOI: 10.13249/j.cnki.sgs.2023.07.009
Based on the enterprises' non-local investment data, this paper constructs the global, national and regional urban networks in the Yangtze River Delta from 2003 to 2018, and then uses the spatial panel econometric model to comprehensively analyze the impact of urban networks on urban economic growth, so as to reveal the urban network externalities in the Yangtze River Delta. The results indicate that: 1) Urban networks of all scales in the Yangtze River Delta continue to expand and present a typical characteristic of core-periphery structure during the study period. 2) Urban networks of all scales have a positive impact on urban economic growth, but the degree of impact shows global > national > regional scale heterogeneity. 3) And over time, the economic benefits brought by embedding national and regional urban networks gradually exceed the impact of global urban networks, which shows that from the perspective of multi-scale urban networks, the Yangtze River Delta turns to internal circulation under a "dual circulation" development pattern, which is not only a realistic manifestation, but also an inevitable choice. This result provides direct research support for the dual circulation strategy in the Yangtze River Delta. 4) Due to different resource endowments and development stages in different regions of the Yangtze River Delta, the impact of urban network on urban economic growth has obvious regional heterogeneity. Cities located in the core region benefit more from the urban network, but the impact of urban network on cities located in the outer region gradually increases over time. 5) The agglomeration externality is an important factor affecting the improvement of urban economic performance. The externality and knowledge spillover effect brought by economic agglomeration under spatial constraints are still important driving forces in the evolution of economic geographical landscape. However, compared with agglomeration externality, the importance of urban network externality is becoming more and more prominent. This study can provide decision-making support for incorporating development strategies of urban network into the spatial policy system of national and local governments.
表1 分尺度SPDM的回归结果Table 1 Regression results of SPDM at different scales |
| 变量 | 模型1 | 模型2 | 模型3 | 模型4 | 变量 | 模型1 | 模型2 | 模型3 | 模型4 | |
| 注:GC、NC、RC分别表示全球、全国和区域尺度上的综合中心性,K为资本存量,EDU为人力资本,KSI为克鲁格曼专业化集聚指数,DIV为多样化集聚指数,DEN为人口密度,ρ和σ2为估计系数 ; ***、**、*分别表示在1%、5%和10%水平下显著;-表示未参与运算;全国尺度数据来源于A股上市企业年报,未覆盖到中国香港、中国澳门、中国台湾相关城市数据;全球尺度数据来源于 Bureau van Dijk 数据库,覆盖到中国香港、中国澳门、中国台湾相关城市数据。 | ||||||||||
| lnGC | 0.0130*** | - | - | 0.0160*** | W×lnGC | 0.582 0*** | - | - | 0.8000*** | |
| lnNC | - | 0.0067* | - | 0.0079* | W×lnNC | - | 0.0528 | - | 0.5631*** | |
| lnRC | - | - | 0.0047 | 0.0095* | W×lnRC | - | - | 0.3545** | 0.0741 | |
| lnK | 0.3271*** | 0.3587*** | 0.3520*** | 0.3339*** | W×lnK | 4.0340*** | 4.2300*** | 4.4387*** | 2.5677*** | |
| lnEDU | 0.0218** | 0.0335*** | 0.0264** | 0.0210* | W×lnEDU | 0.5733*** | 1.6683*** | 1.8614*** | 0.1361 | |
| lnKSI | 0.0523*** | 0.0551*** | 0.0534*** | 0.0550*** | W×lnKSI | -0.8567** | -0.4845 | -0.6757* | -0.0321 | |
| lnDIV | 0.0447*** | 0.0491*** | 0.0538*** | 0.0423** | W×lnDIV | 1.1100** | 0.8571 | -0.7017 | 1.441 0*** | |
| lnDEN | 0.0348*** | 0.0330*** | 0.0305*** | 0.0350*** | W×lnDEN | 2.0219*** | 1.9352*** | 1.9532*** | 0.9136*** | |
| ρ | 6.2331*** | 6.2206*** | 6.0778*** | 0.0037*** | σ2 | 0.0034*** | 0.0036*** | 0.0036*** | 5.1111*** | |
| R2 | 0.2617 | 0.2256 | 0.1827 | 0.5962 | Log-L | 924.3297 | 900.9589 | 902.7590 | 939.8301 | |
表2 分尺度空间效应分解Table 2 Decomposed spatial effects at different scales |
| 变量 | lnGC | lnNC | lnRC | lnK | lnEDU | lnKSI | lnDIV | lnDEN |
| 注:变量含义见表1; ***、**、*分别表示在1%、5%和10%水平下显著;全国尺度数据来源于A股上市企业年报,未覆盖到中国香港、中国澳门、中国台湾相关城市数据;全球尺度数据来源于 Bureau van Dijk 数据库,覆盖到中国香港、中国澳门、中国台湾相关城市数据。 | ||||||||
| 直接效应 | 0.0124*** | 0.0112** | 0.0105** | 0.3292*** | 0.0223* | 0.0566*** | 0.0369** | 0.0319*** |
| 溢出效应 | 0.0716*** | 0.0593*** | 0.0110 | 0.0833*** | 0.0262 | –0.0309 | 0.1148** | 0.0731** |
| 总效应 | 0.0841*** | 0.0705*** | 0.0216* | 0.4125*** | 0.0485 | 0.0257 | 0.1517*** | 0.1050*** |
表3 分时段空间效应分解Table 3 Decomposed spatial effects in different stages |
| 变量 | 2003—2010年 | 2011—2018年 | |||||
| 直接效应 | 溢出效应 | 总效应 | 直接效应 | 溢出效应 | 总效应 | ||
| 注: 变量含义见表1;***、**、*分别表示在1%、5%和10%水平下显著;全国尺度数据来源于A股上市企业年报,未覆盖到中国香港、中国澳门、中国台湾相关城市数据;全球尺度数据来源于 Bureau van Dijk 数据库,覆盖到中国香港、中国澳门、中国台湾相关城市数据。 | |||||||
| lnGC | 0.0366* | 0.0279** | 0.0645*** | 0.0238*** | 0.0058** | 0.0296*** | |
| lnNC | 0.0049 | 0.0521*** | 0.0571*** | 0.0455*** | 0.0186*** | 0.0642*** | |
| lnRC | –0.0026 | 0.0187 | 0.0161 | 0.0238** | 0.0097** | 0.0335** | |
| lnK | 0.3173*** | 0.0779*** | 0.3952*** | 0.2792*** | 0.1138*** | 0.3930*** | |
| lnEDU | 0.0089 | 0.1094** | 0.1183*** | 0.0505*** | 0.0207*** | 0.0712*** | |
| lnKSI | –0.0015 | 0.0827 | 0.0812* | 0.0394*** | 0.0161*** | 0.0555*** | |
| lnDIV | 0.0636** | 0.0926 | 0.1562** | –0.0042 | –0.0017 | –0.0059 | |
| lnDEN | 0.0036 | –0.0177 | –0.0141 | 0.0049 | 0.0021 | 0.0070 | |
表4 长三角核心区域空间效应分解Table 4 Decomposed spatial effects for the core area in the Yangtze River Delta |
| 变量 | 2003—2018年 | 2003—2010年 | 2011—2018年 | ||||||||
| 直接效应 | 溢出效应 | 总效应 | 直接效应 | 溢出效应 | 总效应 | 直接效应 | 溢出效应 | 总效应 | |||
| 注: 变量含义见表1;***、**、*分别表示在1%、5%和10%水平下显著;全国尺度数据来源于A股上市企业年报,未覆盖到中国香港、中国澳门、中国台湾相关城市数据;全球尺度数据来源于 Bureau van Dijk 数据库,覆盖到中国香港、中国澳门、中国台湾相关城市数据。 | |||||||||||
| lnGC | 0.0200*** | 0.0058*** | 0.0258*** | 0.0095*** | 0.0028** | 0.0122*** | 0.0090** | 0.0031** | 0.0121** | ||
| lnNC | 0.0217*** | 0.0063*** | 0.0281*** | 0.0141** | 0.0040** | 0.0181** | 0.0255** | 0.0044** | 0.0299*** | ||
| lnRC | 0.0247* | 0.0013 | 0.0260* | 0.0319** | 0.0092** | 0.0411** | 0.0274* | 0.0049 | 0.0322 | ||
| lnK | 0.4589*** | 0.1331*** | 0.5920*** | 0.4771*** | 0.1366*** | 0.6137*** | 0.4565*** | 0.0800*** | 0.5364*** | ||
| lnEDU | 0.0697*** | 0.0203*** | 0.0900*** | 0.0464*** | 0.0136** | 0.0600*** | 0.0439** | 0.0078** | 0.0516** | ||
| lnKSI | 0.0779*** | 0.0227*** | 0.1007*** | 0.0371* | 0.0111 | 0.0482* | 0.0861*** | 0.0150*** | 0.1011*** | ||
| lnDIV | 0.0658*** | 0.0192*** | 0.0850*** | –0.0145 | -0.0039 | -0.0183 | 0.0840*** | 0.0146*** | 0.0987*** | ||
| lnDEN | 0.0215** | 0.0062** | 0.0277** | 0.0107 | 0.0031 | 0.0137 | 0.0293*** | 0.0052*** | 0.0345*** | ||
表5 长三角外围区域空间效应分解Table 5 Decomposed spatial effects for the peripheral area in the Yangtze River Delta |
| 变量 | 2003—2018年 | 2003—2010年 | 2011—2018年 | ||||||||
| 直接效应 | 溢出效应 | 总效应 | 直接效应 | 溢出效应 | 总效应 | 直接效应 | 溢出效应 | 总效应 | |||
| 注:变量含义见表1; ***、**、*分别表示在0.01、0.05和0.1水平下显著;全国尺度数据来源于A股上市企业年报,未覆盖到中国香港、中国澳门、中国台湾相关城市数据;全球尺度数据来源于 Bureau van Dijk 数据库,覆盖到中国香港、中国澳门、中国台湾相关城市数据。 | |||||||||||
| lnGC | 0.0057 | 0.0033 | 0.0090 | 0.0047 | 0.0041 | 0.0087 | 0.0040 | 0.0018 | 0.0057 | ||
| lnNC | 0.0017 | 0.0010 | 0.0027 | 0.0059 | 0.0051 | 0.0110 | 0.0179*** | 0.0107*** | 0.0286*** | ||
| lnRC | 0.0285*** | 0.0168*** | 0.0454*** | 0.0099*** | 0.0086** | 0.0186*** | 0.0236* | 0.0103* | 0.0339* | ||
| lnK | 0.2939*** | 0.1730*** | 0.4670*** | 0.2764*** | 0.2404*** | 0.5168*** | 0.2728*** | 0.1195*** | 0.3923*** | ||
| lnEDU | 0.0285** | 0.0168** | 0.0453** | –0.0002 | –0.0004 | –0.0006 | 0.0812*** | 0.0361*** | 0.1172*** | ||
| lnKSI | 0.0342* | –0.0203* | 0.0140* | –0.0357 | –0.0311 | –0.0667 | 0.0140* | 0.0064 | 0.0204 | ||
| lnDIV | –0.0253 | –0.0146 | –0.0399 | –0.0437 | –0.0375 | –0.0813 | –0.0248 | –0.0106 | –0.0353 | ||
| lnDEN | 0.0082 | 0.0048 | 0.0130 | –0.0057 | –0.0051 | –0.0108 | –0.0050 | –0.0021 | –0.0071 | ||
| [1] |
高鹏, 何丹, 宁越敏, 等. 长三角地区城市投资联系水平的时空动态及影响因素[J]. 地理研究, 2021, 40(10): 2760-2779.
|
| [2] |
赵新正, 李秋平, 芮旸, 等. 基于财富500强中国企业网络的城市网络空间联系特征[J]. 地理学报, 2019, 74(4): 694-709.
|
| [3] |
孙东琪, 陆大道, 孙斌栋, 等. 从网络描述走向网络绩效——“城市网络外部性”专辑序言[J]. 地理研究, 2022, 41(9): 2325-2329.
|
| [4] |
林柄全, 谷人旭, 王俊松, 等. 从集聚外部性走向跨越地理边界的网络外部性——集聚经济理论的回顾与展望[J]. 城市发展研究, 2018, 25(12): 82-89.
|
| [5] |
|
| [6] |
陆军, 毛文峰. 城市网络外部性的崛起: 区域经济高质量一体化发展的新机制[J]. 经济学家, 2020(12): 62-70.
|
| [7] |
|
| [8] |
|
| [9] |
|
| [10] |
|
| [11] |
|
| [12] |
Schmitt P, Smas L. Nordic 'intercity connectivities' in a multi-scalar perspective[J]. Nordregio Working Paper, 2012(7): 10-88.
|
| [13] |
Hall P G, Pain K. The polycentric metropolis: Learning from mega-city regions in Europe[M]. London, UK: Earthscan, 2008.
|
| [14] |
|
| [15] |
|
| [16] |
程玉鸿, 苏小敏. 城市网络外部性研究述评[J]. 地理科学进展, 2021, 40(4): 713-720.
|
| [17] |
盛科荣, 陈欢欢, 张嘉慧, 等. 航空网络嵌入对中国城市知识生产的影响研究[J]. 地理科学, 2022, 42(6): 963-974.
|
| [18] |
种照辉, 高志红, 覃成林. 网络基础设施建设与城市间合作创新——“宽带中国”试点及其推广的证据[J]. 财经研究, 2022, 48(3): 79-93.
|
| [19] |
丁亮, 徐志乾, 章俊屾, 等. 长三角城市网络外部性的空间异质性[J]. 地理研究, 2022, 41(9): 2433-2447.
|
| [20] |
焦敬娟, 张齐林, 吴宇勇, 等. 中国异地投资网络结构演化及影响因素研究[J]. 地理科学进展, 2021, 40(8): 1257-1268.
|
| [21] |
高鹏, 宁越敏, 何丹. 长三角地区多尺度城市网络空间演化及互馈效应研究[J]. 地理科学, 2022, 42(10): 1767-1777.
|
| [22] |
|
| [23] |
国家统计局. 中国统计年鉴[M]. 北京: 中国统计出版社, 2019.
National Bureau of Statistics. China statistical yearbook. Beijing: China Statistics Press, 2019.
|
| [24] |
United Nations. The world's cities in 2018: Data booklet[M]. New York: UN, 2018.
|
| [25] |
|
| [26] |
Lesage J, Pace R K. Introduction to spatial econometrics[M]. Florida: Chemical Rubber Company Press, 2009.
|
| [27] |
张军, 吴桂英, 张吉鹏. 中国省际物质资本存量估算: 1952-2000[J]. 经济研究, 2004, 39(10): 35-44.
|
| [28] |
Krugman P R. Geography and trade[M]. Cambridge: MIT press, 1993.
|
| [29] |
孙祥栋, 张亮亮, 赵峥. 城市集聚经济的来源: 专业化还是多样化——基于中国城市面板数据的实证分析[J]. 财经科学, 2016(2): 113-122.
|
| [30] |
|
| [31] |
国家统计局. 中国城市统计年鉴[M]. 2004—2019. 北京: 中国统计出版社, 2004—2019.
National Bureau of Statistics of China. China urban statistical yearbook. 2004—2019. Beijing: China Statistics Press, 2004—2019.
|
| [32] |
孙斌栋, 李琬. 城市规模分布的经济绩效——基于中国市域数据的实证研究[J]. 地理科学, 2016, 36(3): 328-334.
|
/
| 〈 |
|
〉 |