
建成环境视角下县域空间韧性动态变化及响应机制研究
|
陈晓红(1978—),女,山东日照人,博士,教授,博士生导师,研究方向为人地系统韧性。E-mail: chenxh440@163.com |
收稿日期: 2022-12-01
修回日期: 2023-03-10
录用日期: 2023-04-07
网络出版日期: 2024-01-12
基金资助
黑龙江省自然科学基金项目(JJ2023LH0720)
黑龙江省哲学社会科学研究规划项目(21JLE323)
哈尔滨师范大学2022年社会服务能力提升项目(1305123124)
版权
Dynamic change and response mechanism of county spatial resilience under the perspective of built environment: A case of Harbin-Changchun Urban Agglomeration
Received date: 2022-12-01
Revised date: 2023-03-10
Accepted date: 2023-04-07
Online published: 2024-01-12
Supported by
Natural Science Foundation of Heilongjiang(JJ2023LH0720)
Philosophy and Social Sci ences Research Program of Heilongjiang(21JLE323)
Harbin Normal University 2022 Social Service Capacity Improvement Project(1305123124)
Copyright
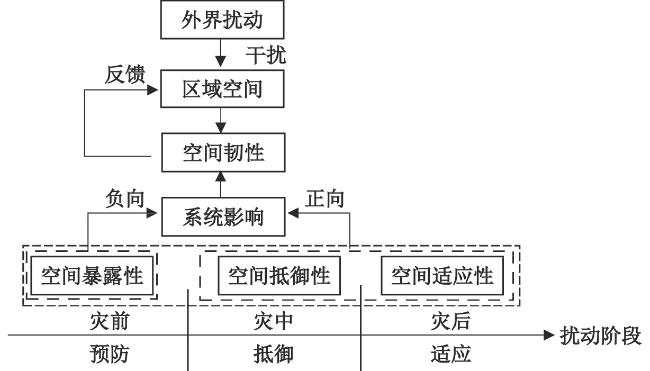
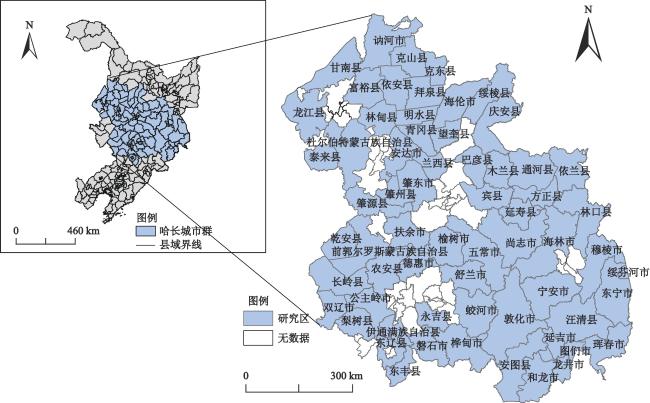
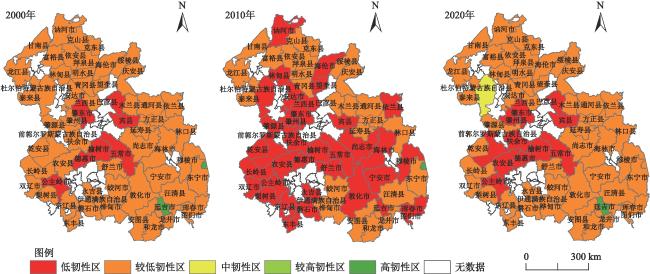
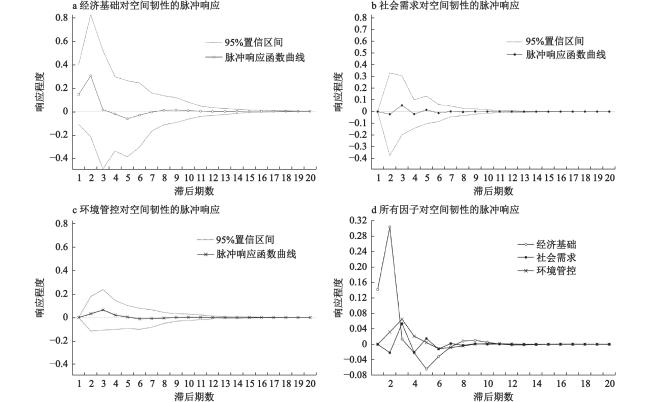
韧性是高质量发展的基石,县域作为中国最基本的行政单元,探索其空间韧性的动态演变规律,对区域空间高质量发展研究具有重要意义。以哈长城市群63个县域为研究对象,基于空间“暴露-抵御-适应”维度,运用空间自相关、VAR模型等研究方法,分析其2000—2020年空间韧性的动态变化及响应机制。研究表明:① 2000—2020年,哈长城市群空间韧性指数有所上升,但县域整体空间韧性不强,始终以较低韧性为主。② 哈长城市群空间上整体呈现四周高中间低的“盆地式”格局,其中,低韧性区以抱团状分布于哈长城市群中部地区,中韧性区与高韧性区呈“聚点式”位于哈长城市群东西两侧。③ 哈长城市群县域空间韧性不同等级韧性区域间空间差异性显著,同等级韧性区域间有明显空间集聚特征,但集聚趋势减弱。④ 经济基础对哈长城市群县域空间韧性的冲击最为强烈,与空间韧性间形成显著的动态响应关系;哈长城市群县域空间韧性对社会需求与环境管控的响应具有时滞性,波动起伏较小,对空间韧性起推动作用。
陈晓红 , 马雪菲 , 王颖 , 谷岳 , 刘海涵 , 李启才 , 潘玮 . 建成环境视角下县域空间韧性动态变化及响应机制研究[J]. 地理科学, 2023 , 43(12) : 2119 -2129 . DOI: 10.13249/j.cnki.sgs.2023.12.006
Resilience is the cornerstone of high-quality development. County is the most basic administrative unit in China, exploring the dynamic evolution law of its spatial resilience is of great significance to the high-quality development of regional space. This paper takes 63 counties in the Harbin-Changchun Urban Agglomeration as the research object, and analyzes the dynamic changes of their spatial resilience and response mechanism from 2000 to 2020 based on the dimension of spatial "exposure-resistance-adaptation", using spatial autocorrelation, VAR model and other research methods, in order to further improve the theoretical system of China's spatial resilience research and provide reference for other urban agglomeration counties in China. At the same time, this paper provides new ideas for the regional system to adapt to complex disturbances by accurately quantifying and diagnosing the dynamic changes of county spatial resilience in the Harbin-Changchun Urban Agglomeration. The results show that: 1) From 2000 to 2020, the resilience index of the Harbin-Changchun Urban Agglomeration has increased, but the overall county spatial resilience is not strong and is always dominated by lower resilience, and the geographical distribution of spatial resilience in 63 counties is concentrated. 2) The Harbin-Changchun Urban Agglomeration spatially presents a 'basin-like' pattern with a high surrounding and a low center, in which the low-resilience zone is distributed in the central part of the Harbin-Changchun Urban Agglomeration in the shape of a group, and the middle-resilience zone and the high-resilience zone are located on the east and west sides of the Harbin-Changchun Urban Agglomeration in the shape of a 'cluster'. 3) The spatial variability of different levels of resilient areas in the county spatial resilience of the Harbin-Changchun Urban Agglomeration is significant, and the spatial clustering characteristics between resilient areas of the same level are significant, but the trend of clustering is weakening. 4) The spatial resilience of counties in the Harbin-Changchun Urban Agglomeration was initially affected by its own development. With the evolution of time, the three factors of economic foundation, social demand and environmental control have had different degrees of impact on spatial resilience. The response of the spatial resilience of counties in the Harbin-Changchun Urban Agglomeration to economic foundation is the most active, forming a significant dynamic response relationship with the spatial resilience. The response of the spatial resilience of counties in the Harbin-Changchun Urban Agglomeration to social demand and environmental control has a time lag and less fluctuation, which is a driving force for the improvement of the spatial resilience of counties.
表1 哈长城市群县域空间韧性评价指标体系Table 1 Spatial resilience evaluation indicator system of counties in Harbin-Changchun Urban Agglomeration |
| 准则层 | 指标层 | 指标示意 | 指标性质 |
| 注:+为正向指标,-为负向指标。 | |||
| 空间暴露性 | 自然气候暴露度 | 年降水量/建设用地面积 | - |
| 边界形态暴露度 | 地形起伏度 | - | |
| 碳排放量暴露度 | 碳排放量/建设用地面积 | - | |
| 大气污染暴露度 | PM2.5/建设用地面积 | + | |
| 人口空间集聚度 | 人口空间分布指数 | - | |
| 紧凑度指数 | + | ||
| 空间抵御性 | 空间经济发展 | 财政支出/建设用地面积 | + |
| 人均地区生产总值 | + | ||
| 社会空间保障 | 医疗卫生床位数/(建设用地面积×人口规模) | + | |
| 人群活动活跃度 | 人口密度 | + | |
| 总从业人口/建设用地面积 | + | ||
| 土地多样性 | 多样性指数 | + | |
| 空间适应性 | 经济生产适应力 | 公共预算收入/建设用地面积 | + |
| 规模以上工业总产值/建设用地面积 | + | ||
| 粮食产量/建设用地面积 | + | ||
| 社会保障适应力 | 基本建设投资完成额/建设用地面积 | + | |
| 居民生活适应力 | 城乡居民储蓄存款/建设用地面积 | + | |
表2 哈长城市群县域空间韧性驱动因素指标体系Table 2 Indicator system of factors influencing the spatial resilience of counties in Harbin-Changchun Urban Agglomeration |
| 目标层 | 指标层 | 属性 | 指标示意 |
| 注:+为正向指标,-为负向指标。 | |||
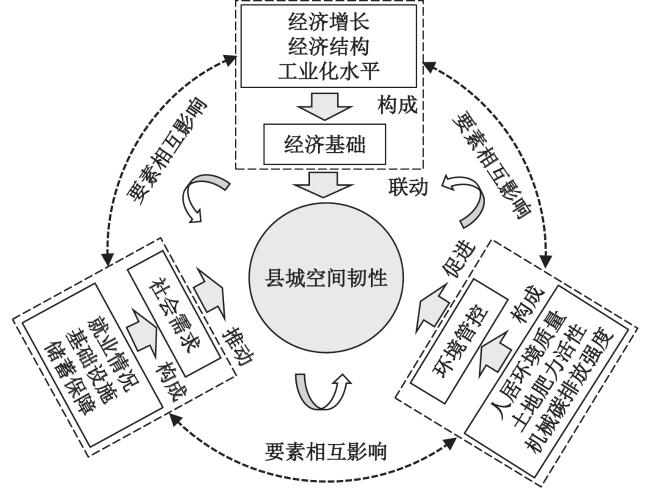
| 经济基础 (EB) | 经济增长(x1) | + | 公共财政收入占GDP比重 |
| 经济结构(x2) | + | 第二产业占GDP比重 | |
| 工业化水平(x3) | + | 规模以上工业总产值/规模工业企业个数 | |
| 社会需求 (SN) | 就业情况(x4) | + | 从业人员数/年末总人口 |
| 储蓄保障(x5) | + | 人均城乡居民存储余额 | |
| 基础设施(x6) | + | 每万人拥有的医疗床位数 | |
| 环境管控 (EC) | 人居环境质量(x7) | - | PM2.5排放量/绿地面积 |
| 土地肥力活性(x8) | - | 化肥施用量/耕地面积 | |
| 机械碳排放强度(x9) | - | CO2排放量/农业机械总动力 | |
表3 数据来源与说明Table 3 Data sources and descriptions |
| 数据类型 | 数据来源 |
| 注:由于时间跨度较大,个别缺失数据由相应年份统计公报补齐。 | |
| 地形起伏度 | 地理空间数据云(http://www.gscloud.cn) |
| 人口空间分布指数 | 中国科学院资源环境科学数据中心(http://www.resdc.cn) |
| 行政区划矢量数据 | 国家基础地理信息中心(http://www.resdc.cn) |
| 土地利用数据 | 中国科学院资源环境科学数据中心(http://www.resdc.cn) |
| 大气污染数据 | 国家统计局(http://www.stats.gov.cn/) |
| 社会经济指标 | 《中国县域统计年鉴》[35](2001年、2011年、2021年) 《吉林统计年鉴》[36](2001年、2011年、2021年) 《黑龙江统计年鉴》[37](2001年、2011年、2021年) |
表4 哈长城市群县域空间韧性描述性统计Table 4 Descriptive statistics of the spatial resilience of counties in Harbin-Changchun Urban Agglomeration |
| 统计量 | 2000年 | 2010年 | 2020年 |
| 平均值 | -0.0072 | -0.0237 | -0.0047 |
| 标准差 | 0.0228 | 0.0614 | 0.0667 |
| 变异系数 | -3.1333 | -2.5962 | -14.1970 |
| 偏态系数 | 4.1905 | 5.1467 | 7.5287 |
| 峰态系数 | 20.7671 | 38.6348 | 58.7542 |
表5 2000年、2010年和2020年哈长城市群县域空间韧性全局Moran's I指数Table 5 Global Moran's I index of spatial resilience of counties in Harbin-Changchun Urban Agglomeration in 2000, 2010 and 2020 |
| Moran's I指数及统计量 | 2000年 | 2010年 | 2020年 |
| Moran's I | 0.1082 | 0.0501 | 0.0172 |
| Z-score | 1.4337 | 0.9995 | 1.0761 |
| P-value | 0.1517 | 0.3176 | 0.2819 |
表6 哈长城市群县域空间韧性驱动因素数据的平稳性检验Table 6 Stationarity test for data on factors influencing the spatial resilience of counties in the Harbin-Changchun Urban Agglomeration |
| 变量 | ADF检验 | 显著性水平 | 结论 | ||
| P值 | T统计量 | 1%临界值 | |||
| 注:EB为经济基础、SN为社会需求、EC为环境管控、R为空间韧性;D(*)为变量一阶拆分结果。 | |||||
| EB | 0.0190 | -3.861438 | -4.297073 | 平稳 | |
| SN | 0.0057 | -4.696677 | -4.297073 | 平稳 | |
| EC | 0.9130 | -0.153483 | -4.420595 | 不平稳 | |
| R | 0.0758 | -2.934348 | -4.297073 | 不平稳 | |
| D(EB) | 0.0008 | -6.524414 | -4.420595 | 平稳 | |
| D(SN) | 0.0376 | -3.538265 | -4.582648 | 平稳 | |
| D(EC) | 0.0021 | -5.696232 | -4.420595 | 平稳 | |
| D(R) | 0.0067 | -3.107970 | -2.886101 | 平稳 | |
表7 哈长城市群县域空间韧性脉冲响应方差分解Table 7 Variance decomposition of impulse response to spatial resilience of counties in Harbin-Changchun Urban Agglomeration |
| 1期 | 2期 | 3期 | 4期 | 5期 | 6期 | 7期 | 8期 | 9期 | 10期 | |
| 注:数据均表示该内生变量对县域空间韧性的贡献率,单位%。 | ||||||||||
| 县域空间韧性 | 88.2 | 56.9 | 55.9 | 58.5 | 57.9 | 57.7 | 57.8 | 57.8 | 57.8 | 57.8 |
| 经济基础 | 11.8 | 42.5 | 41.0 | 38.3 | 38.9 | 39.0 | 38.9 | 38.9 | 38.9 | 38.9 |
| 社会需求 | 0.0 | 0.2 | 1.2 | 1.3 | 1.4 | 1.4 | 1.4 | 1.4 | 1.4 | 1.4 |
| 环境管控 | 0.0 | 0.4 | 1.9 | 1.9 | 1.9 | 1.9 | 1.9 | 1.9 | 1.9 | 1.9 |
| [1] |
袁贞贞, 王秋红, 王勇, 等. 多情景模拟下重庆市土地利用变化对生态系统健康的影响[J]. 生态学报, 2023, 43(20): 8279-8291.
|
| [2] |
|
| [3] |
|
| [4] |
|
| [5] |
|
| [6] |
|
| [7] |
|
| [8] |
|
| [9] |
|
| [10] |
|
| [11] |
|
| [12] |
|
| [13] |
|
| [14] |
李鑫, 罗彦. 基于城市公共安全的韧性城市构建和规划思考[J]. 城市, 2017(10): 41-48.
|
| [15] |
刘志敏, 修春亮, 宋伟. 城市空间韧性研究进展[J]. 城市建筑, 2018(35): 16-18.
|
| [16] |
孙立, 田丽. 基于韧性特征的城市老旧社区空间韧性提升策略[J]. 北京规划建设, 2019(6): 109-113.
|
| [17] |
李丽娜, 达良俊, 由文辉. 城市脆弱性驱动因子分析[J]. 城市问题, 2009(11): 18-21.
|
| [18] |
赵冬月, 陈长坤, 易亮, 等. 城市韧性多因素综合评估模型研究[J]. 中国安全生产科学技术, 2022, 18(5):54-59.
|
| [19] |
李连刚, 张平宇, 谭俊涛, 等. 韧性概念演变与区域经济韧性研究进展[J]. 人文地理, 2019, 34(2): 1-7+151.
|
| [20] |
杨敏行, 黄波, 崔翀, 等. 基于韧性城市理论的灾害防治研究回顾与展望[J]. 城市规划学刊, 2016(1): 48-55.
|
| [21] |
汪辉, 任懿璐, 卢思琪, 等. 以生态智慧引导下的城市韧性应对洪涝灾害的威胁与发生[J]. 生态学报, 2016, 36(16): 4958-4960.
|
| [22] |
修春亮, 魏冶, 王绮. 基于“规模-密度-形态”的大连市城市韧性评估[J]. 地理学报, 2018, 73(12): 2315-2328.
|
| [23] |
张明斗, 冯晓青. 长三角城市群内各城市的城市韧性与经济发展水平的协调性对比研究[J]. 城市发展研究, 2019, 26(1): 82-91.
|
| [24] |
陈晓红, 娄金男, 王颖. 哈长城市群城市韧性的时空格局演变及动态模拟研究[J]. 地理科学, 2020, 40(12): 2000-2009.
|
| [25] |
|
| [26] |
刘志敏, 修春亮, 宋伟. 城市空间韧性研究进展[J]. 城市建筑, 2018, 304(35): 18-20.
|
| [27] |
新华社. 中办国办印发《关于推进以县城为重要载体的城镇化建设的意见》[N]. 人民日报, 2022-05-07(001).
The Xinhua News Agency. The State Office of the Central Committee issued the Opinions on Promoting the Construction of Urbanization with the County as an Important Carrier. People's Daily, 2022-05-07(001).
|
| [28] |
国家统计局. 中国县域统计年鉴[M]. 北京: 中国统计出版社, 2001-2021.
National Bureau of Statistics. China county statistical yearbook. Beijing: China Statistics Press, 2001, 2011, 2021.
|
| [29] |
杨秀平, 王里克, 李亚兵, 等. 韧性城市研究综述与展望[J]. 地理与地理信息科学, 2021, 37(6): 78-84.
|
| [30] |
黄永斌, 董锁成, 白永平, 等. 中国地级以上城市紧凑度时空演变特征研究[J]. 地理科学, 2014, 34(5): 531-538.
|
| [31] |
孙久文, 周孝伦. 多维视角下的长三角城市群空间结构及其影响因素——基于NPP-VIIRS夜间灯光数据和高德人口迁徙数据[J]. 经济地理, 2023, 43(5): 78-88.
|
| [32] |
布仁仓, 胡远满, 常禹, 等. 景观指数之间的相关分析[J]. 生态学报, 2005(10): 2764-2775.
|
| [33] |
|
| [34] |
刘涛, 曹广忠, 边雪, 等. 城镇化与工业化及经济社会发展的协调性评价及规律性探讨[J]. 人文地理, 2010, 25(6): 47-52.
|
| [35] |
国家统计局. 中国县域统计年鉴(县市卷)[M]. 北京: 中国统计出版社, 2001, 2011, 2021.
National Bureau of Statistics. China statistical yearbook (county-level). Beijing: China Statistics Press, 2001, 2011, 2021.
|
| [36] |
吉林省统计局. 吉林统计年鉴[M]. 北京: 中国统计出版社, 2001, 2011, 2021.
Jilin Statistical Bureau. Jilin statistical yearbook. Beijing: China Statistics Press, 2001, 2011, 2021.
|
| [37] |
黑龙江省统计局. 黑龙江统计年鉴[M]. 北京: 中国统计出版社, 2001, 2011, 2021.
Heilongjiang Statistical Bureau. Heilongjiang statistical yearbook. Beijing: China Statistics Press, 2001, 2011, 2021.
|
/
| 〈 |
|
〉 |