
基于生活方式视角的城市青年居民交通出行与居住区位选择行为——以南京市为例
|
刘凯(1988—),男,江苏南通人,博士,讲师,研究方向为城市交通规划。E-mail: liukaiwap@163.com |
收稿日期: 2022-11-06
修回日期: 2023-04-15
网络出版日期: 2024-01-17
基金资助
国家自然科学基金重点项目(71732003)
教育部人文社会科学基金项目(20YJCZH098)
江苏省高等学校自然科学研究项目(20KJD580004)
版权
Travel mode choice and residential location choice behavior of urban youth residents based on the concept of lifestyle: A case of Nanjing
Received date: 2022-11-06
Revised date: 2023-04-15
Online published: 2024-01-17
Supported by
National Natural Science Foundation of China(71732003)
The Ministry of Education of Humanities and Social Science Project of China(20YJCZH098)
The Natural Science Foundation of the Jiangsu Higher Education Institutions of China(20KJD580004)
Copyright
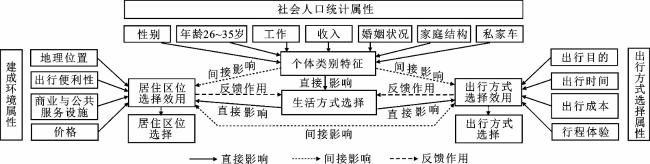
引入生活方式概念并作为城市青年居民细分指标,通过构建潜在类别选择模型,探讨青年居民日常交通出行方式及居住区位选择行为。基于调查数据,采用聚类分析将青年居民生活方式分为 “市区+个人公共交通+家庭私家车”导向、“市区+个人出行无偏好+家庭私家车”导向、“市区+个人/家庭私家车”导向、“市郊+个人/家庭公共交通”导向、“市郊+个人/家庭私家车”导向,及“市郊+个人公共交通+宅家”导向6种类型。随后基于模型参数估计结果,研究城市青年居民生活方式、出行方式及居住区位选择间的内在联系。相关研究成果与结论为理解城市青年居民时空选择行为差异提供了理论支持。
刘凯 , 徐媛 , 周晶 , 张敏婕 . 基于生活方式视角的城市青年居民交通出行与居住区位选择行为——以南京市为例[J]. 地理科学, 2024 , 44(1) : 99 -108 . DOI: 10.13249/j.cnki.sgs.20221352
Constructing a youth-friendly urban environment has emerged as a crucial developmental objective in numerous Chinese cities. However, the financial capacity to sustain urban living and transportation exerts a significant impact on the mental well-being, livelihoods, and work of young residents. Based on this, first of all, we have developed a latent class choice model that incorporates the notion of lifestyle to investigate the intricate relationship between lifestyle choices, daily travel mode preferences, and residential location decisions among urban youths. Then, this study presents a novel instrument for measuring urban youth residents’ transport-related and residential-related lifestyles. Subsequently, a comprehensive survey comprising 37 items was developed and conducted in Nanjing from April to June 2022, targeting individuals aged between 25 and 36 years, to gather data encompassing demographic characteristics, travel patterns, and residential location information. Principal component analysis is used to reduce the lifestyle instrument’s 37 items to 8 dimensions. Cluster analysis is applied to identifing 6 classes of urban youths. The final solution has 6 transport-related and residential-related lifestyle segments, which are profiled in terms of relevant background characteristics. Such as: “urban dwelling with personal public transport and family private car orientation”, “urban dwelling with personal travel without preference and family private car orientation”, “urban dwelling with personal and family private car orientation”, “suburb dwelling with personal and family public transport orientation”, “suburb dwelling with personal and family private car orientation”, and “suburb dwelling with personal public transport and staycation orientation”. Finally, utilizing the developed latent class choice model, this study further examines the disparities among various lifestyle segments and investigates the influence of lifestyle on daily travel mode choices and residential location preferences among urban youth residents. The latent class choice model’s parameters estimation results indicate significant differences among each lifestyle segment, which are consistent with the previously identified profiles of the transport-related and residential-related lifestyle segments. Moreover, the parameter estimation results for socio-demographic attributes (referring to vector parameter α), residential location attributes (referring to vector parameter β), and daily travel mode choice (referring to vector parameter γ) of each lifestyle segment further confirm that urban youth residents’ lifestyle choices have a significant influence on their daily travel mode choices and residential location choices. Additionally, incorporating the concept of lifestyle enhances the predictive accuracy of the model. In sum, lifestyle segmentation proves to be a valuable tool for urban managers to understand the disparities and similarities in daily travel mode choices and residential location choices among urban youth residents, and can help urban managers can gain better insights into diverse choice behaviors among young urban residents which can inform effective people-oriented management initiatives. eople-oriented management initiatives.
表1 调查样本群体社会人口属性统计结果Table 1 Statistical results of socio-demographic attributes of the sample group |
| 统计变量 | 描述 | 人数 | 占比/% | 统计变量 | 描述 | 人数 | 占比/% | |
| 性别 | 男 | 334 | 45.07 | 家庭年收入 | 8万元以下 | 54 | 7.29 | |
| 女 | 407 | 54.93 | [8, 15) 万 | 201 | 27.13 | |||
| 工作经验 | 1 a以内 | 2 | 0.27 | [15, 30] 万 | 362 | 48.85 | ||
| [1, 3) a | 115 | 15.52 | 30万以上 | 124 | 16.73 | |||
| [3, 8] a | 460 | 62.08 | 已婚家庭结构 | 未生育 | 58 | 9.78 | ||
| 8 a以上 | 164 | 22.13 | 1个小孩 | 453 | 76.39 | |||
| 婚姻状况 | 未婚 | 148 | 19.97 | 2个及以上小孩 | 82 | 13.83 | ||
| 已婚 | 593 | 80.03 | 是否拥有私家车 | 是 | 691 | 93.25 | ||
| 否 | 50 | 6.75 |
表2 因子命名及聚类结果Table 2 Factor renaming and clustering results |
| 因子类型 | 聚类类别方差分析差异对比结果(平均值) | F值 | P值 | |||||
| 类别1 (n=129) | 类别2 (n=141) | 类别3 (n=126) | 类别4 (n=152) | 类别5 (n=108) | 类别6 (n=85) | |||
| 注:1.n为各类别群体人数;2. 类别1~6分别为聚类后所得的生活方式一 (L1):以“市区+个人公共交通+家庭私家车”为导向、生活方式二(L2):以“市区+个人出行无偏好+家庭私家车”为导向、生活方式三(L3):以“市区+个人\家庭私家车”为导向、生活方式四(L4):以“市郊+个人\家庭公共交通”为导向、生活方式五 (L5):以“市郊+个人\家庭私家车”为导向、生活方式六 (L6):以“市郊+个人公共交通+宅家”为导向的6类具有不同生活方式的城市青年居民群体。 | ||||||||
| 因子1:私家车出行偏好 | -0.46 | 0.03 | 0.41 | -0.24 | 0.43 | -0.35 | 10.156 | <0.001 |
| 因子2:家庭与社交出行 | -0.19 | 0.40 | 0.45 | 0.26 | -0.30 | -1.81 | 73.819 | <0.001 |
| 因子3:居住区位交通出行偏好 | 0.14 | 0.21 | 0.78 | -0.27 | -0.19 | -0.31 | 25.284 | <0.001 |
| 因子4:出行时间偏好 | -1.17 | 0.31 | 0.46 | -0.27 | 0.56 | -0.36 | 85.347 | <0.001 |
| 因子5:居住区位公共服务设施 | 0.08 | 0.14 | 0.48 | -0.19 | -0.53 | -0.05 | 14.979 | <0.001 |
| 因子6:出行兴趣 | 0.14 | -1.33 | 0.90 | 0.28 | 0.08 | 0.04 | 143.858 | <0.001 |
| 因子7:出行成本偏好 | -0.20 | 0.34 | 0.33 | 0.46 | 0.31 | -1.98 | 182.768 | <0.001 |
| 因子8:行程体验 | 0.44 | 0.22 | 0.50 | -1.23 | 0.43 | -0.11 | 108.417 | <0.001 |
表3 聚类类别群体社会人口属性统计结果Table 3 Statistical results of socio-demographic attributes of each cluster class |
| 变量 | 描述 | 类别1占比/% | 类别2占比/% | 类别3占比/% | 类别4占比/% | 类别5占比/% | 类别6占比/% |
| 注:括号内的值为该统计小项下男性群体占比;类别1~6解释见表2。 | |||||||
| 性别 | 男 | 44 | 38 | 47 | 47 | 47 | 48 |
| 女 | 56 | 62 | 53 | 53 | 53 | 52 | |
| 工作经验 | 1 a以内(男) | 0 (0) | 1 (0) | 0 (0) | 1 (0) | 0 (0) | 0 (0) |
| [1,3) a(男) | 22 (39) | 10 (29) | 16(45) | 19 (34) | 6 (67) | 21 (22) | |
| [3,8] a(男) | 60 (44) | 66 (37) | 64 (47) | 63 (53) | 60(45) | 58 (51) | |
| 8 a以上(男) | 19 (50) | 23 (48) | 20 (48) | 18 (44) | 34 (49) | 21(67) | |
| 家庭年收入 | 8万元以下(男) | 8 (70) | 1 (100) | 9 (64) | 11 (29) | 1 (0) | 15 (38) |
| [8,15)万元(男) | 28 (33) | 21 (33) | 25 (35) | 36 (54) | 15 (63) | 40 (50) | |
| [15,30]万元(男) | 50 (49) | 55 (37) | 48 (55) | 44 (46) | 54 (48) | 40 (53) | |
| 30万元以上(男) | 14 (39) | 22 (42) | 19(33) | 9 (50) | 31 (39) | 5 (25) | |
| 婚姻状况 | 未婚(男) | 27 (37) | 5 (29) | 17 (38) | 25 (39) | 16 (59) | 35 (50) |
| 已婚(男) | 73 (47) | 95 (39) | 83 (49) | 75 (50) | 84 (45) | 65 (47) | |
| 已婚家庭结构 | 未生育(男) | 17 (81) | 10 (36) | 5 (40) | 11 (54) | 4 (67) | 11 (67) |
| 1个小孩(男) | 71 (39) | 79 (41) | 73 (44) | 75 (43) | 69(42) | 69 (42) | |
| 2个及以上(男) | 12 (45) | 10 (29) | 22 (65) | 13 (87) | 20 (55) | 20 (55) | |
| 私家车 | 有 | 95 | 97 | 95 | 88 | 97 | 86 |
| 无 | 5 | 3 | 5 | 12 | 3 | 14 | |
表4 潜在类别模型中变量权重参数 α、β及γ的估计结果Table 4 Estimation results of the weight parameters α, β, and γ for the respective variables in the latent class models |
| 参数 | 参数含义 | L1 | L2 | L3 | L4 | L5 | L6 |
| 注:* 在95%水平上不显著; a L1为个体属性特征参数评估时的参照组,因此估计值为0;括号内数值为t统计量;α为变量向量Xi对应的权重参数向量; | |||||||
| α | 类属常量 | 0 a | -0.47 (-0.55) | -1.50 (-9.35) | -1.27 (-9.35) | -1.95 (-9.35) | -4.33 (-9.35) |
| α1 | 男性 | 0 a | -1.07 (-1.21) | 0.12 (0.54) | 0.19 (0.30) | 0.11 (0.61) | 1.19 (3.20) |
| α2 | 已婚 | 0 a | 1.60 (2.17) | 1.12 (1.20) | 0.33 (0.35) | 0.89 (0.94) | -1.28 (-1.37) |
| α3 | 私家车保有量 | 0 a | 0.31 (0.35) | 0.06* (0.08) | -0.21 (-0.24) | 0.29 (0.33) | -0.33 (-0.35) |
| α4 | 收入 | 0 a | 7.67 (29.45) | 5.80 (21.67) | 2.74 (7.03) | 8.83 (36.92) | 3.44 (11.55) |
| α5 | 工作经验 | 0 a | 4.11 (13.77) | 3.54 (11.74) | 3.30 (11.01) | 3.95 (12.29) | 3.13 (10.40) |
| α6 | 家庭结构 | 0 a | -1.14 (-5.01) | 0.81 (4.40) | -0.97 (-4.17) | 0.79 (4.35) | -1.25 (-5.30) |
| β11 | 市区出行便利性 | 0.86 (1.78) | 4.90 (8.56) | 1.05 (3.76) | -1.31 (-2.10) | -0.16 (-1.32) | 0.02* (0.14) |
| β12 | 市区商业与公共服务设施 | 1.43 (3.75) | 3.74 (2.87) | 1.32 (4.05) | -2.43 (-4.15) | -0.21 (-1.75) | -0.34 (-2.10) |
| β13 | 市区房价 | 0.11* (1.12) | 0.01* (0.18) | 0.08* (0.10) | -0.06* (-0.19) | 0.09* (0.38) | -0.01* (-0.11) |
| β21 | 市郊出行便利性 | -0.71 (-2.32) | -2.3 (-2.64) | 0.47 (0.40) | 3.13 (4.77) | 0.39 (0.56) | 6.10 (10.88) |
| β22 | 市郊商业与公共服务设施 | -9.56 (-19.80) | -1.94 (-1.40) | 0.89 (2.57) | 2.86 (3.80) | 0.43 (0.77) | 1.18 (2.44) |
| β23 | 市郊房价 | -0.03* (-0.21) | 0.01* (0.17) | 0.73 (1.21) | 0.04* (0.12) | 0.01* (0.04) | 0.60 (1.01) |
| γ111 | 公共交通家庭出行时间 | -5.32 (-12.10) | -3.20 (-5.98) | -8.38 (-27.67) | -1.32 (-4.89) | -4.60 (-8.17) | -0.56 (-1.20) |
| γ112 | 公共交通家庭出行成本 | -6.60 (-13.69) | -4.11 (-7.32) | -6.77 (-21.00) | -1.35 (-4.96) | -2.32 (-3.22) | -0.31*(-0.87) |
| γ113 | 公共交通家庭出行体验 | -4.69 (-9.81) | -2.87 (-3.55) | -9.10 (-30.40) | -0.63 (-2.81) | -6.08(-13.90) | -0.14*(-0.54) |
| γ121 | 公共交通社交出行时间 | -1.33 (-2.49) | -3.97 (-6.01) | -4.80 (-11.76) | -0.65* (-1.90) | -1.77 (-2.10) | -3.74 (-4.21) |
| γ122 | 公共交通社交出行成本 | -0.69 (-1.30) | -2.11 (-4.43) | -2.77 (-5.23) | -0.51 (-1.21) | -1.40* (-1.03) | -4.11 (-5.99) |
| γ123 | 公共交通社交出行体验 | -1.14 (-1.97) | -3.78 (-5.87) | -4.15 (-10.12) | -1.25* (-2.88) | -1.61 (-1.49) | -2.57 (-1.93) |
| γ131 | 公共交通工作出行时间 | -3.22 (-8.87) | -1.63* (-5.77) | -4.67 (-11.03) | -2.18 (-3.60) | -7.93 (-17.67) | -0.60 (-2.77) |
| γ132 | 公共交通工作出行成本 | -2.81 (-5.19) | -1.52 (-4.78) | -3.87 (-9.33) | -1.79 (-2.94) | -5.62 (-12.90) | -0.31*(-1.45) |
| γ133 | 公共交通工作出行体验 | -7.39 (-13.81) | -5.53 (-24.30) | -6.71 (-17.44) | -0.70* (-1.32) | -1.06 (-4.55) | -0.03*(-0.52) |
| γ211 | 私家车家庭出行时间 | -2.15 (-5.21) | -1.98 (-6.20) | -0.77 (-1.61) | -4.90 (-10.02) | -0.93 (-2.10) | -0.77 (-3.79) |
| γ212 | 私家车家庭出行成本 | -3.13 (-7.28) | -1.24 (-5.52) | -1.09 (-2.64) | -3.58 (-8.89) | -1.82 (-4.77) | -0.43 (-2.30) |
| γ213 | 私家车家庭出行体验 | -1.78 (-3.92) | -0.31 (-3.22) | -0.23 (-1.03) | -1.48 (-2.73) | -1.51 (-3.98) | -0.22* (-1.44) |
| γ221 | 私家车社交出行时间 | -3.31 (-9.20) | -3.27 (-9.59) | -1.25 (-3.55) | -2.83 (-4.26) | -1.69 (-9.17) | -3.10 (-11.21) |
| γ222 | 私家车社交出行成本 | -4.74 (-12.04) | -2.52 (-7.60) | -0.80 (-2.07) | -3.77 (-6.58) | -4.32 (-32.00) | -3.91 (-13.77) |
| γ223 | 私家车社交出行体验 | -1.76 (-2.48) | -5.99 (-14.87) | -1.72 (-4.70) | -1.60 (-2.95) | -1.91 (-11.02) | -4.48 (-16.30) |
| γ231 | 私家车工作出行时间 | -4.34 (-13.40) | -1.71 (-6.99) | -0.61 (-1.80) | -3.87 (-6.00) | -2.00 (-6.22) | -2.77 (-9.71) |
| γ232 | 私家车工作出行成本 | -5.10 (-19.66) | -1.49 (-4.01) | -2.78 (-5.77) | -4.40 (-8.42) | -2.74 (-8.05) | -3.95* (-13.02) |
| γ233 | 私家车工作出行体验 | -5.55 (-22.13) | -4.03 (-17.64) | -1.94 (-3.53) | -2.01 (-4.95) | -1.51 (-4.17) | -1.60*(-5.78) |
| [1] |
聂伟, 蔡培鹏. 让城市对青年发展更友好: 社会质量对青年获得感的影响研究[J]. 中国青年研究, 2021(3): 53-60+119.
Nie Wei, Cai Peipeng. Making cities more youth-friendly: The impact of social quality on youth’s sense of achievement. China Youth Study, 2021(3): 53-60+119.
|
| [2] |
赵秋丽, 冯帆, 张顺军, 等. 山东推动建设青年发展友好型城市[N]. 光明日报, 2021-10-29.
Zhao Qiuli, Feng Fan, Zhang Shunjun et al. Shangdong promotes the development of a youth friendly city. Guangming Daily, 2021-10-29.
|
| [3] |
万膑莲, 翟国方, 何仲禹, 等. 住房与交通可支付能力空间特征研究——以南京市为例[J]. 经济地理, 2016, 36(2): 87-94+116.
Wan Binlian, Zhai Guofang, He Zhongyu et al. Spatial characteristics analysis of housing and transportation affordability—A case study of Nanjing. Economic Geography, 2016, 36(2): 87-94+116.
|
| [4] |
塔娜, 柴彦威. 理解中国城市生活方式: 基于时空行为的研究框架[J]. 人文地理, 2019, 34(2): 17-23.
Ta Na, Chai Yanwei. Understanding the lifestyle in Chinese cities: A framework based on space-time behavior research. Human Geography, 2019, 34(2): 17-23.
|
| [5] |
Thøgersen J. Transport-related lifestyle and environmentally-friendly travel mode choices: A multi-level approach[J]. Transportation Research Part A:Policy and Practice, 2018, 107: 166-186.
|
| [6] |
Van Acker V, Goodwin P, Witlox F. Key research themes on travel behavior, lifestyle, and sustainable urban mobility[J]. International Journal of Sustainable Transportation, 2016, 10(1): 25-32.
|
| [7] |
Van Acker V, Sandoval S, Cools M. Value-based approach to assess the impact of lifestyles on mode shares[J]. Transportation Research Record, 2021, 2675(3): 313-325.
|
| [8] |
Salomon I, Ben-Akiva M. The use of the life-style concept in travel demand models[J]. Environment & Planning A, 1983, 15(5): 623-638.
|
| [9] |
齐航, 于跃洋, 王光超, 等. 策略性交通出行选择行为研究评述: 实验经济学方法的应用[J]. 交通运输工程与信息学报, 2022, 20(3): 141-153.
Qi Hang, Yu Yueyang, Wang Guangchao et al. A literature review of laboratory experimental studies of travel decisions under strategic uncertainty in directed transportation networks: The application of experimental economics methodology. Journal of Transportation Engineering and Information, 2022, 20(3): 141-153.
|
| [10] |
永贵, 许岩. 基于时间成本的瓶颈道路组合收费与出行方式选择均衡研究[J]. 系统工程理论与实践, 2022, 42(7): 1917-1926.
Yong Gui, Xu Yan. Combined pricing of bottleneck road and mode choice equilibrium based on time cost. Systems Engineering-Theory & Practice, 2022, 42(7): 1917-1926.
|
| [11] |
刘凯, 周晶. 交通信息诱导下的混合用户均衡模型研究[J]. 系统工程理论与实践, 2020, 40(2): 415-425.
Liu Kai, Zhou Jing. Study on the mixed user equilibrium model under the influence of traffic guidance information. Systems Engineering-Theory & Practice, 2020, 40(2): 415-425.
|
| [12] |
杨振山, 吴笛, 杨定. 迁居意愿、地方依赖和社区认同——北京中关村地区居住选择调查分析[J]. 地理科学进展, 2019, 38(3): 417-427.
Yang Zhenshan, Wu Di, Yang Ding. Willingness to move, place dependence and community identity: An investigation of residential choice in the Zhongguancun area in Beijing. Progress in Geography, 2019, 38(3): 417-427.
|
| [13] |
Scheuer S, Haase D, Haase A et al. A glimpse into the future of exposure and vulnerabilities in cities? Modelling of residential location choice of urban population with random forest[J]. Natural Hazards and Earth System Sciences, 2021, 21(1): 203-217.
|
| [14] |
宋伟轩, 毛宁, 陈培阳, 等. 基于住宅价格视角的居住分异耦合机制与时空特征——以南京为例[J]. 地理学报, 2017, 72(4): 589-602.
Song Weixuan, Mao Ning, Chen Peiyang et al. Coupling mechanism and spatial-temporal pattern of residential differentiation from the perspective of housing prices: A case study of Nanjing. Acta Geographica Sinica, 2017, 72(4): 589-602.
|
| [15] |
Gehrke S R, Singleton P A, Clifton K J. Understanding stated neighborhood preferences: The roles of lifecycle stage, mobility style, and lifestyle aspirations[J]. Travel Behaviour and Society, 2019, 17: 62-71.
|
| [16] |
Kim S, Rasouli S. The influence of latent lifestyle on acceptance of Mobility-as-a-Service (MaaS): A hierarchical latent variable and latent class approach[J]. Transportation Research Part A: Policy and Practice, 2022, 159: 304-319.
|
| [17] |
塔娜, 柴彦威, 关美宝. 北京郊区居民日常生活方式的行为测度与空间-行为互动[J]. 地理学报, 2015, 70(8): 1271-1280.
Ta Na, Chai Yanwei, Guan Meibao. Suburbanization, daily lifestyle and space-behavior interaction in Beijing. Acta Geographica Sinica, 2015, 70(8): 1271-1280.
|
| [18] |
Onderwater M, Boisjoly G, El-Geneidy A. Influence of travel behavior, personal preferences, and lifestyle on perceived convenience to amenities among Calgary residents[J]. Transportation Research Board, 2019, 2673(8): 036119811984496.
|
| [19] |
Rahman M, Sciara G C. Travel attitudes, the built environment and travel behavior relationships: Causal insights from social psychology theories[J]. Transport Policy, 2022, 123: 44-54.
|
| [20] |
Walker J L, Li J. Latent lifestyle preferences and household location decisions[J]. Journal of Geographical Systems, 2007, 9(1): 77-101.
|
| [21] |
周洁, 柴彦威. 中国老年人空间行为研究进展[J]. 地理科学进展, 2013, 32(5): 722-732.
Zhou Jie, Chai Yanwei. Research progress on spatial behaviors of the elderly in China. Progress in Geography, 2013, 32(5): 722-732.
|
| [22] |
许伟麟, 柴彦威. 移动性地理学视角下时空间行为研究创新[J]. 地理学报, 2023, 78(4): 1015-1027.
Xu Weilin, Chai Yanwei. Advances in space-time behavior studies: From the perspective of Geographies of mobility. Acta Geographica Sinica, 2023, 78(4): 1015-1027.
|
| [23] |
何保红, 李静, 王雨佳. 时间社会学视角下老年人对家庭出行行为的影响研究[J]. 交通运输系统工程与信息, 2020, 20(6): 77-83.
He Baohong, Li Jing, Wang Yujia. Influence of the elderly on family travel behavior with time sociology. Journal of Transportation Systems Engineering and Information Technology, 2020, 20(6): 77-83.
|
| [24] |
朱秋宇, 塔娜. 职住建成环境对郊区居民通勤方式的影响——以上海市为例[J]. 世界地理研究, 2021, 30(2): 433-442.
Zhu Qiuyu, Ta Na. The impact of built environment in neighborhood and workplace on suburban residents’ commuting mode: A case study in Shanghai. World Regional Studies, 2021, 30(2): 433-442.
|
| [25] |
李春江, 张艳, 刘志林, 等. 通勤时间、社区活动对社区社会资本的影响: 基于北京26个社区的调查研究[J]. 地理科学, 2021, 41(9): 1606-1614.
Li Chunjiang, Zhang Yan, Liu Zhilin et al. The influence of commute duration and community activities on community social capital: A study based on 26 communities survey in Beijing. Scientia Geographica Sinica, 2021, 41(9): 1606-1614.
|
| [26] |
Ardeshiri A, Vij A. Lifestyles, residential location, and transport mode use: A hierarchical latent class choice model[J]. Transportation Research Part A: Policy and Practice, 2019, 126(8): 342-359.
|
| [27] |
Paepe L D, Vos J D, van Acker V et al. Changes in travel behavior during the transition from secondary to higher education: A case study from Ghent, Belgium[J]. Journal of Transport and Land Use, 2018, 11(1): 477-498.
|
| [28] |
申悦, 柴彦威. 基于性别比较的北京城市居民活动的时空弹性研究[J]. 地理学报, 2017, 72(12): 2214-2225.
Shen Yue, Chai Yanwei. Space-time flexibility of daily activities and gender differences: A case study of Beijing. Acta Geographica Sinica, 2017, 72(12): 2214-2225.
|
| [29] |
刘建荣, 郝小妮. 基于随机系数Logit模型的市内出行方式选择行为研究[J]. 交通运输系统工程与信息, 2019, 19(5): 108-113.
Liu Jianrong, Hao Xiaoni. Travel mode choice in city based on random parameters logit model. Journal of Transportation Systems Engineering and Information Technology, 2019, 19(5): 108-113.
|
| [30] |
韩会然, 杨成凤. 不同住房产权下居民居住区位选择的影响因素研究——以北京都市区为例[J]. 现代城市研究, 2022(9): 27-33.
Han Huiran, Yang Chengfeng. Study on impact factors of residential location choice of urban residents in different housing property: A case study on the Beijing. Modern Urban Research, 2022(9): 27-33.
|
| [31] |
陈欣欣, 郭洪涛. 因子分析和Logistic回归在农业上市公司财务预警中的联合运用[J]. 数理统计与管理, 2022, 41(1): 11-24
Chen Xinxin, Guo Hongtao. Study on financial crisis warning of agricultural listed companies based on factor analysis and Logistic regression model. Journal of Applied Statistics and Management. 2022, 41(1): 11-24.
|
| [32] |
施文幸, 曹诗韵. 基于萤火虫K-means聚类的电力用户画像构建和应用[J]. 计算机系统应用, 2021, 30(8): 281-287
Shi Wenxing, Cao Shiyun. Construction and application of power user profile based on firefly K-means clustering. Computer Systems & Applications, 2021, 30(8): 281-287.
|
| [33] |
Moodi F, Saadatfar H. An improved K-means algorithm for big data[J]. IET Software, 2022, 16(1): 48-59.
|
/
| 〈 |
|
〉 |