
中国优秀旅游城市旅游经济空间格局演变特征及影响因素
|
林玉英(1988—),女,福建龙岩人,副教授,博士后,硕导,主要从事旅游地理、旅游可持续发展等研究。E-mail: linyuying2019@fjnu.edu.cn |
收稿日期: 2023-06-20
修回日期: 2023-09-27
网络出版日期: 2024-07-11
基金资助
福建省自然科学基金项目(2023J01514)
国家自然科学基金项目(41901221)
版权
Spatial patten evolution characteristics and influencing factors of tourism economy in Chinese excellent tourism cities
Received date: 2023-06-20
Revised date: 2023-09-27
Online published: 2024-07-11
Supported by
Natural Science Foundation of Fujian Province(2023J01514)
National Natural Science Foundation of China(41901221)
Copyright
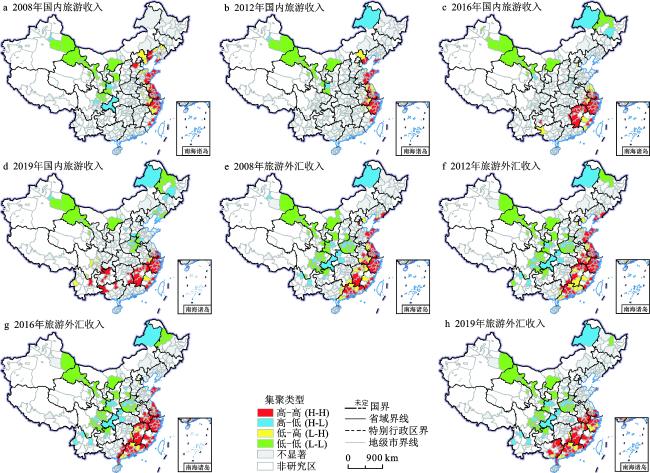
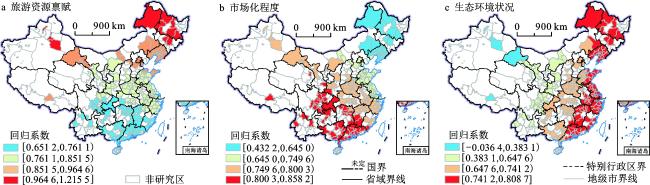
基于2008—2019年中国优秀旅游城市的旅游经济相关指标的面板数据,采用空间自相关、探索性回归及地理加权回归(GWR)等方法,探究中国优秀旅游城市旅游经济的空间格局及影响因素。结果表明:① 中国优秀旅游城市的旅游经济存在较强的空间相关性,高−高(H-H)和低−低(L-L)集聚的城市数量较多,呈现“大分散,小聚集”的两级分化格局;H-H集聚区主要集中于东部沿海地区,而L-L集聚区主要集中在西部地区;2008—2019年,研究区总体集聚格局相对稳定,但局部地区集聚格局有所变化。② 国内旅游收入影响因子最优组合为旅游资源禀赋、产业结构、交通运输条件、生态环境状况;旅游外汇收入影响因子最优组合为旅游资源禀赋、对外开放程度、市场化程度、生态环境状况。③ 各因子影响程度均呈现明显的空间异质性,各因子对中国优秀旅游城市旅游经济的影响随样本单元的变化而变化,研究结果可为各城市制定相应的旅游经济发展对策提供科学依据。
林玉英 , 靳一东 , 张发梓 , 葛阳 , 张琳 , 伍世代 . 中国优秀旅游城市旅游经济空间格局演变特征及影响因素[J]. 地理科学, 2024 , 44(6) : 973 -983 . DOI: 10.13249/j.cnki.sgs.20230579
With the increase in demand for national tourism, China has fully entered the era of mass tourism. However, due to differences in conditions for the development of tourism in China, the development of the tourism economy is spatially unbalanced, which hinders the coordinated development of the regional tourism economy. The total tourism economy of Chinese excellent tourist cities accounts for a high proportion of the country’s total tourism economy, and a study with them as the target can more accurately reflect the situation of Chinese tourism economy, which is more meaningful for the enhancement of the tourism economy. Based on the panel data of tourism economy-related indicators of Chinese excellent tourism cities from 2008—2019, spatial autocorrelation, exploratory regression and Geographically Weighted Regression (GWR) were used to explore the spatial patterns and influencing factors of the tourism economy of Chinese excellent tourism cities. Adopting the GWR model considering “spatial non-stationarity” to explore the influencing factors of tourism economy can more scientifically measure the intrinsic influencing mechanism of regional tourism economic development differences. The results show that: 1) The tourism economy of Chinese excellent tourism cities has strong spatial correlation, and the number of cities with high-high (H-H) and low-low (L-L) agglomerations is high, showing a two-tiered pattern of “large dispersion and small agglomeration”. During 2008—2019, the overall agglomeration pattern of tourism economy in Chinese excellent tourism cities is relatively stable, but the agglomeration pattern in local areas has changed. 2) Based on exploratory regression analysis, the optimal combination of factors influencing domestic tourism income is: tourism resource endowment, industrial structure, transportation conditions, and ecological environment condition; the optimal combination of factors influencing tourism foreign exchange income is: tourism resource endowment, degree of opening to the outside world, degree of marketization, and ecological environment condition. 3) The results of GWR model analysis show that the degree of influence of each factor shows obvious spatial heterogeneity, indicating that the influence of each factor on the tourism economy of Chinese excellent tourism cities is not static, but changes with the change of sample units, and the research results can provide a scientific basis for each city to formulate corresponding measures for tourism economic development.
表1 2008—2019年中国优秀旅游城市国内旅游收入及旅游外汇收入的全局Moran’s I值Table 1 Global Moran’s I value of domestic tourism income and tourism foreign exchange income of Chinese excellent tourist cities from 2008 to 2019 |
| 年份 | 国内旅游收入 | 旅游外汇收入 | |||||
| Moran’s I | Z得分 | P值 | Moran’s I | Z得分 | P值 | ||
| 注:暂缺港澳台数据。 | |||||||
| 2008 | 0.1503 | 9.8632 | 0.0000 | 0.2165 | 14.4039 | 0.0000 | |
| 2009 | 0.1561 | 10.2360 | 0.0000 | 0.2375 | 15.3929 | 0.0000 | |
| 2010 | 0.1490 | 9.7848 | 0.0000 | 0.2309 | 14.9942 | 0.0000 | |
| 2011 | 0.1371 | 8.9796 | 0.0000 | 0.2373 | 15.3726 | 0.0000 | |
| 2012 | 0.1333 | 8.7897 | 0.0000 | 0.2205 | 14.3064 | 0.0000 | |
| 2013 | 0.1193 | 9.9002 | 0.0000 | 0.2129 | 13.8333 | 0.0000 | |
| 2014 | 0.1437 | 9.4617 | 0.0000 | 0.2289 | 14.8390 | 0.0000 | |
| 2015 | 0.1482 | 9.7446 | 0.0000 | 0.2282 | 14.7998 | 0.0000 | |
| 2016 | 0.1553 | 10.1902 | 0.0000 | 0.2206 | 14.3182 | 0.0000 | |
| 2017 | 0.1208 | 7.9867 | 0.0000 | 0.2226 | 14.4453 | 0.0000 | |
| 2018 | 0.1084 | 7.2044 | 0.0000 | 0.1997 | 12.9267 | 0.0000 | |
| 2019 | 0.1035 | 6.8833 | 0.0000 | 0.1799 | 11.6267 | 0.0000 | |
表2 中国优秀旅游城市旅游经济影响因子的探索性回归分析结果Table 2 Results of exploratory regression analysis of tourism economic influence factors in Chinese excellent tourist cities |
| 影响因子组合 | 矫正R2 | AICc | VIF | |
| 注:暂缺港澳台数据。 | ||||
| 国内旅游收入 | 旅游资源禀赋、产业结构、交通运输条件、生态环境状况 | 0.6300 | 19.0300 | 1.2300 |
| 旅游资源禀赋、市场化程度、交通运输条件、生态环境状况 | 0.6000 | 34.0900 | 1.1200 | |
| 旅游外汇收入 | 旅游资源禀赋、对外开放程度、市场化程度、生态环境状况 | 0.6400 | 376.3600 | 1.1200 |
| 旅游资源禀赋、对外开放程度、市场化程度、交通运输条件 | 0.6300 | 384.7000 | 1.2200 | |
| 旅游资源禀赋、产业结构、市场化程度、生态环境状况 | 0.6100 | 394.5800 | 1.2700 | |
表3 中国优秀旅游城市旅游经济影响因子GWR和OLS模型的拟合参数对比Table 3 Comparison of fitting parameters of GWR and OLS models for tourism economic impact factors in Chinese excellent tourist cities |
| 拟合模型 | 因变量 | Sigma值 | R2 | AICc |
| 注:暂缺港澳台数据。 | ||||
| GWR | 国内旅游收入 | 0.2270 | 0.7080 | −12.6360 |
| 旅游外汇收入 | 0.6020 | 0.6680 | 371.1940 | |
| OLS | 国内旅游收入 | 0.2490 | 0.6330 | 19.0330 |
| 旅游外汇收入 | 0.6740 | 0.5750 | 415.3910 | |
表4 各因子对中国优秀旅游城市旅游经济影响的GWR系数对比Table 4 Comparison of GWR coefficients for the impact of each factor on the tourism economy of Chinese excellent tourism cities |
| 旅游经济 | 影响因子 | 最小值 | 最大值 | 平均值 | 标准偏差 |
| 注:暂缺港澳台数据。 | |||||
| 国内旅游收入 | 旅游资源禀赋 | 0.7690 | 1.1780 | 0.8510 | 0.0500 |
| 产业结构 | −0.1590 | 0.4100 | 0.2760 | 0.0690 | |
| 交通运输条件 | 0.2690 | 0.8100 | 0.4840 | 0.1180 | |
| 生态环境状况 | −0.0470 | 0.5090 | 0.4020 | 0.0930 | |
| 旅游外汇收入 | 旅游资源禀赋 | 0.6510 | 1.2160 | 0.8060 | 0.0950 |
| 对外开放程度 | −0.0210 | 0.0570 | 0.0490 | 0.0120 | |
| 市场化程度 | 0.4320 | 0.8580 | 0.7560 | 0.0830 | |
| 生态环境状况 | −0.0360 | 0.8090 | 0.7070 | 0.1150 | |
| [1] |
王新越, 孟繁卿, 朱文亮. 我国热门旅游城市旅游经济空间分异及影响因素——基于地理探测器方法的研究[J]. 地域研究与开发, 2020, 39(2): 76-81.
|
| [2] |
崔丹, 李沅曦, 吴殿廷. 京津冀地区旅游经济增长的时空演化及影响因素[J]. 地理学报, 2022, 77(6): 1391-1410.
|
| [3] |
陆林, 余凤龙. 中国旅游经济差异的空间特征分析[J]. 经济地理, 2005, 25(3): 406-410.
|
| [4] |
陈智博, 吴小根, 汤澍, 等. 江苏旅游经济发展的空间差异[J]. 经济地理, 2008, 28(6): 1064-1067
|
| [5] |
汪德根, 陈田. 中国旅游经济区域差异的空间分析[J]. 地理科学, 2011, 31(5): 528-536
|
| [6] |
赵磊. 中国旅游经济发展时空差异演变: 1999—2009[J]. 旅游论坛, 2014, 7(2): 6-15.
|
| [7] |
李在军, 管卫华, 蒲英霞, 等. 山东省旅游经济的时空演变格局探究[J]. 经济地理, 2013, 33(7): 176-181
|
| [8] |
沈惊宏, 陆玉麒, 周玉翠, 等. 安徽省国内旅游经济增长与区域差异空间格局演变[J]. 地理科学, 2012, 32(10): 1220-1228
|
| [9] |
孙晓, 刘力钢, 陈金. 东北三省旅游经济质量的区域差异、动态演进及影响因素[J]. 地理科学, 2021, 41(5): 832-841
|
| [10] |
吴媛媛, 宋玉祥. 中国旅游经济空间格局演变特征及其影响因素分析[J]. 地理科学, 2018, 38(9): 1491-1498
|
| [11] |
朱海艳, 孙根年, 李君轶. 中国31省市国内旅游经济差异影响因素的空间计量研究[J]. 干旱区资源与环境, 2019, 33(5): 197-202
|
| [12] |
杨懿, 汪洋周颖, 赵子晨. 高铁开通对城市旅游经济影响的区域差异研究[J]. 财经理论与实践, 2022, 43(2): 67-75
|
| [13] |
生延超, 刘晴. 人力资本促进区域旅游经济效率的空间差异研究[J]. 地理科学, 2020, 40(10): 1710-1719
|
| [14] |
|
| [15] |
|
| [16] |
程金龙. 中国区域旅游经济差异演变及主导因素分析[J]. 华东经济管理, 2018, 32(12): 56-62
|
| [17] |
孙盼盼, 戴学锋. 中国区域旅游经济差异的空间统计分析[J]. 旅游科学, 2014, 28(2): 35-48.
|
| [18] |
乔花芳, 高茜茜, 谢双玉, 等. 长江经济带旅游经济的时空分异及影响因素研究[J]. 华中师范大学学报(自然科学版), 2019, 53(5): 735-744
|
| [19] |
马丽君, 张家凤. 长江中游城市群旅游与经济发展空间差异演化及互动关系[J]. 生态经济, 2020, 36(5): 116-121
|
| [20] |
韩润娥, 赵峰. 河西走廊旅游经济空间差异及其演化趋势[J]. 中国农业资源与区划, 2020, 41(4): 225-234
|
| [21] |
朱怡婷, 熊黑钢, 白洋, 等. 边疆旅游地县域旅游经济时空变迁及驱动机制研究——新疆案例[J]. 干旱区地理, 2019, 42(2): 392-403
|
| [22] |
马丽君, 张家凤. 区域旅游发展空间差异变化对经济发展平衡性的影响[J]. 经济地理, 2020, 40(1): 197-203
|
| [23] |
陈晓, 王丹, 张耀光, 等. 辽宁省旅游经济的时空差异演变分析[J]. 经济地理, 2009, 29(1): 147-152
|
| [24] |
方叶林, 黄震方, 陆玮婷, 等. 中国市域旅游经济空间差异及机理研究[J]. 地理与地理信息科学, 2013, 29(6): 100-104+110+129
|
| [25] |
张生瑞, 王英杰, 鞠洪润, 等. 中国陆地边境旅游发展区域差异及其影响因素[J]. 地理研究, 2020, 39(2): 414-429.
|
| [26] |
张昊, 韩增林, 乔国荣, 等. 黄河流域城市间旅游经济联系格局及影响因素研究[J]. 干旱区地理, 2023, 46(8): 1344-1354
|
| [27] |
张蕾. 中国优秀旅游城市体系分析[J]. 城市问题, 2005 (5): 33-37.
|
| [28] |
樊玲玲, 侯志强, 施亚岚, 等. 中国优秀旅游城市旅游效率时空演化及影响因素分析[J]. 资源开发与市场, 2021, 37(8): 984-990.
|
| [29] |
林玉英, 李宝银, 邱荣祖, 等. 基于GWR模型的道路网络对森林碳密度干扰的地理变异——以闽江上游地区为例[J]. 地理科学, 2022, 42(6): 1113-1123
|
| [30] |
卢宾宾, 葛咏, 秦昆, 等. 地理加权回归分析技术综述[J]. 武汉大学学报(信息科学版), 2020, 45(9): 1356-1366
|
| [31] |
|
| [32] |
国家统计局. 中国区域经济统计年鉴[M]. 2008—2014. 北京: 中国统计出版社, 2008—2014.
National Bureau of Statistics. China statistical yearbook for regional economy. 2008—2014. Beijing: China Statistics Press, 2008—2014.
|
| [33] |
邓爱民, 李鹏. 中国旅游经济影响因素分析与实证研究[J]. 宏观经济研究, 2022 (3): 106-115
|
| [34] |
胡森林, 焦世泰, 张晓奇. 中国城市旅游发展的时空演化及影响因素——基于动态空间马尔科夫链模型的分析[J]. 自然资源学报, 2021, 36(4): 854-865.
|
| [35] |
王新越, 芦雪静, 朱文亮. 我国主要旅游城市旅游业发展影响因素分析与评价[J]. 经济地理, 2020, 40(5): 198-209
|
| [36] |
薛明月, 王成新, 赵金丽, 等. 黄河流域旅游经济空间分异格局及影响因素[J]. 经济地理, 2020, 40(4): 19-27
|
| [37] |
邓纯纯, 吴晋峰, 吴珊珊, 等. 中国A级景区等级结构和空间分布特征[J]. 陕西师范大学学报(自然科学版), 2020, 48(1): 70-79
|
| [38] |
|
| [39] |
马晓熠, 裴韬. 基于探索性空间数据分析方法的北京市区域经济差异[J]. 地理科学进展, 2010, 29(12): 1555-1561.
|
| [40] |
李光一, 李海萍, 万华伟, 等. 随机森林算法在新疆物种丰富度影响因素研究中的应用[J]. 中国环境科学, 2021, 41(2): 941-950.
|
/
| 〈 |
|
〉 |