
中国城市群品牌价值500强企业的时空演变及影响因素
|
孙阳(1988—),男,陕西咸阳人,博士后,研究方向为城市发展与区域规划。E-mail: yangsun.chn@hotmail.com |
收稿日期: 2023-01-11
修回日期: 2023-04-23
网络出版日期: 2024-07-11
基金资助
国家自然科学基金项目(41701640)
教育部人文社会科学研究青年基金项目(22YJCZH157)
陕西省软科学研究计划(2023-CX-RKX-177)
陕西省教育厅智库重点项目(21JT026)
陕西省教育厅智库重点项目(21JT023)
版权
Spatial and temporal pattern evolution and influencing factors of the top 500 Chinese value brand companies
Received date: 2023-01-11
Revised date: 2023-04-23
Online published: 2024-07-11
Supported by
National Natural Science Foundation of China(41701640)
Humanities and Social Sciences Research Fund of Ministry of Education(22YJCZH157)
Soft Science Research Program of Shaanxi Province(2023-CX-RKX-177)
Think Tank Key Project of the Education Department of Shaanxi Province(21JT026)
Think Tank Key Project of the Education Department of Shaanxi Province(21JT023)
Copyright
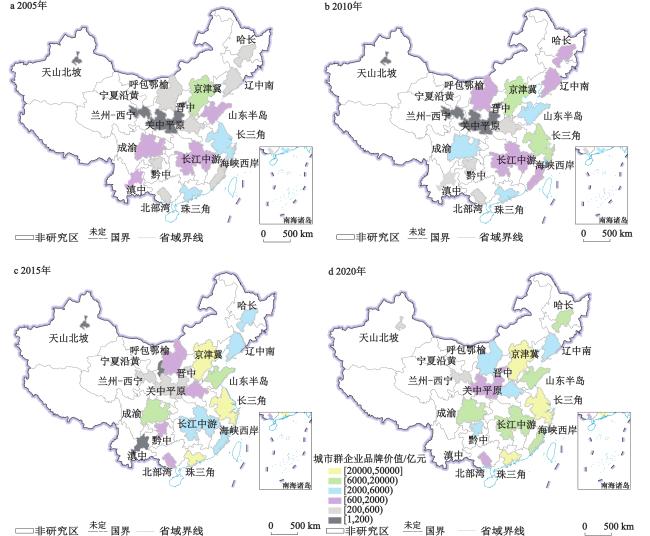
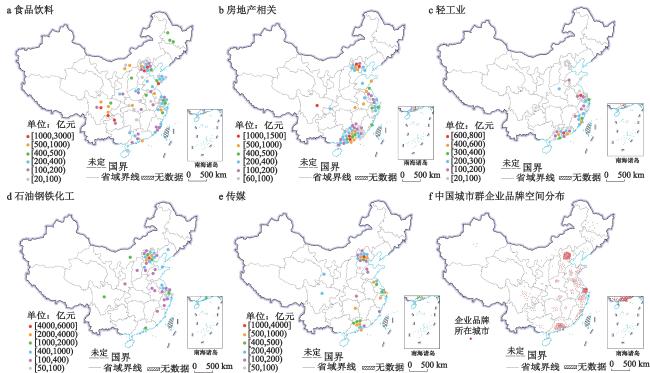
以中国价值品牌500强企业为例,从总体特征、空间分布、区域空间分异3个层面,通过测度空间非均衡性、计量经济建模,定量探究了中国19个城市群企业品牌的时空格局演变及影响因素。研究表明:① 行业结构上,食品饮料、房地产相关、纺织服装、传媒、通讯电子5类品牌结构稳定;数量上,食品饮料占比最高,房地产相关次之,医药最少;价值上,食品饮料占比最高,金融次之,医药最少。② 时空格局演变上,2004—2020年京津冀、粤港澳、长三角企业品牌数量与价值远超其他城市群,山东半岛、成渝等表现较好,辽中南、哈长、海峡西岸等次之,滇中、宁夏沿黄、兰州–西宁等表现整体表现较为薄弱,品牌数量与价值的演变印证了城市群经济发展的企业分布格局,不均衡空间分化相对稳定。③ 区域空间分异上,品牌价值呈自东向西递减态势。东部的地区内差距最大,中部−东北、西部−东北的地区间基尼系数最小,东部和西部的地区间差距最大,空间差距主要来源于超变密度。④ 影响因素上,GMM 估计表明品牌价值存在显著循环累积效应,市场规模、经济水平、市场化程度对品牌发展具正向效应。本文聚焦品牌对城市群经济增长的贡献,可为中国品牌发展的经济地理及相关政策制定提供参考。
孙阳 . 中国城市群品牌价值500强企业的时空演变及影响因素[J]. 地理科学, 2024 , 44(6) : 984 -994 . DOI: 10.13249/j.cnki.sgs.20211219
Taking the top 500 Chinese value brand enterprises as examples, this paper explores quantitatively the spatial and temporal pattern evolution, influencing factors of corporate brands from 3 levels: overall characteristics, spatial distribution, and regional spatial differentiation, using spatial unevenness, econometric modeling, with 19 urban agglomerations as research objects. The study shows that: 1) In terms of industry structure, five categories of brands, namely, food and beverage, real estate related, textile and garment, media, and communication and electronics, have a stable structure; in terms of quantity, food and beverage has the highest share, real estate related the second, and medicine the least; in terms of value, food and beverage has the highest share, finance the second, and medicine the least. 2) In terms of spatial and temporal pattern evolution, from 2004 to 2020, the number and value of enterprise brands in Beijing-Tianjin-Hebei, Guangdong-Hong Kong-Macao, and Yangtze River Delta far exceeded those in other city groups, while Shandong Peninsula and Chengdu-Chongqing performed better, Central and Southern Liaoning, Harbin-Changchun, and West Coast of the Strait were second, and Central Yunnan, Ningxia-along the Huanghe River, and Lanzhou-Xining performed poorly overall. The evolution of brand quantity and value confirms the enterprise distribution pattern of economic development in urban clusters, and the uneven spatial differentiation is relatively stable. 3) In terms of regional spatial differentiation, the brand value shows a decreasing trend from east to west. The intra-regional gap is the largest in the east, the inter-regional Gini coefficient is the smallest in the central-northeast and west-northeast, and the inter-regional gap is the largest in the east and west, and the spatial gap mainly comes from the hypervariable density. 4) In terms of influencing factors, GMM estimation shows a significant cyclic cumulative effect of brand value, with positive effects of market size, economic level, and marketization on brand development. This paper emphasizes the contribution of brands to urban agglomerations and regional economic growth, which brings a positive effect on the long-term development of Chinese brands and can provide reference for economic geospatial analysis and policy formulation.
表1 中国品牌价值500强企业的空间差距及其分解结果Table 1 Spatial gap of the top 500 Chinese brand value companies in the past years and its decomposition results |
| 年份 | 基尼系数 | 区域内基尼系数 | 区域间基尼系数 | |||||||||
| 东部 | 中部 | 西部 | 东北 | 东–中 | 东–西 | 东–东北 | 中–西 | 中–东北 | 西–东北 | |||
| 注:包含香港数据,不包含澳门、台湾数据。 | ||||||||||||
| 2004 | 0.714 | 0.587 | 0.398 | 0.574 | 0.130 | 0.859 | 0.809 | 0.772 | 0.545 | 0.345 | 0.439 | |
| 2005 | 0.729 | 0.592 | 0.412 | 0.629 | 0.406 | 0.837 | 0.829 | 0.791 | 0.564 | 0.462 | 0.555 | |
| 2006 | 0.743 | 0.582 | 0.333 | 0.684 | 0.245 | 0.828 | 0.848 | 0.752 | 0.582 | 0.355 | 0.309 | |
| 2007 | 0.732 | 0.587 | 0.520 | 0.578 | 0.377 | 0.899 | 0.802 | 0.803 | 0.633 | 0.546 | 0.511 | |
| 2008 | 0.739 | 0.654 | 0.368 | 0.654 | 0.318 | 0.819 | 0.833 | 0.790 | 0.559 | 0.362 | 0.544 | |
| 2009 | 0.761 | 0.616 | 0.409 | 0.643 | 0.305 | 0.843 | 0.883 | 0.822 | 0.567 | 0.380 | 0.542 | |
| 2010 | 0.738 | 0.615 | 0.305 | 0.668 | 0.116 | 0.863 | 0.843 | 0.741 | 0.574 | 0.412 | 0.519 | |
| 2011 | 0.745 | 0.622 | 0.337 | 0.655 | 0.136 | 0.874 | 0.848 | 0.750 | 0.576 | 0.442 | 0.517 | |
| 2012 | 0.743 | 0.666 | 0.504 | 0.637 | 0.166 | 0.846 | 0.838 | 0.709 | 0.603 | 0.471 | 0.533 | |
| 2013 | 0.729 | 0.641 | 0.408 | 0.609 | 0.117 | 0.843 | 0.834 | 0.710 | 0.548 | 0.419 | 0.480 | |
| 2014 | 0.731 | 0.649 | 0.427 | 0.617 | 0.114 | 0.842 | 0.836 | 0.703 | 0.558 | 0.430 | 0.488 | |
| 2015 | 0.723 | 0.594 | 0.404 | 0.635 | 0.177 | 0.815 | 0.850 | 0.737 | 0.552 | 0.355 | 0.530 | |
| 2016 | 0.731 | 0.582 | 0.359 | 0.660 | 0.182 | 0.829 | 0.869 | 0.722 | 0.564 | 0.372 | 0.589 | |
| 2017 | 0.731 | 0.578 | 0.341 | 0.668 | 0.231 | 0.821 | 0.871 | 0.739 | 0.566 | 0.359 | 0.595 | |
| 2018 | 0.719 | 0.582 | 0.492 | 0.712 | 0.191 | 0.771 | 0.843 | 0.741 | 0.639 | 0.407 | 0.596 | |
| 2019 | 0.725 | 0.562 | 0.279 | 0.706 | 0.179 | 0.823 | 0.865 | 0.729 | 0.574 | 0.318 | 0.597 | |
| 2020 | 0.706 | 0.545 | 0.510 | 0.673 | 0.169 | 0.770 | 0.845 | 0.721 | 0.623 | 0.439 | 0.563 | |
表2 历年中国品牌价值500强企业的区域差异贡献率Table 2 Regional differences in the contribution rate of the top 500 Chinese brand value enterprises over the years |
| 年份 | 区域间差距 | 超变密度 | 区域内差距 | 贡献率/% | ||
| 区域间差距 | 超变密度 | 区域内差距 | ||||
| 注:包含香港数据,不包含澳门、台湾数据。 | ||||||
| 2004 | 0.485 | 0.046 | 0.182 | 0.679 | 0.064 | 0.255 |
| 2005 | 0.479 | 0.063 | 0.186 | 0.657 | 0.087 | 0.255 |
| 2006 | 0.472 | 0.081 | 0.189 | 0.853 | 0.146 | 0.255 |
| 2007 | 0.498 | 0.047 | 0.186 | 0.680 | 0.064 | 0.255 |
| 2008 | 0.459 | 0.078 | 0.201 | 0.621 | 0.105 | 0.272 |
| 2009 | 0.525 | 0.044 | 0.191 | 0.689 | 0.058 | 0.251 |
| 2010 | 0.499 | 0.047 | 0.191 | 0.676 | 0.064 | 0.258 |
| 2011 | 0.505 | 0.047 | 0.192 | 0.677 | 0.063 | 0.258 |
| 2012 | 0.475 | 0.065 | 0.201 | 0.639 | 0.088 | 0.271 |
| 2013 | 0.482 | 0.052 | 0.193 | 0.662 | 0.072 | 0.265 |
| 2014 | 0.481 | 0.055 | 0.195 | 0.657 | 0.075 | 0.267 |
| 2015 | 0.490 | 0.050 | 0.182 | 0.677 | 0.070 | 0.251 |
| 2016 | 0.510 | 0.042 | 0.178 | 0.697 | 0.058 | 0.244 |
| 2017 | 0.509 | 0.044 | 0.178 | 0.696 | 0.060 | 0.243 |
| 2018 | 0.468 | 0.068 | 0.182 | 0.650 | 0.095 | 0.253 |
| 2019 | 0.504 | 0.046 | 0.174 | 0.695 | 0.063 | 0.240 |
| 2020 | 0.475 | 0.059 | 0.170 | 0.673 | 0.084 | 0.242 |
表3 影响企业品牌数量与品牌价值的主要因素回归分析Table 3 Regression analysis of the main factors affecting the number of corporate brands and brand value |
| 解释变量 | lnBV为被解释变量 | lnBQ为被解释变量 | |||||||||
| OLS | FE | GMM | FGLS | PCSE | OLS | FE | GMM | FGLS | PCSE | ||
| 注:*** 、 ** 、* 分别表示1%、5%和10%的显著性水平,样本数为496,—表示未涉及此项,包含香港数据,不包含澳门、台湾数据。 | |||||||||||
| L.logBQ | 0.950*** | 0.484*** | 0.923*** | 0.399*** | 0.436*** | 0.934*** | 0.344*** | 0.584*** | 0.298*** | 0.291*** | |
| L.logBV | −59.190 | −11.660 | −126.230 | −11.040 | −4.400 | −59.450 | −7.600 | −26.030 | −14.540 | −3.030 | |
| logPOP | 0.067** | −0.535* | 0.201*** | −0.576*** | −0.560* | 0.0248 | −0.128 | 0.401*** | −0.045 | −0.118 | |
| −2.070 | (−1.810) | −6.610 | (−6.070) | (−1.790) | −1.410 | (−0.790) | −7.540 | (−0.880) | (−0.850) | ||
| logAGDP | 0.006 | −0.158 | 0.009*** | −0.152*** | −0.170 | −0.006 | −0.195*** | 0.002** | −0.133*** | −0.196** | |
| −0.800 | (−1.260) | −19.890 | (−5.140) | (−1.200) | (−1.350) | (−2.830) | −2.020 | (−4.410) | (−2.440) | ||
| logRD | −0.0137 | 0.114*** | −0.076*** | 0.126*** | 0.119*** | 0.0105 | 0.006 | 0.022*** | −0.007 | 0.008 | |
| (−0.530) | −3.550 | (−3.490) | −16.140 | −3.480 | −0.680 | −0.350 | −3.360 | (−0.900) | −0.710 | ||
| MI | 0.034*** | 0.019 | 0.088*** | −0.002 | 0.021 | 0.018*** | 0.007 | 0.029*** | 0.005 | 0.006 | |
| −3.180 | −0.990 | −10.750 | (−0.180) | −1.480 | −2.900 | −0.700 | −8.150 | −0.740 | −0.790 | ||
| 常数 | −0.355 | 7.887*** | −1.378*** | 9.659*** | 9.263*** | −0.220* | 4.040*** | −2.805*** | 4.255*** | 5.383*** | |
| (−1.590) | −2.770 | (−6.330) | −10.800 | −2.990 | (−1.660) | −2.620 | (−7.170) | −7.580 | −3.570 | ||
| R2 | 0.962 | 0.881 | — | — | 0.971 | 0.954 | 0.236 | — | — | 0.969 | |
| F | 2516.900 | 90.93 | — | — | — | 2043.440 | 6.860 | — | — | — | |
| 0.000 | 0.000 | — | — | — | 0.000 | 0.000 | — | — | — | ||
| WALD | — | — | 111424.000 | 109015.500 | 49.510 | — | — | 2271.750 | 56745.190 | 186.000 | |
| — | — | 0.000 | 0.000 | 0.000 | — | — | 0.000 | 0.000 | 0.000 | ||
| Hansen-J | — | — | 28.250 | — | — | — | — | 28.310 (0.934) | — | — | |
| — | — | −0.297 | — | — | — | — | — | — | |||
| AR(1) | — | — | −3.200*** | — | — | — | — | −4.060*** | — | — | |
| AR(2) | — | — | 1.080 | — | — | — | — | 1.130 | — | — | |
| [1] |
钱丽芸, 朱竑. 地方性与传承: 宜兴紫砂文化的地理品牌与变迁[J]. 地理科学, 2011, 31(10): 1166-1171
|
| [2] |
钱明辉, 徐志轩. 我国品牌经济发展观察: 兼论构建区域品牌发展指数的必要性[J]. 中华商标, 2018 (10): 15-21
|
| [3] |
安迪·派克. 品牌与品牌地理化[M]. 邓龙安, 译. 北京: 经济管理出版社, 2016.
|
| [4] |
|
| [5] |
|
| [6] |
|
| [7] |
|
| [8] |
|
| [9] |
|
| [10] |
乔莉鸽, 乔家君. 老字号商业网点空间分布与影响因素分析: 以开封市区为例[J]. 地域研究与开发, 2018, 37(5): 72-77
|
| [11] |
马斌斌, 陈兴鹏, 陈芳婷, 等. 中华老字号企业空间分异及影响因素研究[J]. 地理研究, 2020, 39(10): 2313-2329
|
| [12] |
贾垚焱, 胡静, 刘大均, 等. 中华老字号空间分布格局及影响因素研究[J]. 干旱区资源与环境, 2020, 34(3): 85-93
|
| [13] |
刘海兵, 冯文静, 张文礼. 中华老字号文化传统、创新与能力动态分析[J]. 科学学研究, 2019, 37(1): 140-153
|
| [14] |
许晖, 张海军, 冯永春. 传承还是重塑? 本土老字号品牌活化模式与机制研究: 基于品牌真实性与价值迁移视角[J]. 管理世界, 2018, 34(4): 146-161+188
|
| [15] |
徐伟, 杨玉成, 李永发. 老字号品牌创新路径与模式研究[J]. 管理学报, 2020, 17(10): 1535-1543
|
| [16] |
夏曾玉, 谢健. 区域品牌建设探讨: 温州案例研究[J]. 中国工业经济, 2003 (10): 43-48
|
| [17] |
熊爱华. 区域品牌与产业集群互动关系中的磁场效应分析[J]. 管理世界, 2008 (8): 176-177
|
| [18] |
鄢小莉. 关于产业集群与区域经济协调发展机制分析及对策探讨[J]. 经济师, 2021 (4): 144-145
|
| [19] |
李佛关. 我国品牌的地区分布与区域经济实力关联研究[J]. 经济问题探索, 2012 (4): 58-63
|
| [20] |
石忆邵, 蒲晟. 中国品牌的地域差异及品牌创新能力评价[J]. 经济地理, 2009, 29(11): 1855-1860
|
| [21] |
涂山峰, 曹休宁. 基于产业集群的区域品牌与区域经济增长[J]. 中国软科学, 2005 (12): 111-115
|
| [22] |
李艳, 孙阳, 姚士谋. 基于财富中国500强企业的中国城市群城市网络联系分析[J]. 地理研究, 2020, 39(7): 1548-1564
|
| [23] |
谢京辉. 城市群聚集效应的约束条件与破解路径–品牌经济视角的思考[J]. 东岳论丛, 2014, 35(9): 160-164
|
| [24] |
|
| [25] |
沈泽洲, 王承云, 王永正. 中国大陆上市公司研发投入空间格局及动力机制——以500强为例[J]. 经济地理, 2020, 40(11): 131-139.
|
| [26] |
刘夏明, 魏英琪, 李国平. 收敛还是发散?中国区域经济发展争论的文献综述[J]. 经济研究, 2004 (7): 70-81
|
| [27] |
马志飞, 尹上岗, 乔文怡, 等. 中国医疗卫生资源供给水平的空间均衡状态及其时间演变[J]. 地理科学, 2018, 38(6): 869-876
|
| [28] |
吕承超, 邵长花. 中国城市生活垃圾处理能力的时空格局及影响因素[J]. 地理科学, 2021, 41(5): 768-776
|
| [29] |
|
| [30] |
刘华军, 赵浩, 杨骞. 中国品牌经济发展的地区差异与影响因素: 基于Dagum基尼系数分解方法与中国品牌 500 强数据的实证研究[J]. 经济评论, 2012 (3): 57-65
|
| [31] |
蒋海兵, 李业锦. 京津冀地区制造业空间格局演化及其驱动因素[J]. 地理科学进展, 2021, 40(5): 721-735.
|
| [32] |
虞洋, 宋周莺, 史坤博. 基于百度指数的中国省域间信息联系网络格局及其动力机制[J]. 经济地理, 2019, 39(9): 147-155
|
| [33] |
龙飞, 刘家明, 朱鹤, 等. 长三角地区民宿的空间分布及影响因素[J]. 地理研究, 2019, 38(4): 950-960
|
| [34] |
陶锋, 杨文婷, 孙大卫. 地方产业集群、全球生产网络与企业生产率——基于双重网络嵌入视角[J]. 国际经贸探索, 2018, 34(5): 19-34.
|
| [35] |
王分棉, 刘勇. 中国品牌成长的区域性差异及其影响因素研究——基于《中国500最具价值品牌》的实证分析[J]. 中央财经大学学报, 2013 (6): 80-85+90
|
| [36] |
樊纲, 王小鲁, 朱恒鹏. 中国市场化指数——各地区市场化相对进程2011年报告[M]. 北京: 经济科学出版社, 2011.
|
/
| 〈 |
|
〉 |