
互联网使用对中国居民家庭消费结构的影响及其空间异质性
|
王芳(1987—),女,内蒙古呼和浩特人,副教授,硕导,主要研究方向为城市与区域发展。E-mail: wangf741@163.com |
收稿日期: 2023-04-14
修回日期: 2024-03-08
网络出版日期: 2024-08-21
基金资助
国家自然科学基金项目(41801149)
国家自然科学基金项目(42071153)
内蒙古高校自然科学重点项目(NJZZ23095)
版权
The impact of Internet use on household consumption structure and spatial heterogeneity in China
Received date: 2023-04-14
Revised date: 2024-03-08
Online published: 2024-08-21
Supported by
National Natural Science Foundation of China(41801149)
National Natural Science Foundation of China(42071153)
Key Project in Natural Sciences at Inner Mongolia Universities(NJZZ23095)
Copyright
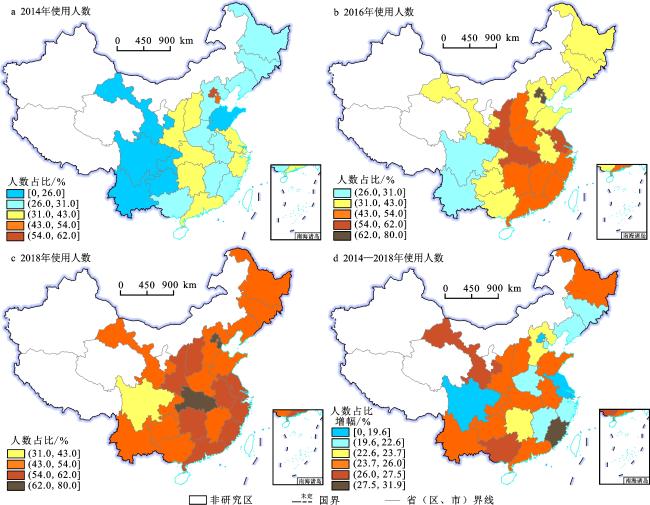
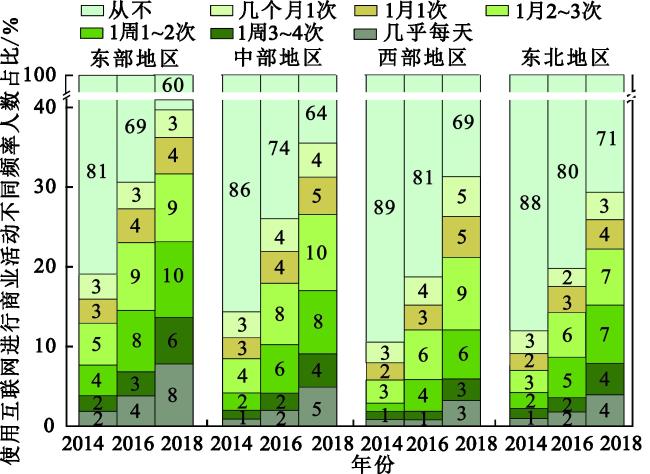
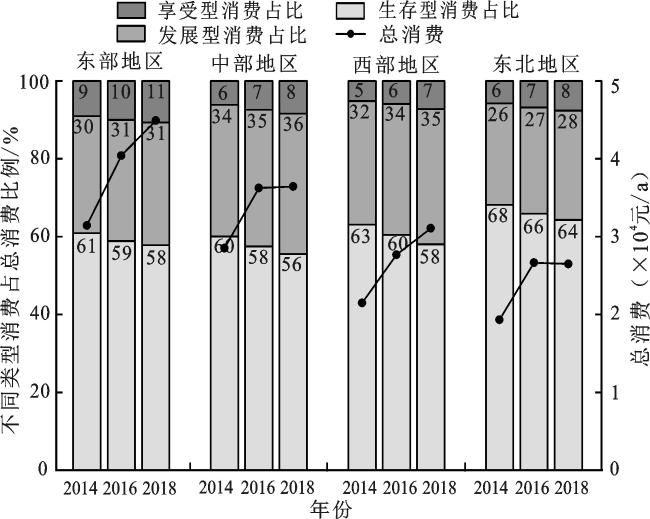
基于中国家庭追踪调查(CFPS)数据,对互联网普及与居民家庭消费水平时空演变进行分析,并检验互联网使用是否会对居民家庭消费水平和结构产生影响,是否促进居民家庭消费升级。发现:① 互联网使用人数、使用互联网进行商业活动的频率以及居民家庭总消费在时序上均显著增长;东部地区享受型消费占比最高,中部地区发展型消费占比最高,东北地区生存型消费占比最高;互联网使用人数和家庭总消费呈现空间集聚特征,且表现出空间扩张和向西南方向移动的趋势。② 互联网使用在促进家庭总消费的同时,也推动家庭消费结构由生存型向发展型和享受型转变。此外,互联网使用对于不同区域、城乡家庭的影响也存在显著差异,在城镇、西部、东北地区家庭消费升级中有更突出的积极作用。
关键词: 互联网使用; 消费升级; 居民家庭消费水平和结构; 空间异质性
王芳 , 侯静怡 , 牛方曲 . 互联网使用对中国居民家庭消费结构的影响及其空间异质性[J]. 地理科学, 2024 , 44(8) : 1344 -1354 . DOI: 10.13249/j.cnki.sgs.20230334
In today’s digital age, the widespread adoption and rapid development of the Internet have profoundly influenced residents’ lifestyles and consumption behaviors.The prosperity and development of online consumption, information consumption and other consumption modes promoted by the Internet have made residents’ consumption more personalized, diversified and quality. It further affects residents’ consumption concepts and preferences. It also changes household consumption expenditure and consumption structure.The Internet has shattered geographical and temporal constraints, enabling global circulation of goods, reducing shopping costs. Consumers, utilizing the Internet, can filter high-quality and cost-effective products, further fueling shopping desires and boosting consumption. Based on the China Family Panel Studies (CFPS), this paper analyzes the spatiotemporal evolution of Internet penetration and residents’ household consumption level. It examines whether Internet usage influences residents’ household consumption level and structure, fostering an upgrade in household consumption. The results show that: 1) The number of Chinese residents using the Internet,the frequency of using the Internet for commercial activities and the total household consumption expenditure of Chinese households show a significant growth trend in time series. The eastern region has the highest proportion of enjoyment-oriented consumption. The central region has the highest proportion of development-oriented consumption. Northeast China has the highest proportion of subsistence consumption. The number of Internet users and total household consumption show the characteristics of spatial agglomeration, and also show the trend of spatial expansion and southwest movement. 2) While promoting total household consumption, Internet usage also promotes the transformation of household consumption structure from survival-oriented to development-oriented and enjoyment-oriented. In addition, there are also significant differences in the impact of Internet usage on different regions. There are more prominent positive effects in household consumption upgrading in urban areas and western and northeastern regions.
表1 互联网使用人数和居民家庭总消费的全局莫兰指数结果Table 1 The Global Moran index result for Internet users and total household consumption among residents |
| 使用人数占总人数比例 | 家庭总消费 | ||||||
| Moran’s I | Z值 | P值 | Moran’s I | Z值 | P值 | ||
| 注:不含青海、西藏、新疆、宁夏、内蒙古、海南、香港、澳门和台湾地区数据。 | |||||||
| 2014年 | 0.322 | 2.870 | 0.004 | 0.316 | 2.691 | 0.007 | |
| 2016年 | 0.275 | 2.439 | 0.014 | 0.206 | 1.893 | 0.058 | |
| 2018年 | 0.297 | 2.660 | 0.008 | 0.230 | 2.082 | 0.037 | |
表2 居民相关变量描述性统计Table 2 Descriptive statistics of resident-related variables |
| 变量 | 均值 | 标准差 | 最小值 | 最大值 |
| 注:不含青海、西藏、新疆、宁夏、内蒙古、海南、香港、澳门和台湾地区数据。 | ||||
| 生存型消费占比 | 0.576 | 0.271 | 0.006 | 1.000 |
| 发展型消费占比 | 0.363 | 0.268 | 0 | 0.989 |
| 享受型消费占比 | 0.060 | 0.093 | 0 | 0.958 |
| 总消费(对数值) | 9.628 | 1.143 | 4.585 | 14.349 |
| 是否使用互联网 | 0.354 | 0.478 | 0 | 1.000 |
| 用互联网进行商业活动的频率 | 1.616 | 1.444 | 1.000 | 7.000 |
| 家庭净资产(对数值) | 12.393 | 1.268 | 0 | 17.748 |
| 家庭人均纯收入(对数值) | 9.327 | 1.043 | 0 | 15.009 |
| 家庭房产数 | 0.222 | 0.514 | 0 | 7.000 |
| 家庭规模 | 4.249 | 1.903 | 1.000 | 21.000 |
| 家庭抚养比 | 0.351 | 0.327 | 0 | 1.000 |
| 年龄 | 47.913 | 12.574 | 18.000 | 85.000 |
| 年龄平方/100 | 24.537 | 12.112 | 3.240 | 72.250 |
| 性别 | 0.532 | 0.499 | 0 | 1.000 |
| 户口 | 0.787 | 0.409 | 0 | 1.000 |
| 健康状况 | 3.003 | 1.211 | 1.000 | 5.000 |
| 受教育水平 | 1.540 | 1.233 | 0 | 4.000 |
| 工作性质 | 0.556 | 0.497 | 0 | 1.000 |
| 婚姻状况 | 0.906 | 0.292 | 0 | 1.000 |
表3 互联网使用情况对家庭消费结构影响的基准回归结果Table 3 Benchmark regression results on the impact of Internet usage on household consumption structure |
| 变量 | (1) | (2) | (3) | (4) |
| 生存型消费占比 | 发展型消费占比 | 享受型消费占比 | 总消费 | |
| 注:***、**、*分别表示在1%,5%,10%水平上显著;括号内数值是聚类到家庭层面的稳健标准误;不含青海、西藏、新疆、宁夏、内蒙古、海南、香港、澳门和台湾地区数据。 | ||||
| 是否使用互联网 | −0.035*** | 0.020*** | 0.014*** | 0.147*** |
| (−6.473) | (3.751) | (7.783) | (7.660) | |
| 使用互联网进行商业活动频率 | −0.006*** | 0.001 | 0.004*** | 0.033*** |
| (−3.877) | (0.992) | (6.589) | (6.026) | |
| 家庭净资产(对数值) | −0.025*** | 0.019*** | 0.006*** | 0.198*** |
| (−9.916) | (7.532) | (7.658) | (18.945) | |
| 家庭人均纯收入(对数值) | −0.011*** | 0.003 | 0.008*** | 0.186*** |
| (−3.766) | (0.913) | (9.131) | (15.355) | |
| 家庭房产数 | 0.007 | −0.012** | 0.004** | 0.060*** |
| (1.520) | (−2.380) | (2.249) | (3.435) | |
| 家庭规模 | −0.016*** | 0.019*** | −0.003*** | 0.139*** |
| (−9.964) | (11.657) | (−7.183) | (20.633) | |
| 家庭抚养比 | 0.045*** | −0.051*** | 0.006** | −0.170*** |
| (5.721) | (−6.522) | (2.093) | (−5.625) | |
| 年龄 | −0.011*** | 0.011*** | 0 | 0.005 |
| (−8.810) | (8.532) | (0.577) | (1.010) | |
| 年龄平方/100 | 0.013*** | −0.013*** | 0 | −0.010** |
| (10.006) | (−10.046) | (0.593) | (−2.196) | |
| 性别 | 0.013*** | −0.007** | −0.007*** | −0.047*** |
| (4.876) | (−2.468) | (−6.825) | (−4.586) | |
| 户口 | −0.005 | 0.023*** | −0.017*** | −0.116*** |
| (−0.832) | (3.539) | (−7.448) | (−5.103) | |
| 健康状况 | −0.008*** | 0.005*** | 0.002*** | −0.056*** |
| (−4.744) | (3.295) | (4.784) | (−9.291) | |
| 受教育水平 | −0.008*** | −0.001 | 0.009*** | 0.047*** |
| (−3.577) | (−0.280) | (12.034) | (5.792) | |
| 工作性质 | 0.007 | −0.004 | −0.003* | −0.134*** |
| (1.255) | (−0.735) | (−1.787) | (−7.059) | |
| 婚姻状况 | −0.021*** | 0.022*** | −0.001 | 0.218*** |
| (−2.855) | (3.049) | (−0.323) | (7.618) | |
| 常数项 | 1.318*** | −0.203*** | −0.115*** | 4.901*** |
| (28.289) | (−4.340) | (−7.424) | (26.488) | |
| 省(区、市)虚拟变量 | Yes | Yes | Yes | Yes |
| 年份虚拟变量 | Yes | Yes | Yes | Yes |
| 观测值 | ||||
| Pseudo R2 /Adj. R2 | 0.109 | 0.082 | 0.164 | 0.308 |
表4 互联网使用对不同区域居民家庭消费影响Table 4 The impact of Internet usage on household consumption among residents in different regions |
| 变量 | 生存型消费占比 | 发展型消费占比 | |||||||
| 东部地区 | 中部地区 | 西部地区 | 东北地区 | 东部地区 | 中部地区 | 西部地区 | 东北地区 | ||
| 注:***、**、*分别表示在1%,5%,10%水平上显著;括号内数值是聚类到家庭层面的稳健标准误;不含青海、西藏、新疆、宁夏、内蒙古、海南、香港、澳门和台湾地区数据。 | |||||||||
| 是否使用互联网 | −0.047*** | −0.014 | −0.052*** | −0.011 | 0.034*** | −0.002 | 0.039*** | −0.007 | |
| (−4.366) | (−1.376) | (−5.353) | (−0.862) | (3.134) | (−0.153) | (4.066) | (−0.570) | ||
| 使用互联网进行商业 活动的频率 | −0.003 | −0.005* | −0.002 | −0.013*** | 0.000 | 0.000 | −0.001 | 0.005 | |
| (−1.336) | (−1.682) | (−0.710) | (−3.557) | (0.187) | (0.158) | (−0.221) | (1.368) | ||
| 常数项 | 1.478*** | 1.269*** | 1.099*** | 1.602*** | −0.317*** | −0.148 | −0.057 | −0.385*** | |
| (17.232) | (13.047) | (13.256) | (14.022) | (−3.767) | (−1.486) | (−0.683) | (−3.373) | ||
| 控制变量 | 控制 | 控制 | 控制 | 控制 | 控制 | 控制 | 控制 | 控制 | |
| 省(区、市)虚拟变量 | Yes | Yes | Yes | Yes | Yes | Yes | Yes | Yes | |
| 年份虚拟变量 | Yes | Yes | Yes | Yes | Yes | Yes | Yes | Yes | |
| 观测值 | |||||||||
| 变量 | 享受型消费占比 | 总消费 | |||||||
| 东部地区 | 中部地区 | 西部地区 | 东北地区 | 东部地区 | 中部地区 | 西部地区 | 东北地区 | ||
| 是否使用互联网 | 0.013*** | 0.016*** | 0.013*** | 0.018*** | 0.173*** | 0.069* | 0.186*** | 0.152*** | |
| (3.364) | (4.414) | (4.299) | (3.794) | (4.566) | (1.847) | (5.193) | (3.582) | ||
| 使用互联网进行商业 活动的频率 | 0.003*** | 0.004*** | 0.003** | 0.008*** | 0.030*** | 0.033*** | 0.025** | 0.045*** | |
| (2.773) | (3.000) | (2.544) | (4.884) | (3.104) | (3.242) | (2.231) | (3.335) | ||
| 常数项 | −0.161*** | −0.121*** | −0.042* | −0.217*** | 3.820*** | 4.954*** | 5.876*** | 4.380*** | |
| (−4.702) | (−3.989) | (−1.692) | (−5.513) | (11.235) | (12.881) | (17.462) | (10.072) | ||
| 控制变量 | 控制 | 控制 | 控制 | 控制 | 控制 | 控制 | 控制 | 控制 | |
| 省(区、市)虚拟变量 | Yes | Yes | Yes | Yes | Yes | Yes | Yes | Yes | |
| 年份虚拟变量 | Yes | Yes | Yes | Yes | Yes | Yes | Yes | Yes | |
| 观测值 | |||||||||
表5 互联网使用对城乡居民家庭消费影响Table 5 The impact of Internet usage on urban and rural residents’ households consumption |
| 变量 | 生存型消费占比 | 发展型消费占比 | 享受型消费占比 | 总消费 | |||||||
| 城镇 | 乡村 | 城镇 | 乡村 | 城镇 | 乡村 | 城镇 | 乡村 | ||||
| 注:***、**分别表示在1%,5%水平上显著;括号内数值是聚类到家庭层面的稳健标准误;不含青海、西藏、新疆、宁夏、内蒙古、海南、香港、澳门和台湾地区数据。 | |||||||||||
| 是否使用互联网 | −0.037*** | −0.032*** | 0.019** | 0.021*** | 0.017*** | 0.011*** | 0.163*** | 0.131*** | |||
| (−5.368) | (−4.898) | (2.429) | (2.885) | (5.520) | (5.399) | (5.697) | (5.005) | ||||
| 使用互联网进行商业 活动的频率 | −0.008*** | 0 | 0.005** | −0.003 | 0.004*** | 0.002*** | 0.038*** | 0.015 | |||
| (−4.776) | (0.142) | (2.560) | (−1.067) | (4.123) | (3.084) | (5.559) | (1.605) | ||||
| 常数项 | 1.442*** | 1.234*** | −0.221*** | −0.183*** | −0.220*** | −0.051*** | 3.778*** | 5.614*** | |||
| (27.322) | (26.472) | (−3.146) | (−2.875) | (−7.630) | (−3.013) | (13.226) | (22.526) | ||||
| 控制变量 | 控制 | 控制 | 控制 | 控制 | 控制 | 控制 | 控制 | 控制 | |||
| 省(区、市)虚拟变量 | Yes | Yes | Yes | Yes | Yes | Yes | Yes | Yes | |||
| 年份虚拟变量 | Yes | Yes | Yes | Yes | Yes | Yes | Yes | Yes | |||
| 观测值 | |||||||||||
| [1] |
Aldo A L, Andreas B, Martin L. Exploring the associations between E-shopping and the share of shopping trip frequency and travelled time over total daily travel demand[J]. Travel Behaviour and Society, 2023, 31: 202-208.
|
| [2] |
何凌华. 互联网环境下城市公共空间的重构与设计[J]. 城市规划, 2016, 40(9): 97-104.
He Linghua. Restructuring and design of urban public space under Internet environment. City Planning Review, 2016, 40(9): 97-104.
|
| [3] |
陈建, 邹红, 张俊英. 数字经济对中国居民消费升级时空格局的影响[J]. 经济地理, 2022, 42(9): 129-137.
Chen Jian, Zou Hong, Zhang Junying. The impact of digital economy on the spatial-temporal pattern of residents’ consumption upgrading in China. Economic Geography, 2022, 42(9): 129-137.
|
| [4] |
凯恩斯. 就业、利息与货币通论[M]. 徐毓枬, 译. 南京: 译林出版社, 1999: 11-15
Keynes. The general theory of employment, interest, and money. Translated by Xu Yuzhān. Nanjing: Yilin Press, 1999: 11-15.
|
| [5] |
曾洁华, 钟若愚. 互联网推动了居民消费升级吗——基于广东省城市消费搜索指数的研究[J]. 经济学家, 2021(8): 31-41.
Zeng Jiehua, Zhong Ruoyu. Does Internet contribute to the consumption upgrading of residents?—Research based on city consumption search index in Guangdong Province. Economist, 2021(8): 31-41.
|
| [6] |
依绍华. 中国居民消费结构升级研究[M]. 北京: 中国社会科学出版社, 2019: 51-52
Yi Shaohua. Research on the upgrading of consumption structure of Chinese residents. Beijing: China Social Sciences Press, 2019: 51-52.
|
| [7] |
李旭洋, 李通屏, 邹伟进. 互联网推动居民家庭消费升级了吗?——基于中国微观调查数据的研究[J]. 中国地质大学学报(社会科学版), 2019, 19(4): 145-160.
Liu Xuyang, Li Tongping, Zou weijin. Has the Internet promoted the upgrading of household consumption?—Research based on the micro survey data of China. Journal of China University of Geosciences (Social Sciences Edition), 2019, 19(4): 145-160.
|
| [8] |
Alboghdady M A, Alashry M K. The demand for meat in Egypt: An almost ideal estimation[J]. African Journal of Agriculture and Resource Economics, 2010, 4(1): 70-81.
|
| [9] |
Deaton A, Muellbauer J. An almost ideal demand system[J]. The American Economic Review, 1980, 70(3): 312-326.
|
| [10] |
Anderson W P, Chatterjee L, Lakshmanan T R. E-commerce, Transportation, and Economic Geography[J]. Growth and Change, 2003, 34(4): 415-432.
|
| [11] |
Farag S, Weltevreden J, Van Rietbergen T et al. E-shopping in the Netherlands: Does geography matter?[J]. Environment and Planning B, 2006, 33(1): 59-74.
|
| [12] |
Kirby-Hawkins E, Birkin M, Clarke G. An investigation into the geography of corporate E-commerce sales in the UK grocery market[J]. Environment and Planning B: Urban Analytics and City Science, 2019, 46(6): 1148-1164.
|
| [13] |
Mokhtarian P L. Telecommunications and travel: The case for complementarity[J]. Journal of Industrial Ecology, 2002, 6(2): 43-57.
|
| [14] |
Cao X Y. The relationships between E-shopping and store shopping in the shopping process of search goods[J]. Transportation Research Part A, 2012, 46(7): 993-1002.
|
| [15] |
Suel E, Daina N, Polak J W. A hazard-based approach to modelling the effects of online shopping on intershopping duration[J]. Transportation, 2018, 45(2): 415-428.
|
| [16] |
龚亚男, 魏宗财, 刘玉亭. 广州市保障房住区居民网购行为特征及其影响因素[J]. 经济地理, 2021, 41(4): 74-81.
Gong Ya’nan, Wei Zongcai, Liu Yuting. Online consumption behavior characteristics of the affordable housing residents and their influencing factors in Guangzhou. Economic Geography, 2021, 41(4): 74-81.
|
| [17] |
王芳, 郭梦瑶, 牛方曲. 新消费时代西部城市居民消费行为特征——以呼和浩特市为例[J]. 地域研究与开发, 2022, 41(2): 63-69.
Wang Fang, Guo Mengyao, Niu Fangqu. Research on consumption behavior characteristics of western urban residents in the new consumption era: Taking Hohhot City as an example. Areal Research and Development, 2022, 41(2): 63-69.
|
| [18] |
O’Brien Richard. Global financial integration: The end of Geography[M]. London: Royal Institute of International Affairs, 1992: 55-56.
|
| [19] |
王欢, 王芳, 郭梦瑶. 居民购物出行时空特征及影响因素研究——基于中国时间利用调查[J]. 地理研究, 2022, 41(10): 2712-2725.
Wang Huan, Wang Fang, Guo Mengyao. Spatiotemporal characteristics and determinants of residents’ shopping travel behaviors in China: Based on Chinese time use survey. Geographical Research, 2022, 41(10): 2712-2725.
|
| [20] |
H·巴凯斯, 路紫. 从地理空间到地理网络空间的变化趋势——兼论西方学者关于电信对地区影响的研究[J]. 地理学报, 2000, 55(1): 104-111.
Henry Bakis, Lu Zi. The change from the geographical space to geocyberspace—Review on the western scholars on regional effects by telecommunication. Acta Geographic Sinica, 2000, 55(1): 104-111.
|
| [21] |
魏满意, 董欢喜. 大变革: 互联网重构商业模式[M]. 北京: 清华大学出版社, 2016: 243-244
Wei Manyi, Dong Huanxi. Great change: The Internet reimagines business models. Beijing: Tsinghua University Press, 2016: 243-244.
|
| [22] |
刁永祚. 消费结构与生活质量[M]. 北京: 首都师范大学出版社, 2012: 118-121
Diao Yongzuo. Consumption structure and quality of life. Beijing: Capital Normal University Press, 2012: 118-121.
|
| [23] |
Wang W. Research on consumption upgrading and retail innovation development based on mobile internet technology[J]. Journal of Physics: Conference Series, 2019, 1176(4): 1-6.
|
| [24] |
张岳, 彭世广. 移动支付影响家庭消费行为作用机理与实证分析[J]. 商业研究, 2020(5): 105-111.
Zhang Yue, Peng Shiguang. The mechanism and empirical analysis of mobile payment’s influence on household consumption behavior. Commercial Research, 2020(5): 105-111.
|
| [25] |
黎翠梅, 周莹. 数字普惠金融对农村消费的影响研究——基于空间计量模型[J]. 经济地理, 2021, 41(12): 177-186.
Li Cuimei, Zhou Ying. Influence of digital inclusive finance on rural consumption: Based on spatial econometric mode. Economic Geography, 2021, 41(12): 177-186.
|
| [26] |
刘建国, 苏文杰. “银色数字鸿沟”对老年人身心健康的影响——基于三期中国家庭追踪调查数据(CFPS)[J]. 人口学刊, 2022, 44(6): 53-68.
Liu Jianguo, Su Wenjie. Impacts of the silver digital divide on physical and mental health of the elderly population: Based on data from three-year China family panel studies (CFPS). Population Journal, 2022, 44(6): 53-68.
|
| [27] |
司传宁, 李亚红, 孙乐. 数字金融能力、收入多样化与家庭消费升级[J]. 消费经济, 2022, 38(6): 70-80.
Si Chuanning, Li Yahong, Sun Le. Digital financial capabilities, income diversification and household consumption upgrading. Consumer Economics, 2022, 38(6): 70-80.
|
| [28] |
徐佳, 韦欣. 中国城镇创业与非创业家庭消费差异分析——基于微观调查数据的实证[J]. 数量经济技术经济研究, 2021, 38(1): 43-60.
Xu Jia, Wei Xin. Consumption gap of Chinese urban entrepreneurial and non-entrepreneurial families: Evidence from CFPS. Journal of Quantitative & Technological Economics, 2021, 38(1): 43-60.
|
| [29] |
赵璐, 赵作权. 基于特征椭圆的中国经济空间分异研究[J]. 地理科学, 2014, 34(8): 979-986.
Zhao lu, Zhao Zuoquan. Projecting the spatial variartion of ecnomic based on the specific ellipses in China. Scientia Geographica Sinica, 2014, 34(8): 979-986.
|
| [30] |
白冰, 赵作权, 张佩. 中国南北区域经济空间融合发展的趋势与布局[J]. 经济地理, 2021, 41(2): 1-10.
Bai Bing, Zhao Zuoquan, Zhang Pei. Trends and layout of economic integration between north and south China. Economic Geography, 2021, 41(2): 1-10.
|
/
| 〈 |
|
〉 |