
区域传输对山东半岛大气粗颗粒物污染的影响——基于轨迹模型的定量测度
|
童菲(2001—),女,安徽池州人,硕士研究生,主要从事环境地理学研究。E-mail: tfei@ahnu.edu.cn |
收稿日期: 2024-07-10
修回日期: 2024-12-22
网络出版日期: 2025-06-24
基金资助
安徽省高校自然科学重点项目(2022AH050181)
国家自然科学基金项目(41977402)
国家级大学生创新创业项目(202310370043)
版权
Impact of regional transport on coarse particulate matter in the Shandong Peninsula: Quantitative measurements based on trajectory modeling
Received date: 2024-07-10
Revised date: 2024-12-22
Online published: 2025-06-24
Supported by
Key Projects of Natural Science in Universities of Anhui Province(2022AH050181)
National Natural Science Foundation of China(41977402)
National College Students’ Innovation and Entrepreneurship Training Program(202310370043)
Copyright
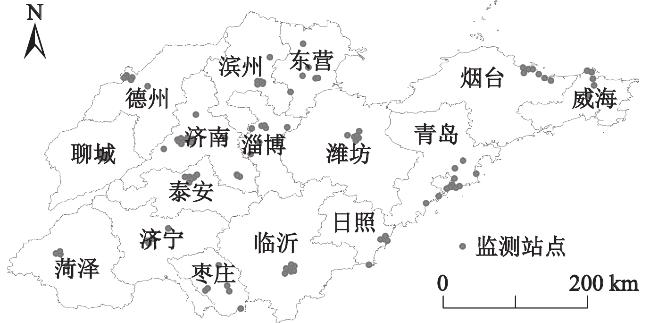
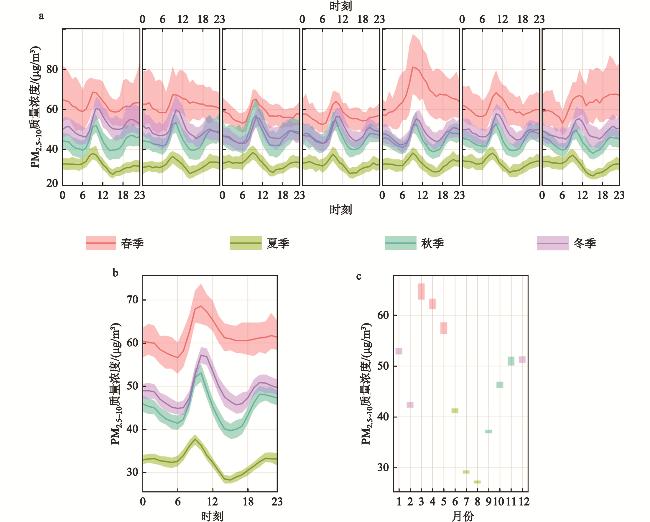
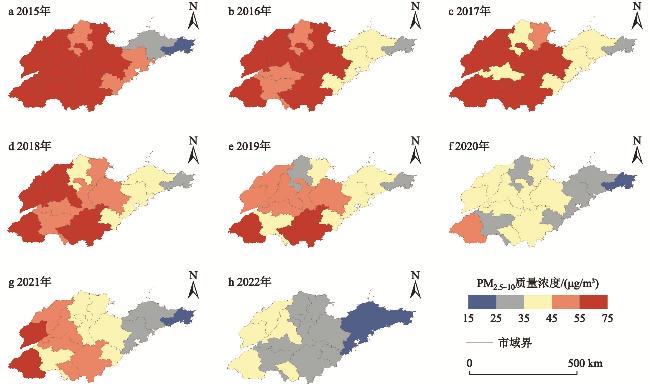
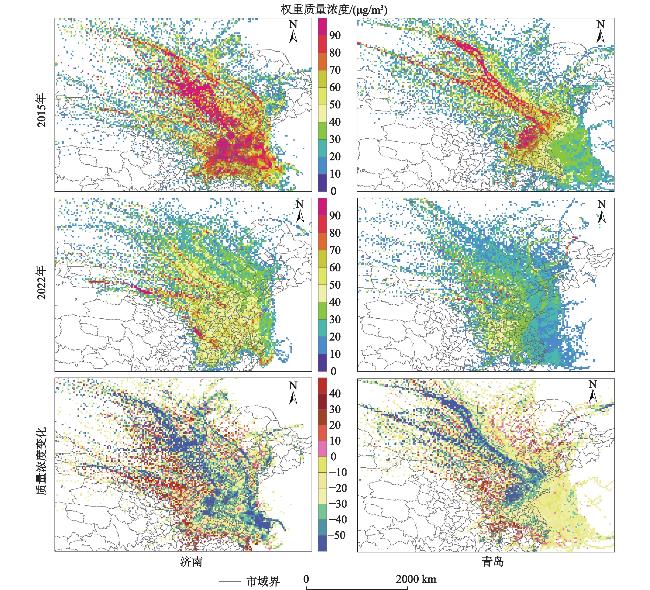
精准评估区域传输对大气粗颗粒物(PM2.5~10)质量浓度的影响对于联防联控至关重要。本研究以山东半岛为研究案例地,基于2015—2022年逐时质量浓度监测数据,采用后向轨迹和浓度权重轨迹模型(Concentration Weighted Trajectory, CWT)定量测度区域传输对大气PM2.5~10污染影响的变化趋势和空间差异。结果表明,①2015—2022年山东半岛大气PM2.5~10年均质量浓度由(58.06±15.36) μg/m3显著下降至(33.27±6.96) μg/m3(Z<0, P<0.001),但PM2.5~10质量浓度占PM10质量浓度的比例由43.17%增长至46.27%,重污染时期集中分布在3—4月。②空间上,山东半岛大气PM2.5~10质量浓度整体呈西部内陆向东部沿海递减的空间变化趋势,德州、济南、聊城等地污染程度高。③山东半岛春季、秋季和冬季的气流轨迹主要受西北境外远距离传输的影响,而夏季主要以近距离传输为主。西北远距离输送气团的占比逐渐增大,而东南海洋大气输送气团的占比逐渐减少。④CWT分析显示,潜在源区如内蒙古、河北、河南等地对山东半岛大气PM2.5~10输送的质量浓度由28.47 μg/m3降低至9.00 μg/m3,开封、衡水、濮阳等地输送的质量浓度降低较多,而长沙、湘潭、天门等地需要加强管制。研究结果定量评估了区域传输对山东半岛大气PM2.5~10污染的贡献,为未来大气PM2.5~10污染联防联控提供决策参考。
关键词: 大气粗颗粒物(PM2.5~10); 区域传输; 定量测度; 山东半岛
童菲 , 方凤满 , 马康 , 李静文 , 林跃胜 , 方正 . 区域传输对山东半岛大气粗颗粒物污染的影响——基于轨迹模型的定量测度[J]. 地理科学, 2025 , 45(6) : 1381 -1391 . DOI: 10.13249/j.cnki.sgs.20240869
Accurate assessment the impact of regional transport on atmospheric concentrations of coarse particulate matter (PM2.5-10) is essential for effective joint prevention and control measures. In this study, the Shandong Peninsula serves as the case study site. Utilizing hourly concentration monitoring data from 2015 to 2022, we employed backward trajectory assessments, and concentration-weighted trajectory (CWT) model to quantitatively evaluate trends and spatial variations in the impacts of regional transport on atmospheric PM2.5-10 pollution. The results indicate that: 1) The annual mean atmospheric PM2.5-10 concentration in the Shandong Peninsula significantly decreased from (58.06±15.36) μg/m3 in 2015 to (33.27±6.96) μg/m3 in 2022 (Z<0, P<0.001). However, the proportion of PM2.5-10 concentration relative to PM10 concentration increased from 43.17% to 46.27%, with the period of heavy pollution primarily occurring from March to April. 2) Spatially, the overall trend of atmospheric PM2.5-10 concentration in the Shandong Peninsula exhibited a decline from the western inland areas to the eastern coast, with Dezhou, Jinan, Liaocheng identified as highly polluted areas. 3) The airflow trajectories affecting the Shandong Peninsula in spring, autumn and winter are primarily influenced by long-range transport from the northwest, while summer is predominantly characterized by close-range transport. The proportion of air masses transported over long distances from the northwest is gradually increasing, while the proportion of air masses transported from the southeastern ocean is gradually decreasing. 4) CWT analysis reveals that the concentration of atmospheric PM2.5-10 transported from regions such as China’s Inner Mongolia, Hebei and Henan decreased from 28.47 μg/m3 to 9.00 μg/m3. Notably, the reductions are more pronounced for transport from Kaifeng, Hengshui, and Puyang, while regions such as Changsha, Xiangtan and Tianmen require enhanced control measures. This study quantitatively assesses the contribution of regional transport to atmospheric PM2.5-10 pollution in the Shandong Peninsula and provided a valuable reference for future joint prevention and control strategies strategies atmospheric PM2.5-10 pollution.
表1 2015—2022年山东半岛大气PM2.5~10质量浓度及占PM10的比例Table 1 PM2.5-10 concentration and changes in its proportion to PM10in Shandong Peninsula from 2015 to 2022 |
| 年份 | 站点数/个 | 最小值/(μg/m3) | 最大值/(μg/m3) | 平均值/(μg/m3) | 标准差/(μg/m3) | PM2.5~10占比/% |
| 2015 | 76 | 24.17 | 96.32 | 58.06 | 15.36 | 43.17 |
| 2016 | 72 | 22.95 | 83.92 | 54.22 | 14.52 | 45.22 |
| 2017 | 81 | 21.69 | 86.61 | 53.15 | 14.00 | 47.89 |
| 2018 | 77 | 23.92 | 78.74 | 50.56 | 11.26 | 50.41 |
| 2019 | 78 | 26.72 | 77.85 | 47.63 | 9.80 | 46.95 |
| 2020 | 82 | 20.40 | 55.72 | 37.96 | 8.63 | 44.11 |
| 2021 | 110 | 11.00 | 67.15 | 44.81 | 10.31 | 51.28 |
| 2022 | 106 | 16.87 | 49.49 | 33.27 | 6.96 | 46.27 |
表2 2015—2022年中国内陆主要潜在源区对山东半岛大气PM2.5~10质量浓度的贡献值/(μg/m3)Table 2 Contribution of major potential source areas in inland China on PM2.5~10 pollution in Shandong Peninsula from 2015 to 2022/(μg/m3) |
| 潜在源区 | 贡献值 | 潜在源区 | 贡献值 | |||
| 济南 | 开封市 | -68.10 | 青岛 | 衡水市 | -50.88 | |
| 濮阳市 | -55.12 | 濮阳市 | -50.13 | |||
| 邯郸市 | -55.00 | 邯郸市 | -37.93 | |||
| 衡水市 | -36.94 | 开封市 | -27.62 | |||
| 西安市 | 22.52 | 池州市 | 13.40 | |||
| 池州市 | 24.02 | 鄂州市 | 15.04 | |||
| 张家界市 | 28.28 | 商洛市 | 17.54 | |||
| 湘潭市 | 39.89 | 安庆市 | 18.66 | |||
| 长沙市 | 48.04 | 天门市 | 26.03 |
| [1] |
Shao Y P, Wyrwoll K H, Chappell A et al. Dust cycle: An emerging core theme in earth system science. Aeolian Research, 2011, 2(4):181-204.
|
| [2] |
Brunekreef B, Forsberg B. Epidemiological evidence of effects of coarse airborne particles on health. European Respiratory Journal, 2005, 26(2):309-318.
|
| [3] |
Adar S D, Filigrana P A, Clements N et al. Ambient coarse particulate matter and human health: A systematic review and meta-analysis. Current Environmental Health Reports, 2014, 1(3):258-274.
|
| [4] |
Keet C A, Keller J P, Peng R D. Long-term coarse particulate matter exposure is associated with asthma among children in Medicaid. American Journal of Respiratory and Critical Care Medicine, 2018, 197(6):737-746.
|
| [5] |
Wong Y K, Liu K M, Yeung C et al. Measurement report: Characterization and source apportionment of coarse particulate matter in Hong Kong: Insights into the constituents of unidentified mass and source origins in a coastal city in southern China. Atmospheric Chemistry and Physics, 2022, 22(7):5017-5031.
|
| [6] |
Hand J L, Gill T E, Schichtel B A. Urban and rural coarse aerosol mass across the United States: Spatial and seasonal variability and long-term trends. Atmospheric Environment, 2019, 218:117025
|
| [7] |
Liu C, Cai J, Chen R et al. Coarse particulate air pollution and daily mortality: A global study in 205 cities. American Journal of Respiratory and Critical Care Medicine, 2022, 206(8):999-1007.
|
| [8] |
Lei J, Yang T, Huang S J. Hourly concentrations of fine and coarse particulate matter and dynamic pulmonary function measurements among 4992 adult asthmatic patients in 25 Chinese cities. Environment International, 2022, 158:106942
|
| [9] |
Daellenbach K R, Uzu G, Jiang J et al. Sources of particulate-matter air pollution and its oxidative potential in Europe. Nature, 2020, 587:414-419.
|
| [10] |
Masri S, Kang C M, Koutrakis P. Composition and sources of fine and coarse particles collected during 2002—2010 in Boston, MA. Journal of the Air & Waste Management Association, 2015, 65(3):287-297.
|
| [11] |
Wan S, Cui K, Wang Y F et al. Impact of the COVID-19 event on trip intensity and air quality in southern China. Aerosol and Air Quality Research, 2020, 20(8):1727-1747.
|
| [12] |
唐兆康, 吴峡生, 高嵩, 等. 南京冬季一次重霾污染事件PM2.5区域传输收支分析[J]. 环境科学学报, 2018, 38(12):4605-4611.
Tang Zhaokang, Wu Xiasheng, Gao Song et al. Analysis on PM2.5 regional transport and budget of a winter heavy haze pollution event in Nanjing. Acta Scientiae Circumstantiae, 2018, 38(12):4605-4611.
|
| [13] |
潘勇, 郑捷, 肖航. 长三角地区典型PM2.5污染过程和跨区域传输对宁波污染贡献评估模拟[J]. 环境科学, 2023, 44(2):634-645.
Pan Yong, Zheng Jie, Xiao Hang. Simulation evaluation of the contribution of typical PM2.5 pollution and transregional transport to Ningbo pollution in the Yangtze River Delta. Environmental Science, 2023, 44(2):634-645.
|
| [14] |
李静文, 方凤满, 马康, 等. 中国东部地区粗颗粒物长期暴露特征及人群健康负担评估[J]. 环境科学学报, 2024, 44(5):339-350.
Li Jingwen, Fang Fengman, Ma Kang et al. Characteristics of long-term exposure to coarse particulate matter and assessment of population health burden in eastern China. Acta Scientiae Circumstantiae, 2024, 44(5):339-350.
|
| [15] |
李乐, 刘旻霞, 肖仕锐, 等. 山东半岛近地面O3浓度时空变化及潜在源区解析[J]. 环境科学, 2022, 43(3):1256-1267.
Li Le, Liu Minxia, Xiao Shirui et al. Temporal and spatial variation in O3 concentration near the surface of Shandong Peninsula and analysis of potential source areas. Environmental Science, 2022, 43(3):1256-1267.
|
| [16] |
周睿智, 闫才青, 崔敏, 等. 山东省大气细颗粒物来源解析的研究现状与展望[J]. 中国环境科学, 2021, 41(7):3029-3042.
Zhou Ruizhi, Yan Caiqing, Cui Min et al. Research status and prospects on source apportionment of atmospheric fine particulate matter in Shandong Province. China Environmental Science, 2021, 41(7):3029-3042.
|
| [17] |
王富喜. 山东半岛城市群人口-土地城镇化质量测度与协调发展研究[J]. 地理科学, 2020, 40(8):1345-1354.
Wang Fuxi. Study on the quality measurement and coordinated development of population-land urbanization in Shandong Peninsula Urban Agglomeration. Scientia Geographica Sinica, 2020, 40(8):1345-1354.
|
| [18] |
杜杨. 制造业居首位“自主创新”增长快[N]. 经济导报, 2024-01-12(005
Du Yang. Manufacturing tops the list with fast growth in “independent innovation”. Economic Herald, 2024-01-12(005).
|
| [19] |
Draxler R R, Hess G D. An overview of the hysplit-4 modeling system for trajectories, dispersion, and deposition. Australian Meteorological Magazine, 1998, 47(4):295-308.
|
| [20] |
Hsu Y K, Holsen T M, Hopke P K. Comparison of hybrid receptor models to locate PCB sources in Chicago. Atmospheric Environment, 2003, 37(4):545-562.
|
| [21] |
山东省生态环境厅. 山东发布2023年生态环境状况公报[R/OL]. http://sthj.shandong.gov.cn/dtxx/hbyw/202406/t20240606_4734901.htmlW, 2024
Shandong Provincial Department of Ecology and Environment. Shandong releases bulletin on ecological and environmental conditions in 2023. http://sthj.shandong.gov.cn/dtxx/hbyw/202406/t20240606_4734901.htmlW, 2024.
|
| [22] |
蒋星星, 陈庆彩, 熊梦琪, 等. 疫情管控对关中城市群大气污染特征及颗粒物化学组成的影响[J]. 环境化学, 2023, 42(8):2640-2650.
Jiang Xingxing, Chen Qingcai, Xiong Mengqi et al. Influence of epidemic control on air pollution characteristics and chemical composition of particulate matter in Guanzhong urban agglomeration. Environmental Chemistry, 2023, 42(8):2640-2650.
|
| [23] |
冯海英. 疫情防控措施对乌鲁木齐市大气颗粒物浓度及分布影响分析[J]. 环境污染与防治, 2021, 43(5):606-610.
Feng Haiying. Impact of epidemic prevention and control measures on atmospheric particulate concentration and distribution in Urumqi. Environmental Pollution and Control, 2021, 43(5):606-610.
|
| [24] |
刘志丽, 马建文, 李启青, 等. 沙尘暴过程地面测量与卫星同步观测实验及数据分析——以2002年沙尘暴事件为例[J]. 地理科学, 2003, 23(5):571-578.
Liu Zhili, Ma Jianwen, Li Qiqing et al. In situ measurement and satellite observation experiment and data analysis in the course of dust storm. Scientia Geographica Sinica, 2003, 23(5):571-578.
|
| [25] |
Li X Y, Song H Q, Zhai S Y et al. Particulate matter pollution in Chinese cities: Areal-temporal variations and their relationships with meteorological conditions (2015—2017). Environmental Sciences, 2019, 246:11-18.
|
| [26] |
Feng X Y and Wang S G. Influence of different weather events on concentrations of particulate matter with different sizes in Lanzhou, China. Journal of Environmental Sciences, 2012, 24(4):665-674.
|
| [27] |
Louie P K K, Watson J G, Chow J C et al. Seasonal characteristics and regional transport of PM2.5 in Hong Kong. Atmospheric Environment, 2004, 39(9):1695-1710.
|
| [28] |
Yu J Z, Tung J W T, Wu A W M et al. Abundance and seasonal characteristics of elemental and organic carbon in Hong Kong PM10. Atmospheric Environment, 2004, 38(10):1511-1521.
|
| [29] |
韩燕, 徐虹, 毕晓辉, 等. 降水对颗粒物的冲刷作用及其对雨水化学的影响[J]. 中国环境科学, 2013, 33(2):193-200.
Han Yan, Xu Hong, Bi Xiaohui et al. Changes of particulate matters during rain process and influence of that on chemical composition of precipitation in Hangzhou, China. China Environmental Science, 2013, 33(2):193-200.
|
| [30] |
吴俊林, 齐实, 申云康, 等. 2种城市林带PM1质量浓度变化及其与气象因子的关系[J]. 水土保持学报, 2015, 29(4):104-109.
Wu Junlin, Qi Shi, Shen Yunkang et al. PM1 mass concentration of urban conifer and broadleaf forest and their correlation with meteorological factors. Journal of Soil and Water Conservation, 2015, 29(4):104-109.
|
| [31] |
Zhang X Y, Arimoto R, An Z S. Glacial and interglacial patterns for Asian dust transport. Quaternary Science Reviews, 1999, 18(6):811-819.
|
| [32] |
Kang D J and Wang H J. Analysis on the decadal scale variation of the dust storm in North China. Science in China Series D: Earth Sciences, 2005, 48(12):2260-2666.
|
| [33] |
Huang X X, Wang T J, Jiang F et al. Studies on a severe dust storm in east Asia and its impact on the air quality of Nanjing, China. Aerosol and Air Quality Research, 2013, 13(1):179-193.
|
| [34] |
Meng L, Yang X, Zhao T et al. Modeling study on three-dimensional distribution of dust aerosols during a dust storm over the Tarim Basin, Northwest China. Atmospheric Research, 2019, 218:285-295.
|
| [35] |
林禹彤. 未来的沙尘暴, 减弱还是更强[J]. 生命与灾害, 2024(4):28-29.
Lin Yutong. Future sandstorms: Weaker or stronger. Life & Disaster, 2024(4):28-29.
|
| [36] |
赵宗慈, 罗勇, 黄建斌. 全球变暖与沙尘暴[J]. 气候变化研究进展, 2023, 19(5):667-671.
Zhao Zongci, Luo Yong, Huang Jianbin. Global warming and sand-dust storms. Climate Change Research, 2023, 19(5):667-671.
|
| [37] |
Zhang P, Jeong J H, Yoon J H et al. Abrupt shift to hotter and drier climate over inner East Asia beyond the tipping point. Science, 2020, 370(6520):1095-1099.
|
| [38] |
Lagudu U R K, Raja S, Hopke P K et al. Heterogeneity of coarse particles in an urban area. West Environmental Science & Technology, 2011, 45(8):3288-3296.
|
| [39] |
Kumar P, Hopke P K, Raja S et al. Characterization and heterogeneity of coarse particles across an urban area. Atmospheric Environment, 2012, 46:449-459.
|
| [40] |
黄小刚, 赵景波, 曹军骥, 等. 中国城市O3浓度时空变化特征及驱动因素[J]. 环境科学, 2019, 40(3):1120-1131.
Huang Xiaogang, Zhao Jingbo, Cao Junji et al. Spatial-temporal variation of ozone concentration and its driving factors in China. Environmental Science, 2019, 40(3):1120-1131.
|
| [41] |
何甜, 帅红, 朱翔. 长株潭城市群污染空间识别与污染分布研究[J]. 地理科学, 2016, 36(7):1081-1090.
He Tian, Shuai Hong, Zhu Xiang. Pollution space recognition and pollution distribution of Changsha-Zhuzhou-Xiangtan Urban Agglomeration. Scientia Geographica Sinica, 2016, 36(7):1081-1090.
|
/
| 〈 |
|
〉 |