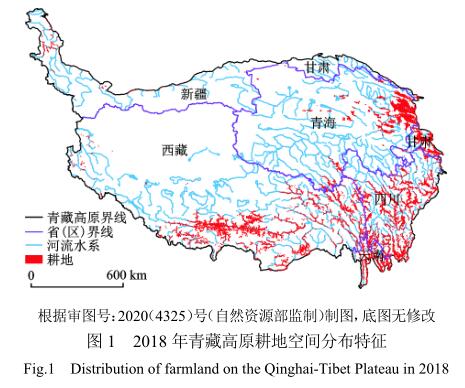
Identifying the status quo, spatial differentiation and influencing factors of farmland has practical significance for optimizing and adjusting the spatial utilization pattern of farmland to guarantee the regional food security. Based on the 0.51-1.02 m high-resolution images of Google Earth, this study obtained the farmland area in 2018 and analyzed its spatial variation and causal factors on the Qinghai-Tibet Plateau by visual interpretation, GIS-based spatial analysis and geographic detector model. The results show that: 1) In 2018, total farmland area on the Qinghai-Tibet Plateau was 133.73 million hm2, decreased from east to west and from south and to north. Of the total farmland area, 33.27% is concentrated in the Yijiang Lianghe valleys of Tibet and the He-Huang valleys of Qinghai, while 76.02% and 75.41% are distributed within the range of 1600 m from roads and 5000 m from rivers, respectively. 2) Under the influence of topography and climate, the farmland shows a scattered and relatively concentrated spatial differentiation characteristic. Most farmland is concentrated in the zones between 3500-4000 m of elevation, 6°-15° of slope steepness, 400-600 mm of annual precipitation, and 0-5℃ of annual temperature, respectively. In other areas, the farmland area is small and mostly distributed in a point pattern. 3) The spatial distribution of farmland on the Qinghai-Tibet Plateau was jointly influenced by natural factors including topography, climate and soil, as well as socioeconomic factors of GDP, population and location, ect. In particular, duration of sunshine hours and precipitation in the growing season, and slope steepness had the greatest influence, and generally determined the farmland spatial distribution on the Qinghai-Tibet Plateau.
Obtaining accurate land cover information in cloudy mountain areas are severely impacted by cloud contaminations, the scarcity of field validation points, and the complexity and fragmentation of landforms. Taken the Southeast Qinghai-Tibet Plateau, a typical cloudy mountainous area and ecological transition zone, as study area, this research first extract the spectral features, radar features, textual features, topographic features through the spectral data, radar data, DEM data and auxiliary data based on the Google Earth Engine and filed observed data. Then we built the random forest model and made feature reduction using recursive feature elimination, in order to improve the accuracy of land cover classification by using multi-source remote sensing data effectively. Results showed that: 1) The feature numbers reduced from 58 to 38 after feature optimization, classification accuracy (overall accuracy 93.96%, Kappa coefficient 0.92) slightly improved compared to unoptimized (overall accuracy 93.11%, Kappa coefficient 0.92); 2) Topographic and radar features played an essential role in the land cover classification of mountainous cloudy areas. If the topographic features and radar feature were excluded, accuracies would decrease to 88.98% and 92.48%, respectively. Topographic features would influence the classification accuracy of most land cover types, while radar features had more impacts on bare lands, construction lands, and shrublands. Textual features and sequential features could only help to increase the accuracy of land cover type with significant textual features and temporal variations. More accurate land cover information can be detected by combing the random forest and feature optimization algorithm, while also provide a more efficient and faster way of integrating multisource data, thus making contribution to land cover classification of the cloudy and mountainous area.
Accurately quantifying the spatiotemporal pattern of grazing intensity on the Qinghai-Tibet Plateau (QTP) is crucial to improving our understanding of the driving mechanism of alpine grassland change, and is of great significance for maintaining regional ecological security and promoting sustainable development policies. Based on the data of livestock inventory at the end of the year and environmental covariates (e.g. population density in pastoral areas, growing season NDVI, annual precipitation, annual mean temperature, and settlements), the gridded grazing intensities on the QTP in 2000, 2010, and 2020 were simulated by geographically weighted random forest (GRF), and the regional differences in the interpretability of environmental variables were then analyzed. The results showed that grazing intensity maps predicted by the GRF could mirror the spatial distribution of grazing intensity on the QTP, compared with the classic random forest model, the R2 was higher, and both the mean absolute value error (MAE) and root mean square error (RMSE) were lower. The grazing intensity was generally higher in the southeast and lower in the northwest of the QTP. The areas with grazing intensity of less than 25 sheep units/km2 in the northwest part accounted for about half of the QTP. Compared with 2000 and 2010, the grazing intensity of the QTP in 2020 showed a trend of overall decrease but local increase. For example, compared with 2010, the areas of grazing intensity decreased by higher than 1 sheep unit/km2 in 2020 accounting for 61.69% of the pastoral area. The population density in pastoral areas was the most important factor explaining the spatial heterogeneity of grazing intensity, and its relative importance was higher in the western QTP and lower in the eastern QTP. On the contrary, the relative importance of both precipitation and growing season NDVI was higher in the northwest part and lower in the southeast part of QTP. Our results provide scientific references for sustainable grassland management and ecological safety barrier construction on the QTP.
The function of water production is an important manifestation of ecosystem service. Water resources and ecosystem have two-way influence. Dynamic identification of spatial differentiation characteristics and driving factors of water production service is of great significance to adjusting infrastructure allocation, optimizing water resources management and protecting regional ecosystem. Taking the Qinghai Lake Basin as the research area, based on the land use of the 8th phase of 1985—2020, combined with terrain, soil and meteorological data, the localized modified InVEST model and geographical detector method were used to simulate the basin water production service, evaluate the spatial differentiation characteristics of water yield, and analyze its spatial heterogeneity attribution. The results show that the change range of water yield in the Qinghai Lake Basin from 1985 to 2020 is 1.168 to 8.152 billion m3. The change trend is obvious, it is the "W" type change trend of falling first and then rising, and then rising after falling; The spatial distribution of water production depth is high in southeast and low in northwest, High-value areas are all concentrated in Haiyan County; On a vertical gradient, Water production capacity decreases with increasing altitude; Geodetection results showed significant differences in the ability of single factorial to explain spatial differentiation of water production services, In different partitions, the explanatory force of climate factors is the most significant; the influence degree of spatial differentiation of water production service is determined by multiple factors, and the interaction explanatory force of precipitation and actual evapotranspiration is the dominant factor.
Risk identification of ecosystem services (ESs) supply and demand are essential for optimizing ESs management. However, few studies focused on balancing ESs supply and demand in complex mountainous areas. In this study, InVEST model, supply-demand ratio coordination degree model, and spatial autocorrelation were used to quantitatively evaluate the supply-demand matching relationship of typical ecosystem services in Bailongjiang River Watershed in Gansu Province. Based on the identification of supply-demand risk, ecological management zones were delineated, and targeted management strategies were proposed. The results show that: 1) From 2002 to 2018, only the total food demand showed a decreasing trend, while the total supply of food, the entire supply and demand of water conservation, and soil conservation showed an increasing trend. In terms of quantity matching between supply and demand, only the whole food supply in 2002 and 2010 was less than the total demand, and the other services showed a surplus. 2) As to the spatial matching type of supply and demand, the dominant type of water conservation was high supply with low demand. The soil conservation was high supply with high demand and low supply with low demand, and food provision service was low supply with low demand. 3) Water conservation services' supply and demand risks are concentrated in the densely populated areas east of the Zhouqu-Wudu section of Bailongjiang River. The supply and demand risks of soil conservation services are mainly in the mountainous areas in the north of Diebu, the east of Dangchang, and most of Wudu and the risk areas of food production supply and demand are concentrated in the east of the watershed and the north of Zhouqu. 4) The BLJW can be divided into five levels of supply and demand risk areas according to the relationship between the supply and demand of the ecosystem. This study proposed an integrated management framework for the balanced spatial allocation of ecological and environmental resources, thus providing a new perspective and approach for enhancing ecosystem services and high-quality regional development.
Geography is the branch of geosciences that is the most closely connected to human activities. However, few studies examine the development of geography from the perspective of geosciences. Science China Earth Sciences is the key journal reflecting the general development, content structure, technical methods, and institutional distribution of the discipline. 193 papers in relation to geography published in Science China Earth Sciences from 2001 to 2021 were selected and analyzed with quantitative toolkits. Combined with content analysis, VOSViewer software was taken to visualize the structural characteristics of the output volume, authors, citations, research institutions, themes, methods, and scale from the data set. The geography papers published in Science China Earth Sciences have showed the following main features: 1) The number of published articles increased, demonstrating an unbalanced development trend in which physical geography, GIS, and remote sensing science were relatively prominent while human and economic geography were relatively downpalyed. 2) The main research institutes and scholars were relatively concentrated, which did not reflect the recent development trend of the discipline. 3) The combination of topics and new technical methods has formed a large research system, showing a substantial dislocation compared with geographical journals. 4) While physical geography combined with GIS and remote sensing technology has become the mainstream of research methods, human and economic geography must be further combined with technical methods. 5) The spatial and temporal scale spans a wide range, with a preference for meso- and macro-level analysis and a micro-level perspective that have not yet appeared in the journal. In general, the existing studies all reflect the geosciences system's understanding and recognition of geography. In other words, it is imperative to break down the inherent boundaries and stereotypes between disciplines, strengthen interdisciplinary crossover, and promote the emergence of disciplinary integration results.
This paper is based on knowledge spillover theory of entrepreneurship and entrepreneurial ecosystems, and the empirical analysis targets at 739 Chinese Growth Enterprise Market (GEM) listed firms. The key parameters of descriptive analysis are the Herfindahl Index and the regional Gini coefficient. Using zero-inflated negative binomial models, this paper analyzes the development characteristics, spatiotemporal pattern and location factors of Chinese high-growth start-up firms. The main conclusions of this paper are as follows: 1) In terms of temporal distribution, Chinese high-growth start-up firms generally show a steady trend, but their development shows "M" shaped volatility due to the influence of economic environment and national policies. In terms of spatial pattern, Chinese high-growth start-up firms exhibit the dual characteristics of decentralization and agglomeration, whilst agglomeration prevails. The degree of agglomeration varies according to the type of industry. 2) In terms of spatiotemporal pattern and its evolution, Chinese high-growth start-up firms are increasingly spreading from the coast to the inland, and from the central cities to the surrounding peripheral cities. Although it presents a decentralization trend, its distribution is still highly concentrated. 3) The formation of Chinese high-growth start-up firms is not random. The location factor includes science and technology expenditure ratio, agglomeration economy level, venture capital stock, human capital stock and informatization level. The five new location factors all exert significant impact on the formation of high-growth start-up firms, and the degrees of influence decrease in turn. This suggests that a well-functioning regional entrepreneurial ecosystem plays an important role in the emergence and development of high growth start-up firms.
In this paper, on the basis of measuring the whole and regional efficiency of NQI by using "vertical and horizontal" opening grade method and entropy weight assignment method, the Dagum Gini coefficient, kernel density estimation method and β convergence model are used to reveal the spatial differentiation characteristics and the convergence mechanism of NQI efficiency. The research found that: 1) NQI efficiency in eachprovinces, cities and autonomous regions has non-equilibrium characteristics, showing the spatial distribution characteristics of "high east and low west". From the trend of change, the national NQI and the efficiency values of the four regions showed a steady growth trend, but there were also significant differences between provinces, cities and autonomous regions. 2) During the investigation period, the whole country showed an upward trend of oscillation, and the overall difference was further expanded, and there was a phenomenon of polarization. The main source of the overall difference of NQI efficiency are the regional difference, followed by the hyper-variable density. 3) From the convergence characteristics, there are absolute β convergence and conditional β convergence of NQI efficiency in the whole country and the four regions, and it is significantly negative.
Based on the data of 286 cities from 2010 to 2019, the spatial pattern evolution, agglomeration pattern and driving factors of China's digital economy are explored by spatial analysis techniques and multiple linear regression models. 1) In terms of spatial and temporal evolution, China's digital economy shows a steady development and spatial agglomeration trend, and the geographical proximity characteristics are increasingly obvious. 2) In terms of movement trajectory, the center of gravity of China's digital economy development is biased toward the southeast, showing a ladder moving trend from ''northeast to southwest''. 3) In terms of spatial pattern evolution, the overall pattern is strong in the east and weak in the west, and the ''four-tier'' pattern of digital economy development with Beijing-Tianjin-Hebei, Yangtze River Delta, Pearl River Delta and Chengdu-Chongqing as the core is gradually clear, and the leading position of provincial capitals is becoming more and more prominent. 4) In terms of spatial agglomeration pattern, the high-high agglomeration shows the trend of ''group'' agglomeration, the low-low agglomeration is mainly distributed in the ''western'' region, the high-low agglomeration and low-low agglomeration show dependence effects, and the geographical proximity is significant. 5) In terms of spatial development types, accelerated development cities are mainly concentrated in the central and western regions, while starting development cities are mainly concentrated in the east of the ''Hu Huanyong Line'' and balanced development cities are scattered. 6) From the perspective of influencing factors, the spatial pattern and evolution of digital economy are significantly influenced by information technology base, geographic area, economic level and human capital.
Taking the rural settlements of Jinchang City in Hexi Corridor, Gansu Province as an example, this paper analyzed the coupling coordination level of "population-land-industry" system and location advantage degree in 133 administrative villages based on the theory of human-earth areal system. And the concept model of rural residential consolidation zoning was constructed for differentiating the types of consolidation. The results show that: 1) The coupling coordination level of "population-land-industry" system of rural residential areas in Jinchang City has significant spatial differences, which is generally in the stage of general coordination. In terms of location, it has obvious characteristics of urban orientation and traffic orientation. 2) Under the comprehensive effect of urban radiation and road traffic, the regional advantage degree of rural settlements shows a three-level decline trend from the urban center to the periphery. Affected by the density of road network and the level of traffic trunk lines, the high advantage areas extend to different directions partly. 3) Through the superposition analysis of "population-land-industry" coordination and location advantage degree, combining with the actual situation, this paper divides study area into six types of consolidation, which include optimization and improvement type, integrative development type, optimization and adjustment type, progressive promotion type, guiding development type, reconstruction and demolition type. Then we propose ideas and strategy of zoning consolidation.
The 2030 Agenda for Sustainable Development of the United Nations sets out the goal of eradicating poverty in all its forms and achieving gender equality around the world. The year of 2020 is the decisive year to resolutely fight against absolute poverty in China. In the post-poverty alleviation era, the introduction of gender factors into the theory and practice of poverty research is conducive to formulating poverty alleviation policies for poor women. This paper reviews the research progress of feminist geography, the research on women's poverty and the research on the influencing factors of women's poverty. Based on feminist geography and poverty research, this paper constructs a research framework on women's poverty in China from two levels. At the macro spatial level, by measuring the incidence of female poverty and the female relative poverty index using the data of urban and rural minimum security population data, this paper depicts the spatial differentiation and evolution characteristics of Chinese female poverty. At the micro individual level, build a multi-dimensional poverty index (MPI) using China Comprehensive Social Survey (CGSS) data, this paper explores the gender difference characteristics of poverty and the multi-dimensional poverty characteristics of women. Based on China's unique economic, political and cultural environment, this paper analyzes the factors affecting women's multidimensional-poverty from the perspectives of gender and region by binary logistic regression analysis. Last not least, poverty reduction policies for women are summarized. Studies have shown that: 1) The relative poverty level of Chinese women has deepened significantly from 2010 to 2017, and there are large differences in different regions. At the same time, the regions with deep poverty levels show clustering characteristics. 2) Women have higher level on the breadth and depth of multi-dimensional poverty compared with men. 3) The incidence of poverty among women is higher than that of men in multiple dimensions. Those women who are struggling in the situation of multi-dimensional poverty are mainly deprived on the aspect of employment, human capital and assets. 4) China has a unique influence mechanism on female poverty. The household registration system, cultural ideology and employment in the labor market are the main aspects that affect women's poverty. This paper aims to enrich the research on poverty geography and women's geography, and lay a foundation for improving the quality of poverty alleviation and formulating gender-based sustainable development policies.
A comprehensive comparison of the development degree of people's livelihood and well-being in Guangdong Province and the formation mechanism of differences are very important for Guangdong Province to better implement the Rural Revitalization Strategy and promote regional coordinated development. Based on this, through the construction of a comprehensive development indicator system covering 16 indicators in the six dimensions of urbanization, economy and employment, ecological environment, public infrastructure, culture and education, and health and health, the development degree of people's well-being and the formation mechanism of differences in the cities of Guangdong Province are calculated, compared and analyzed. The results show that: 1) From 2016 to 2020, the urban development level of Guangdong Province generally maintained a growth trend, but the spatial distribution was uneven and the polarization was obvious. 2) By using the Theil coefficient, the differences in the development of well-being in Guangdong Province are decomposed into intra regional differences and inter regional differences in the Pearl River Delta, eastern Guangdong, western Guangdong and northern Guangdong. It is found that inter regional differences are the main source of the differences in the development of people's well-being in Guangdong Province, which is mainly reflected in the gap in the development of people's well-being between the Pearl River Delta and the other three regions, and this gap tends to expand; Among the regional differences, the imbalance of people's livelihood and well-being development of cities in the Pearl River Delta is much higher than that of the other three regions. 3) The difference in the development of people's livelihood and well-being is the result of the joint action of many factors, among which public infrastructure and cultural and educational factors contribute the most significantly to the difference in the development of people's livelihood and well-being.
Child trafficking is a serious social problem, causing numerous family tragedies and undermining social stability. Based on the case data obtained from field investigation and public welfare platforms, the life course theory and theory of ambiguous loss are used to revealed the patterns and trends in the life trajectory of trafficked children, they go through four stages: Being trafficked, being adopted, seeking relatives, and recontacting biological family. The results indicate: 1) The life trajectory of trafficked children shown a fluctuating or stable pattern as a whole. After recontacting biological family, their life trajectory will continue to change according to their circumstances. 2) Changes in the life trajectories of trafficked children were closely related to the adoptive families. The life trajectory of trafficked children living in bad families fluctuates greatly, while that of trafficked children living in intermediate and good families was relatively flat. 3) In the process of seeking relatives, tremendous social changes have a strong influence on the life trajectory of trafficked children, but the interpretation force of individual initiative cannot be ignored. 4) Even if the life trajectory of a child was smooth and upward, it can hardly offset the negative effects of trafficking, such as chain reaction, persistent, interaction and cumulative effect.
As a booster that drives the high-quality development of China's economy and a ballast stone that prevents the hollowing of urban industries, the manufacturing industry's spatial evolution characteristics and identification of driving factors are of great significance for optimizing the spatial layout of urban industries and rationally deploying resources. Based on the data of micro enterprises from 1990 to 2020, the spatial evolution characteristics and driving factors of manufacturing industry in Lanzhou were explored by using kernel density, spatial autocorrelation analysis, geographic detector and deographically weighted regression model, etc. The results show: 1) From the perspective of spatial structure, Lanzhou's manufacturing industry has gradually evolved from the spatial structure of "two-center" in Chengguan District and Xigu District to the pattern of "multi-center agglomeration and axial contiguous development" in the central city and suburbs, showing a clear trend of suburbanization; 2) Lanzhou's manufacturing industry has significant agglomeration characteristics. development zones, new areas and state-level new areas are the main carriers of manufacturing agglomeration in different periods. It can be said that the three generations of "new areas" have reshaped the economic and geographical pattern of the manufacturing industry; 3) From the perspective of driving factors, policy factor, land price, transportation factor and agglomeration economy are the main driving factors affecting the spatial distribution of manufacturing industries. Among them, the spatial heterogeneity of policy factor represented by state-level new areas and development zones is more significant, while the spatial heterogeneity of agglomeration economy represented by the number of enterprises is relatively stable.
Exploring the village's objective well-being and its impact on farmer's subjective well-being in the Loess hilly and gully region is of great significance for improving the research on human well-being in rural areas and promoting rural revitalization. Taking Mizhi County of Shaanxi Province as a study area, the spatial distribution of village's objective well-being was evaluated based on the human needs theory, and farmer's subjective well-being was measured from the cognitive and emotional dimensions. Finally, the impact of the village's objective well-being on farmer's subjective well-being was revealed through the multi-level model. The results were as follows: 1) The village's demand dimension and objective well-being had obvious spatial differentiation. Villages in the river area, central villages in towns and rural revitalization villages had a high degree of satisfaction of each demand dimension and a high level of objective well-being. 2) Life satisfaction and emotional health had a significant positive correlation. Male, people in good health, the elderly, and farmers with higher annual incomes had higher subjective well-being, and subjective well-being was not sensitive to the education level. 3) Housing, village clinics, and medical participation rates, collective economy, information accessibility and agricultural technology training, leisure facility area, and village cleanliness were all significantly positively correlated with farmer's subjective well-being. There was a significant negative correlation between geological disasters and farmer's subjective well-being.
By using social network analysis, factor analysis, and entropy-weight TOPSIS method, etc., this paper constructed a classification model based on multi-source data to try exploring a scientific, universal and feasible classification of villages, and comparing the factors influencing village differentiation as well as the classification system of villages in Qianguo and Jingyu counties of Jilin Province. The results show that: 1) The main factors reflecting or influencing the differences of villages are demographic and activity characteristics, accessibility of service facilities, urban radiation, and traffic conditions, which reflects that the contemporary village is quite an open and outward system rather than a self-sufficient one. 2) Although the economic development levels of Qianguo and Jingyu counties are similar, the latter's village differences are more significantly influenced by terrain obstacles and resource and environmental base due to its mountainous other than plain topography. 3) The proportions of relocation or merging category in both counties' primary village categories are relatively high (40.6% in Qianguo, 27.9% in Jingyu), but the specific reasons of them are different. The main secondary village types in both counties are governance to be improved type, population losing type, and prohibited or controlled by planning type, which reflects the overall regional characteristics of northeast China, such as underdeveloped non-agricultural industries in rural areas, rapid population loss and growing development differentiation, and the high proportion of key ecological function areas.
Wind erosion climatic erosivity is an index constructed after comprehensive parameterization of wind speed, precipitation, and so on. It is usually used to characterize the potential wind erosion level under the comprehensive influence of a series of climatic conditions. Many studies have been carried out in the calculation of wind erosion climatic erosivity, temporal and spatial changes and driving factors of wind erosion climatic erosivity around the world. However, previous studies in China mainly focused on arid and semi-arid areas inland, and rarely involved coastal areas, which probably also has high wind erosion climatic erosivity. Therefore, the main coastal areas of China were selected as the research area. Based on the observation data of 64 meteorological stations in the main coastal areas in China from 1960 to 2019, we calculated the average level of wind erosion climatic erosivity by the model proposed by Food and Agriculture Organization of the United Nations, and we analyzed its variation by Mann-Kendall test model, Morlet wavelet and so on. In order to reveal the influencing factors of change accurately, we selected four indicators for analysis, including the Multivariate El Niño-Southern Oscillation Index (MEI), the number of days with average wind speed>8 m/s (QSD), Rainfall erosivity (Re), and Drought Index called Surface Wetness Index (SWI). The following results are obtained: 1) Wind erosion climatic erosivity of coastal areas in China were in range of 0.34-197.32, and the average value was 38.78, which was similar to the average value of inland arid and semi-arid areas in China. The seasonal characteristic of wind erosion climatic erosivity of coastal areas was that winter (14.13) >autumn (11.74) >spring (9.99) >summer (2.57). 2) The mean annual and seasonal wind erosion climatic erosivity of coastal areas in China both had decreased significantly without mutation point during research time, and the first major cycle was 12 years in inter-annual changes, and it was 5 years in spring or winter, 26 years in summer or autumn. 3) The number of days with average wind speed >8 m/s (QSD) was the main positive driving factor of wind erosion climatic erosivity in China's main coastal areas; The Multivariate El Niño-Southern Oscillation (ENSO) may indirectly drive changes in wind erosion climatic erosivity by affecting precipitation; rainfall and drought mainly had negative impacts on changes in wind erosion climatic erosivity in winter when wind speed dropped.
Based on the data of land use in 2010, 2015 and 2020 and 16 driving factors including natural and socio-economic factors, the Future Land Use Simulation model (FLUS) was used to simulate and predict the ecological-productive-living spaces of the Guangdong-Hong Kong-Macao Greater Bay Area (GBA) in 2025 and 2035 under four scenarios of production space priority, living space priority, ecological space priority, and ecological-productive-living spaces coordination. The results showed that: 1) From 2020 to 2035, the production space in GBA continued to increase under the production space priority scenario, it continued to decrease under the ecological space priority scenario; The production space increased firstly, then decreased under the ecological-productive-living spaces coordination scenario and the living space priority scenario. 2) From 2020 to 2035, the living space in GBA increased under all four scenarios. It increased least under the production space priority scenario; it increased most under the living space priority scenario. 3) From 2020 to 2035, the ecological space in GBA only increased under the ecological space priority scenario; It decreased under all three remaining scenarios. 4) The change of the ecological-productive-living spaces in the mountainous area at the edge of the GBA under the four scenarios is relatively small. But the change of the ecological-productive-living spaces in the central plain area is more obvious. The results of multi-scenario simulation can provide a spatial reference for the realization of sustainable development and the completion of an international first-class bay area in GBA.