
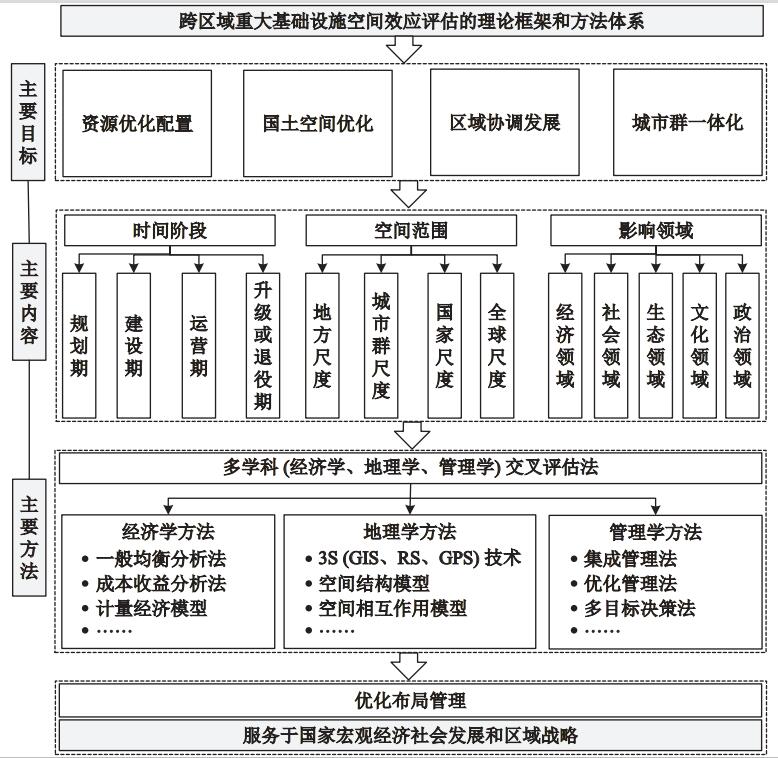
The construction of major trans-regional infrastructure is a reflection of national political, economic, social, and technological progress. It is also an important means of optimizing resource allocation, promoting coordinated socio-economic development, and optimizing the governance system of national territorial space. How to scientifically understand and evaluate its spatial effects has become a theoretical problem that the academic community needs to solve. The 'Five-in-One' economic, social, ecological, cultural, and political effects of major trans-regional infrastructure overlap and interact with each other. A reasonable evaluation of their comprehensive effects not only meets the needs of national regional development strategies, but also promotes the solution of practical problems. Against this background, based on the needs of decision-making for the construction and operation of major trans-regional infrastructure, this study systematically sorts out the connotation, types, and functions, as well as the development process of major trans-regional infrastructure in China, and analyzes the theoretical connotation, basic characteristics, and formation mechanism of the spatial effects of major trans-regional infrastructure from the perspectives of geography and economics, and studies the construction of its evaluation framework. The results show that although the theoretical connotation of the spatial effects of major trans-regional infrastructure is constantly expanding with the development of relevant theories, it presents obvious characteristics of comprehensiveness, regionality, and dynamics. Its formation mechanism mainly involves location creation, factor flow, and agglomeration effects. At the same time, considering that the comprehensive evaluation of the spatial effects of major trans-regional infrastructure needs to achieve multiple goals, and different goals often focus on different content and adopt different methods, the evaluation framework and method system should include three levels: evaluation goals, evaluation content, and evaluation methods. Therefore, it can provide practical guidance for the layout optimization of major trans-regional major infrastructure.
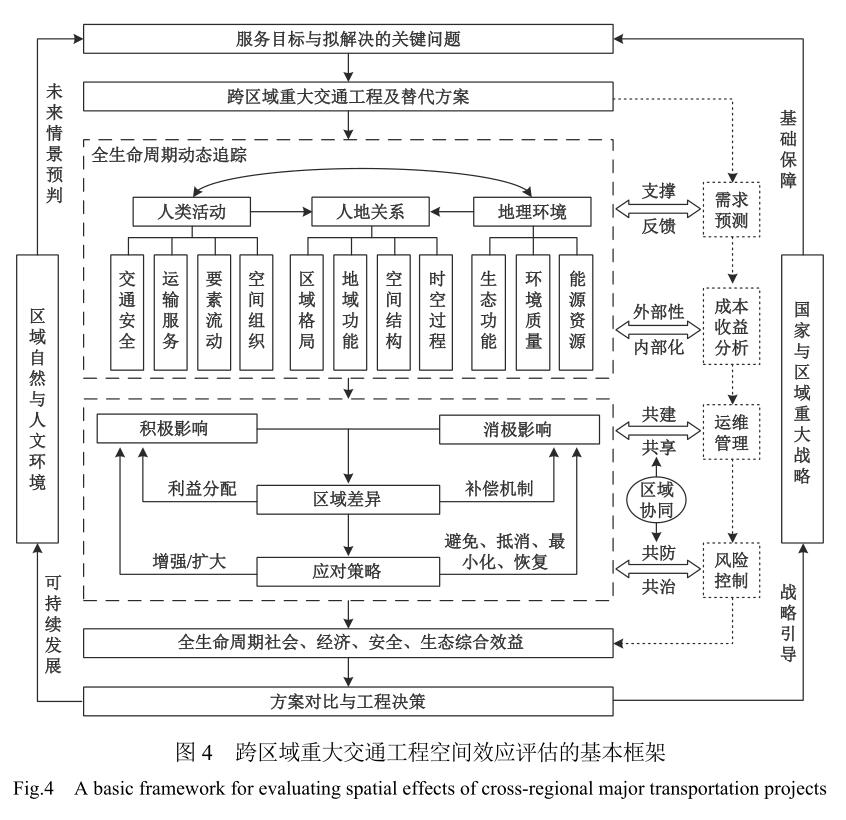
Cross-regional major transportation projects have important social, economic and ecological impacts on regional development. Geographers are good at evaluating the spatial effects of major cross-regional transportation projects from the perspective of human-environment relationship, serving regional development and major national strategies. Although there are many related studies, the systematic evaluation framework still needs further exploration and innovation. This paper discussed the definitions and characteristics of major cross-regional transportation projects and their spatial effects, and proposed a framework for evaluating the spatial effects of major cross-regional transportation projects. Finally, the key research directions in this field were prospected. Results show that, spatial effect refers to the comprehensive impacts of an event on the function, form and structure of the related human-environment regional systems. The goal of evaluating the spatial effects is to serve the decision-making, operation and maintenance management and risk control of major cross-regional transportation projects, and to improve the sustainability of major cross-regional transportation projects and the related human-environment regional systems. The main points of the evaluation framework include the unification of problem orientation and goal orientation, scientific prediction of future development scenarios, dynamic tracking evaluation of the whole life cycle, balancing the positive and negative impacts, combination of qualitative and quantitative methods, connection and interaction of multi-disciplinary evaluation systems, etc.
Spatial impact assessment is the key scientific basis to carry out the layout and construction of major cross-regional infrastructure and to achieve infrastructure sustainability. Based on the relevant literature of infrastructure spatial impact evaluation at home and abroad, and on the basis of expounding the concept connotation and evaluation content of infrastructure spatial effect, this article systematically combs the progress of the evaluation techniques and methods of infrastructure spatial effects at the project and macro-regional level. The spatial impact of infrastructure can be understood as the comprehensive effect of infrastructure on economy, society and ecological environment throughout the whole life cycle in the process of interaction with regional system. The existing method system of spatial impact assessment is one-sided, and the theoretical framework and technical method system of spatial impact assessment of trans-regional major infrastructure construction need to be integrated and improved from a multi-dimensional and comprehensive perspective. It is proposed to strengthen the dynamic assessment method and technology integration based on the whole life cycle, construct the sustainability standard and basic list database for cross-regional major infrastructure, strengthen the related infrastructure security resilience assessment method and technical research, Strengthening the integrated evaluation method of land spatial pattern effectiveness of cross-regional major infrastructure and promoting the application of big data in infrastructure spatial impact evaluation are the important research directions of infrastructure spatial impact evaluation methods. At the same time, againist the background of Global Change and Globalization, there is also huge room for the assessment of large trans-regional infrastructure security resilience, the impacts on geopolitics, national and cultural exchanges, territorial cohesion and so on..

Multiple/multi-airport system (MAS), that is, a set of significant airports that serve commercial transport in a metropolitan region regardless of ownership or political control of the individual airports, plays a key role in commercial aviation. According to this definition, there are 3 keywords to describe MAS: 1) a set of two or more significant airports, 2) that serve commercial traffic, and 3) within a metropolitan region. Therefore, MAS is a typical cross-border (or cross-regional) major infrastructure, which can serve more than one city, namely metropolitan area. However, recent studies' MAS identification method is mainly based on the administrative boundary or the spatial/temporal distance between airports. These methods fail to capture the cross-border characteristic, in addition to the typology of airport and city from a spatial perspective, resulting in the identification bias. After sorting out the concept of MAS, this study proposes a two-step search method to identify MAS. Specifically, the first step is to search for a neighboring primary city with the primary airport as the center, and the second step is to search for significant airports within a specific radius centered on the primary city (i.e., potential center of metropolitan area) obtained in the previous step. With the help of the Annual World Airport Traffic Dataset 2019 and World Cities Database, this study identified the MAS worldwide in 2018 based on the two-step search method. Then, it analyzed the geography of MAS worldwide and its relationship with the place's attributes through geo-visualizing MAS worldwide. The findings are as follows. First, the two-step search method works well, reflecting the relationship between the airport and the metropolitan area. Second, at the metropolitan scale, the maximum reasonable distance between the airport and the primary city can be 70 km; at the city scale, the ultimate reasonable distance between the airport and the city may be 30 km. Third, 59 MAS worldwide in 2018, including 142 civil transport airports, played an essential role in global civil aviation transportation. MAS carries 39.68% of the global throughput, including 3.379 billion passengers and 61 million tons of freight (or air cargo). The average number of airports in the MAS is 2.41. MAS typically contains a large airport with a smaller significant airport. The average airport-city journey time is 39.35 min. Forth, the geography of MAS shows a multicore structure, with most of MAS distributed in coastal areas and regional centers. The detailed characteristics of MAS, such as the transportation volume, the number of airports, and the ground distance between airports and metropolitan area, also shows prominent regional features. Fifth, serval factors, including air transport demand, socio-economic factors, and natural conditions, are jointly related to the geography of MAS. Our findings will pave the way for future research on MAS from a geographic perspective, such as the interaction between MAS and place.

Since the reform and opening up, China has gradually formed a more sound commodity market, but the reform of factor market allocation has lagged behind relatively. The markets for capital, labor, land and other factors of production are still not perfect, and the problem of resource allocation significantly affects the transformation of China's productive forces and production relations. Due to the significant differences in resource endowments in different regions and the restrictions on the free flow of factors by administrative barriers, the cost of factor flow and access to regions is high and resources cannot flow smoothly to advantageous locations. This leads to uneven resource allocation between regions and spatial misallocation of resources. The spatial misallocation of resources not only triggers competition for regional resources, intensifies local protectionism, and leads to more serious structural imbalances such as industrial structure convergence, duplication of major facilities construction and excessive market competition in various regions, but also aggravates problems such as urban traffic congestion, housing tension and environmental pollution due to unbalanced resource allocation. Therefore, a comprehensive and in-depth exploration of the characteristics of resource misallocation in China and its spatial and temporal evolution pattern is of great theoretical and practical significance for the government to re-examine the characteristics of factor mismatch, clarify the direction of optimising resource allocation and promote factor market-oriented reforms. To accurately reflect the spatial mismatch degree and spatial-temporal evolution law of city resources, this paper measures the mismatch degree of capital, labor, and land resources in cities at the prefecture level and above in China from 2003 to 2018 based on the extended three-factor spatial general equilibrium model. We use spatio-temporal kernel density and comprehensive coordination index to analyze the changing trend of city resources spatial mismatch, spatial agglomeration pattern, and the coordination degree of factor marketization reform. The results show that: 1) The variation trend of city spatial mismatch degree of different resources is different. The misallocation of capital and labor space continues to improve, but the misallocation of land space first alleviates and then intensifies. The administrative force hindering the market flow of resources is an important factor aggravating the land misallocation. 2) The spatial agglomeration patterns of the three resources among cities are different. The spatial allocation of city capital and land resources has strong regional bias and convergence, and the resource allocation of neighboring cities shows a high-high, low-low positive agglomeration pattern. However, household registration barriers and unequal public services hinder the free flow of city labor, making it difficult to achieve a balanced allocation of labor resources between cities, and the labor resources in neighboring cities show a high-low negative agglomeration pattern. 3) Neighboring cities have consistency in capital market reform and land policy adjustment. However, the coordination degree of labor mismatch between cities is worsening. Northeast China has the lowest degree of synergy in factor marketization reform. The research conclusion of this paper provides a reference for improving the mechanism of market-oriented allocation of factors and clarifying the evolution path and optimization strategy of resource allocation at the city level.
Transport infrastructure interconnection (hereinafter referred to as "connectivity") includes both physical (hard) connectivity of infrastructure and operational (soft) connectivity of transport organizations, mainly serving the movement of people and trade in goods. The implementation of “the Belt and Road Initiative” (BRI) has improved connectivity between China and BRI countries, affecting bilateral trade between the countries. Taking the bilateral trade of goods between China and the BRI countries during 2008 to 2018 as the research objects, this paper constructs a panel regression model, respectively from whether the traffic facilities are connected and its connectivity level both quantitative evaluation and measure the level of different types of traffic infrastructure interconnectivity of goods trade along the "threshold effect" and "agglomeration effect". Results indicate that: 1) The improvement of connectivity has a positive effect on goods trade; 2) Different modes of transportation have a great difference in the impact of bilateral goods trade, among which, Marine transport have the greatest impact, followed by road and aviation transport, and the operation impact of the China-Europe express train was still not prominent; 3) There are also significant differences in the sectoral impact of different modes of transport on bilateral goods trade. The results could provide a reasonable analysis and explanation for the spillover of improved transport connectivity in bilateral goods trade, and also provide enlightenment for how China could enhance bilateral goods trade with BRI countries.
Typical Chinese villages is the core of the interaction of human-land relationship in rural areas and the spatial carrier of rural revitalization. Systematic study of the spatial distribution of typical villages and their influencing factors is important for the systematic evaluation, identification, rational planning and layout of typical villages in the process of rural revitalization strategy implementation. Taking traditional villages, ethnic villages, key rural tourism villages and forest villages as research objects, this paper comprehensively analyzes the spatial distribution characteristics and influencing factors of typical villages by using ArcGIS spatial analysis and geographic detectors. The results show that: 1) The typical Chinese villages is distributed in a spatial pattern of ''dense in the southeast and sparse in the northwest'', bounded by the Hu Line. 2) The spatial distribution of typical Chinese villages has a significant agglomeration, among which the high-density areas of traditional villages are distributed in Southeastern Guizhou-Western Hunan-South Anhui, Southwest Zhejiang-North Fujian and Southeastern Shanxi, and the core area is in the shape of ''品''. The high-density area of ethnic villages is located at the intersection of Hunan, Guangxi and Guizhou, and gradually decreases from southwest to northwest and coastal areas. The key rural tourism villages radiate westward to Qinghai, Gansu, Sichuan and Yunnan with Beijing-Tianjin-Hebei and Shanghai-Jiangsu-Zhejiang as the double core. Forest villages radiate from Beijing and the border of Zhejiang and Anhui to the surrounding areas. 3) The main factors affecting the spatial distribution of typical villages include topography, hydrology, transportation, economic development level, population and ecological environment, etc. The study on spatial distribution characteristics and influencing factors of typical Chinese villages can provide suggestions and references for the development protection and further development.
Rural development efficiency (RDE) is an analysis of inputs and outputs in the process of village construction from the perspective of economics, and is an implicit indicator of village development. Scientific evaluation of RDE is important to promote rural revitalization. The study takes Xintai City, China, as an example, evaluates the production, living and ecological development efficiency (PE, LE, EE) of 789 villages using the super-efficient DEA model, and analyzes different development efficiency characteristics using mathematical statistics and spatial autocorrelation, and explores the influence mechanism with the spatial econometric model. The results show that the changing trend of RED under different dimensions is similar, the average PE is the largest, LE is the second and EE is the smallest. The development efficiency of the same village varies in different dimensions, mostly showing similar values of PE and LE, but with a large difference in EE. The spatial distribution pattern of different dimensions is significantly different, and the overlap of high-value areas of PE, LE and EE is low, only 43. With the in-depth implementation of rural revitalization, the role of natural-geographic factors in restricting rural development gradually decreases, while the influence of socio-economic and policy-cultural factors gradually deepens. In general, policy-cultural factors are significantly and positively correlated with RDE. The study aims to provide a scientific basis for the comprehensive and sustainable development of rural areas and promote rural revitalization.
Urban and rural development is one of the important connotations in the practice of structural transformation and sustainable development in the new era of China. Exploring the relationship between urban-rural structure and economic growth in the three provinces of Northeast China is not only the research focus of new urbanization and high-quality economic development, but also an important issue to be solved in the process of Northeast revitalization. Based on the panel data of 34 prefecture-level cities in the three provinces of Northeast China from 2003 to 2019, this paper constructs an urban-rural structural coordination index system including economic structure, factor structure, social structure and public service structure. Using the global entropy method and the spatial econometric model, this paper explores the urban-rural structure evolution pattern and its effect on economic growth. The research found that: 1) From 2003 to 2019, the overall level of urban-rural structural coordination has improved, and the characteristics of spatial agglomeration are significant. The high-level coordination areas are mainly distributed in the northeastern and south-central regions of the three provinces of Northeast China. The low-level coordination areas are mainly distributed near central cities and urban agglomerations. The central cities are the main area where the element resources are concentrated, and the level of urban-rural structural coordination is low. 2) The spatial pattern of the change rate of each index presents the distribution characteristics of "point-shaped and facial agglomeration". The evolution type of economic structure and factor structure is mainly growth type, the evolution type of public service structure is mainly decreasing type, and the evolution of social structure has obvious inter provincial differences. 3) The improvement of the coordination of economic structure and public service structure, and the decrease of the coordination of factor structure and social structure can promote the economic growth. The improvement of the coordination of urban-rural structure, economic structure and public service structure has a positive spillover effect. 4) The impact of the evolution of urban-rural structure on economic growth has the characteristics of regional heterogeneity. Different regions should formulate differentiated urban and rural development policies according to the actual level of economic and social development.
Based on the data of "double first-class" university enrollment in 2018, this study depicted the inter-provincial migration network of university students and explored its spatial pattern, driving forces and equity implications. The results show that a large number of "double first-class" university enrollment quotas are allocated within a provincial level region or within a macro-region (i.e., eastern region, central region, western region and northeastern region of China), while the inter-provincial student migration is mainly from provinces (municipalities) with large population to provinces (municipalities) with resourceful higher education, resulting in the human capital flight in the central and western China. The pattern of student migration shares similarities with labor migration in terms of flowing to relatively developed regions but also demonstrates differences due to its particularities of migrating for higher education. The number of examinees of the college entrance examination, the scale of enrollment quotas, economic development differences, special admission policy, cultural affinity and geographical distance all have an influence on the flows of student migration. In terms of equity, the Gini coefficient in admission rates per capita and admission rates per examinee are not large between provincial levels, but significant differences exist in intra-provincial admission rates and in extra-provincial admission rates for each university. Similarly, at the regional level, there is also a significant difference between intra-regional and inter-regional admission rates. For some provinces (municipalities), the enrollment quota of "double first-class" universities as well as the intra-provincial admission rate are low, and furthermore, a large number of students flow out. Based on these findings, this study highlights the importance of considering students migration as an essential part of talent mobility and its long-term effects on the regional development imbalance at a macro level. Higher education system should be given more attention when tackling the dilemma of human capital flight.
This paper compares the evolution of the spatio-temporal patterns of commercial house and residential house rents and the difference of influencing factors from 2010 to 2019 in Nanjing by means of multi-scale geographically weighted regression (MGWR) and other methods of geographical space analysis. According to the research, the spatio-temporal evolutions of commercial house and residential house rents are significantly different. The residential house rents rose steadily and presented the distribution of multi-point agglomeration. But the commercial house rents increased in fluctuation and trended towards central polarization. In addition, the expansion of commercial space lags behind and depends on residential space. Although the spatial structure of commercial and residential house rents in Nanjing has a trend of evolution from single core pattern to multi-center network pattern, the overall spatial structure is still presented as the core-periphery model. The spatial differentiation of commercial house and residential house rents in Chinese cities is the result of unbalanced urban development in the process of compressed urbanization. The allocation and adjustment of urban resources such as population, capital and transportation reshape the differentiation and coupling of urban commercial house and residential house rents. Business development is a gradual process and it is significant for coordinating the development of commercial house and residential house in the suburbs to create living atmosphere with high-quality and diversity.
Fear of crime is one of the important factors affecting residents' subjective well-being and life satisfaction, so it has been widely concerned by academic circles. There are five classic theoretical models to explain people's fear of crime: victimization model, vulnerability model, disorder model, collective efficacy model and neighborhood policing model. However, is the correlation between fear of crime and criminal experience different between eastern and western cultures? Is the relationship between different types of victimization and crime fear significant? Whether the type of community has an impact on residents' fear of crime? To answer these questions, we adopted social ecological analysis method, conducted principal component analysis and community clustering based on six census data, and identified the types and characteristics of all communities in Guangzhou. Based on the method of stratified sampling, 74 typical communities in Guangzhou were selected for this study, and 1568 questionnaires were collected through household survey. The results showed that the respondents with crime victimization experience had higher fear of crime than those without. In the 12 indicators related criminal experience, 5 indicators have a significant positive correlation with crime fear. According to the ratio from large to small, they are the pickpocketing experience, the burglary experience, the crime victims of relatives and friends in the bus and subway as well as in other public places and the pickpocketing happened in the community. Among the 5 indicators of individual attributes, only education level has a significant negative correlation with fear of crime, while gender, age, marital status and family income are not significant. In addition, different types of communities have different effects on the respondents' fear of crime. That is to say, after controlling the covariates, the fear of crime levels of residents in middle-income community, non-aging suburban community, aging suburban community, migrant community, low-rent housing community and affordable housing community are significantly higher than those in high-end community, further indicating that the study of crime fear should pay attention to the influence of social spatial differentiation.
The mergers and acquisitions (M&A) investment network of enterprises is an important perspective to understand and examine the economic geography pattern. With the cultural turn and digital transformation of China's economic development, the mergers and acquisitions investment network of film enterprises has begun to reflect the spatial distribution process of new production factors such as capital, technology, and knowledge. However, existing research has not paid enough attention to this issue. Therefore, this paper attempts to construct a complex network that reflects the local M&A activities of Chinese film enterprises, and depicts the spatial layout, spatial connection and spatial organization characteristics of film enterprises' local M&A activities, as well as their temporal and spatial evolution process, in order to establish a dynamic viewpoint to grasp the evolution trend of China's economic geographic pattern. First, based on the merger and acquisition data of Chinese film enterprises from 2010 to 2019, the city where the film company is located is the network node, and the frequency of M&A is the edge of the network to build a local merger and acquisition network of Chinese film enterprises. Second, the location preference of film enterprises for M&A is test using the kernel density and spatial autocorrelation methods . Thirdly, the internal structure of M&A network and its spatiotemporal evolution are investigated by means of complex network and cluster analysis. Firstly, the two parties of M&A show the characteristics of synergistic agglomeration in big cities, and as time goes on, the degree of agglomeration of the two parties continues to increase, and the choice of target cities also gradually increases. Secondly, There is a positive correlation and interaction between the two parties of Chinese film enterprises' M&A in neighboring cities, but the overall level of correlation is low, and the "regional roots" of film enterprises' M&A have not yet been formed. Thirdly, the node cities in the local M&A network of Chinese film enterprises have obvious differences in levels, which are distributed in a typical "pyramid" shape. Over time, the control rights of film enterprises gradually flow from low-level to high-level node cities through the M&A network. Fourth, the local M&A network of Chinese film enterprises is constantly "encrypting" and "expanding", but the main nodes are relatively solidified, forming a ternary structure of "trunk-secondary trunk-branch". And with the passage of time, the backbone network of domestic M&A of Chinese film enterprises continues to condense, the secondary network continues to expand, and the branch network shrinks rapidly. This paper outlines the overall appearance and evolution trend of China's economic geography by examining the internal structure of the local M&A network of film enterprises and its temporal and spatial evolution. On the whole, the temporal and spatial evolution of the local M&A network of film enterprises reflects that China has not really established a set of linkage mechanisms that can effectively promote the regional transfer of industrial forms and improve the level of regional economic cooperation. In this regard, it should be improved from strengthening the spatial connection of enterprises, encouraging cross-border M&A, and optimizing the efficiency of enterprise agglomeration.
Agricultural water consumption accounts for the largest proportion of water resources consumption in China. It is of great significance to study the utilization efficiency of agricultural water resources to alleviate the crisis of water shortage in China. Considering the undesired output in agricultural production, the efficiency of agricultural green water resources is more valuable to study. This paper aims to measure the efficiency of agricultural green water use and its dynamic changes in China. The panel data of Chinese provincial administrative regions from 2010 to 2018 is used in paper. The panel three-stage DEA model and Malmquist index model are the research methods. The Malmquist index model is used to analyze the driving factors of efficiency change. The results show that: 1) the utilization efficiency of agricultural green water resources in Inner Mongolia, Hainan and Tibet is relatively high; 2) the growth rate of agricultural green water resources utilization efficiency in Jiangsu, Guangdong, Zhejiang and Shandong is relatively high in all provincial administrative regions. The average annual growth rate of agricultural green water resources utilization efficiency in Liaoning and Jilin is negative, and the agricultural green water resources utilization efficiency has decreased; 3) the agricultural green water resources utilization efficiency in the eastern China has increased obviously, and the average annual growth rate is the fastest among the three regions; the central region shows a fluctuating upward trend, while the western region is in a state of steady fluctuation. The driving factors of agricultural green water resources utilization efficiency in China can be divided into technological progress factors, economies of scale and management level factors. Technological progress factors can effectively improve the utilization efficiency of agricultural green water resources in China, which is the main driving force to improve the utilization efficiency of agricultural green water resources in China during the study period. The scale and management level factors have different effects on the utilization efficiency of agricultural green water resources in different regions. The factors of scale economy and management level, together with the factors of technological progress, have promoted the improvement of the utilization efficiency of agricultural green water resources in the eastern region, and the management level factors have promoted the improvement of the utilization efficiency of agricultural green water resources in the western region. However, it inhibited the improvement of the utilization efficiency of agricultural green water resources in the central region. Better communication between regions and industries can eliminate inefficiencies in agricultural production management.
Marine heatwaves are extremely warm sea surface temperature (SST) events that can last for several days to years and extend up to thousands of kilometers. Under the influence of various external forcings such as weather systems, air-sea coupling modes, and human activities, marine heatwaves have multi-time-scale variation characteristics. Reviewing the domestic and international main literatures, this paper reviews the main research progress on the seasonal, interannual and decadal variability and long-term trends of marine heatwave and its mechanisms. Existing studies have shown that: 1) Due to the shallow depth of the mixed layer in summer, the SST is more sensitive to the surface heating process, which leads to the most intense marine heatwave in summer and the opposite in winter. the complex local oceanic and atmospheric forcing also makes the seasonal variability of marine heatwaves have significant regional characteristics. 2) The interannual variability of marine heatwaves is mainly affected by interannual-scale coupled air-sea modes such as El Niño-Southern Oscillation (ENSO) and Indian Ocean Dipole (IOD). Among them, ENSO has the most significant impact on marine heatwaves, and its impact covers most of the world's oceans, including tropical Pacific Ocean, tropical Indian Ocean, the west coast of Australia, the Northeast Pacific Ocean and some parts of the Southern Ocean, through oceanic and atmospheric local or remote forcing. The influence of IOD is mainly concentrated in the tropical Indian Ocean and the tropical Pacific Ocean. Negative (Positive) IOD events cause the thermocline to become deeper (shallower) in the tropical southeastern Indian Ocean, weaken (enhance) the upwelling of coastal cold water, and then promote (inhibit) the occurrence of marine heatwaves. The main influenced areas of the North Atlantic Oscillation (NAO) and Atlantic Niño (ANINO) are located in the North Atlantic Ocean and the offshore west Africa, respectively. The negative phase of NAO causes large-scale warming of SST in the North Atlantic, which promotes the enhancement of marine heatwaves in the North Atlantic, while the positive phase of ANINO causes polar warm advection in the coastal waters off the west coast of Africa, leading to an increase in the number of marine heatwaves in this area. 3) Low-frequency climate fluctuations such as the Interdecadal Pacific Oscillation and the Pacific Decadal Oscillation play an important role in the interdecadal occurrence and variation of marine heatwave in the Pacific Ocean, tropical Atlantic Ocean and southeast Indian Ocean which greatly affect the occurrence and variation of global marine heatwaves by influencing changes in SST or the frequency and intensity of El Niño. 4) In addition to natural climate variability, the long-term trend of marine heatwaves is mainly affected by human activities. The results of the global climate model show that under the RCP8.5 scenario, the intensity of the marine heatwave is twice that of the RCP4.5 by 2100, and most of the world's oceans are trapped in a "permanent" marine heatwave state. At the same time, human-caused climate change also has dramatically increased the probability of some recent large and severe marine heatwave events. Finally, some important scientific issues in marine heatwaves research are discussed, and the possible development trend in future are prospected.
Under the background of the global warming, the frequency of extreme high temperature events is increasing. Although there have been many studies on the frequency and spatiotemporal distribution of high temperature around the world, there is still no unified definition of high temperature. In order to analyze the differences in high temperature events detected by different thresholds, and to strengthen the understanding of the multi-dimensional characteristics of high temperature, we detected high temperature by using different threshold methods, including three absolute thresholds (32℃, 35℃ and 38℃) and two relative thresholds (90% and 95%) based on the daily maximum temperature and daily minimum temperature data from 1979 to 2019 in the daily data set of China's surface climate data. Then, we calculated three high temperature indicators (including the absolute threshold high temperature days, absolute threshold high temperature accumulated temperature and relative threshold high temperature days) and used Sen's slope, Mann-Kendall, Hurst index and empirical orthogonal function (EOF) to analyze their trends and spatiotemporal distribution patterns, and finally compared the difference in trends and spatiotemporal distribution patterns of the high temperature indexes calculated in terms of different thresholds. The results show that: 1) The high temperature in most areas of China showed an increasing trend, but there are different in the trend and trend persistence of different high temperature indexes calculated from different thresholds. The number of stations with significant increase in high temperature days obtained by relative threshold method is much more than that by absolute threshold method. The absolute threshold method showed that the trend persistence of high temperature days was stronger in Xinjiang, South China and Huang-Huai-Hai Region, while the relative threshold method showed that the trend persistence of high temperature days was higher in southeast coast and central and western of China. 2) There are also significant differences among the patterns of EOF modes calculated from different thresholds. The second mode of high temperature indexes calculated by the absolute threshold reflected a reverse pattern of southern part of East China and most parts of southern China and other regions, while the second mode of high temperature indexes calculated by the relative thresholds reflected a reverse distribution pattern of northern and southern China. Therefore, researchers need to choose appropriate high temperature threshold according to their own research purposes and research problems.
Airborne pollen is considered to be one of the air pollutants that can cause allergic reactions in humans, then leading to the occurrence or aggravation of a series of allergic diseases. The latest study showed that the positive rate of pollen allergens in allergic rhinitis patients in urban areas of Beijing is as high as 84.3%. However, due to the differences in climatic conditions, vegetation types and plant species in different regions, the types and amount of airborne pollen are also different. Therefore, research on airborne pollen needs to be conducted in different regions. In this study, we analyzed the characteristics of airborne pollen types and concentration variations by monitoring in the north of Beijing from 1 March to 15 October 2020. The results show that: 1) The pollen season in the north of Beijing in 2020 started from 15 March (2.5% of the total annual amount) to 5 September (97.5% of the total annual amount), covering 172 days, accounting for 47.0% of the total days of the year. Among them, the days with pollen concentrations higher than 25 grains/1 000 mm2, 50 grains/1 000 mm2, 100 grains/1 000 mm2, 200 grains/1 000 mm2, 500 grains/1 000 mm2, and 1 000 grains/1 000 mm2 were 142 d, 124 d, 97 d, 73 d, 38 d, and 10 d, respectively. 2) A total of 20 pollen types were observed, among which the percentage of Cupressaceae pollen is the highest at 57.3%, followed by Moraceae (7.8%), Populus (6.6%), Pinus (6.1%), Ulmus (4.3%), Artemisia (3.9%), Rosaceae (3.6%), Betula (2.9%), Chenopodiaceae (1.7%). This is mainly because the plant species distributed in this study area are mainly trees and shrubs, especially the Cupressaceae, Salicaceae and Pinaceae, which have more higher pollen production. 3) The total concentration of airborne pollen changes significantly and exhibits a bimodal pattern, that is, March to May is the first peak (mainly tree pollen, such as Cupressaceae, Populus, Salix and Ulmus); August to September is the second peak (mainly herbaceous pollen, such as Artemisia, Chenopodiaceae and Poaceae). Pollen concentration from June to July is the lowest, all below 50 grains/1 000 mm2. The study of airborne pollen types, concentration changes and seasonal variation in the north of Beijing provides first-hand scientific data for guiding the prevention of pollinosis patients and building a healthy urban environment.
Clay dune is a special aeolian landform, study on its formation mechanism, development and evolution process are of great significance for enriching the knowledge of diversity of aeolian landscape and strengthening the understanding of aeolian geomorphic process. In this article, grain size and soluble salts of the clay dunes surface sand, crust and lacustrine sediments were determined to discuss its material sources, formation mechanism. The results show that: 1) The grain size composition of the surface sand of the clay dunes in the Suhongtu Basin is dominated by silt, and the clay component is relatively high, the grain-size frequency curve shows obvious bimodal distribution characteristics, and the mean grain-size is about 6.01 Φ, which is significantly different from those typical desert dune sand; 2) The surface sand of clay dunes and lacustrine sediments have roughly similar particle size distribution, reflecting that the lacustrine sediments are the main material source of clay dunes in the Suhongtu Basin; 3) Clay dunes are transported and accumulated as sand-sized aggregates of clay minerals by wind, which are formed by the efflorescence of salts or by the mechanical disintegration of sun-cracked crust and mud curls; 4) The differences in grain size composition, sand source and climatic conditions are the main reasons for the significant differences in morphology, mobility and sedimentary structure of clay dunes in different areas; 5) Raked red clay dunes can form by a moving barchan dune in east-west direction for bedforms growing in the bed instability mode combined with an extension arm in the southwesterly direction for dunes growing in the fingering mode.
Elevation is a very important factor for glacier development on the Tibetan Plateau and the glacier equilibrium line altitude (ELA) is the lowest limit for glacier development. However, on the Tibetan Plateau, previous studies about how many meters above the ELA of mountains can develop glacier is still scarce. Based on the glacier-climate model, the threshold altitude for glacier development (Ht) in the north and south slope of Burhan Budai Mountain, Dalijia Mountain, La Ji Mountain, east and west slope of Gongga Mountain, and Haizi Mountain on the eastern Tibetan Plateau are 5320 m, 5390 m, 4740 m, 4881 m, 4894 m, 5114 m and 5414 m, respectively and the ELA of these mountains are 5231 m, 5305 m, 4736 m, 4793 m, 4878 m, 5085 m and 5406 m respectively. Thus, the difference (Δh) between the Ht and ELA of these mountains are 89 m, 85 m, 4 m, 24 m, 16 m, 29 m and 8 m, respectively. Based on the comparative analysis of the topography, climate and relief of the five mountains in the study area, our results indicate that the changes in ice volumes on the Gongga Mountain and Burhan Budai Mountain are consistent with their positive difference of glaciation. With greater positive difference of glaciation, the size of glaciers in Gongga Mountain is larger than that of Burhan Budai Mountain. Generally speaking, the difference in slope above ELA during last glacial maximum (SELA) makes the Δh of Dalijia Mountain and Haizi Mountain, which were occupied by ice cap during late Quaternary, smaller than that of Burhan Budai Mountain, La Ji Mountain and Gongga Mountain, which mainly developed valley glaciers since the late Quaternary. Compared with other mountains in the study area, the extremely low annual precipitation at the ELA of Burhan Budai Mountain makes its Δh the largest. The Δh of the Dalijia Mountain is the smallest due to the relatively abundant annual precipitation at ELA and the relatively gentle SELA. In the marine glacial area, the lower average summer temperature at ELA and the gentler SELA make its Δh smaller than that of Gongga Mountain. The differences of Δh between east and west slope of Gongga Mountain are mainly affected by their annual precipitation at ELA. In continental glacial area, the differences of Δh between Burhan Budai Mountain, La Ji Mountain and Dalijia Mountain are dominated by the changes in annual precipitation at ELA. As a consequence, the differences of Δh between different mountains in the study area are controlled by changes in annual precipitation at ELA and SELA. This article preliminarily researches the impact of climate differences (or changes) on Δh based on the comparison of different mountains. Climate is the greatest factors impacted on the development of glaciers. Changes in climate will cause changes in the surface environment of earth and this will introduce errors for model because of our simulation commonly based on modern conditions. In addition, quantitative paleoclimatic reconstructions are scarce in glaciated areas, which restrict the application of the model. Further research should be applied to explore the changes in Ht under climate fluctuations based on more robust paleoclimate data.