祁添垚 , 张强, 王月
QI Tian-yao, ZHANG Qiang, WANG Yue
中图分类号: P426.2+1
文献标识码: A
文章编号: 1000-0690(2015)12-1599-08
通讯作者:
收稿日期: 2014-12-9
修回日期: 2015-04-10
网络出版日期: 2015-01-20
版权声明: 2015 《地理科学》编辑部 本文是开放获取期刊文献,在以下情况下可以自由使用:学术研究、学术交流、科研教学等,但不允许用于商业目的.
基金资助:
作者简介:
作者简介:祁添垚(1989-),男,广东东莞人,硕士,主要从事气象水文学研究。E-mail:qity@foxmail.com
展开
摘要
针对蒸发悖论这一科学问题,对1960~2005年的蒸发皿蒸发资料进行系统研究,全面分析中国蒸发皿蒸发量变化特征、探究中国各气候区蒸发皿蒸发变化的敏感因子及主要影响因素。研究表明: ① 利用模糊聚类FCM算法,将中国分成3个蒸发皿蒸发量变化差异区:东中南分区(中国南部、中部、西南部以及东部);西北分区(中国西北部)和中国东北至西南的狭长分布带;② 蒸发皿蒸发量变化趋势分布具有明显区域性:中国南部、东部、中部及西北部,蒸发皿蒸发量以显著下降趋势为主,其中显著上升站点零星分布于东南沿海、西南、洞庭湖及西北地区的西北部;中国东北部至西南狭长分布带中密集分布显著上升及无明显变化趋势的站点;③ 对蒸发皿蒸发量与4种气象要素进行敏感性分析,研究发现东南分区、西北分区和狭长分布带的敏感因子均为相对湿度。由此可知,相对湿度是影响中国蒸发皿蒸发量变化的关键因子。
关键词:
Abstract
Taking pan evaporation paradox as a key scientific assumption, this study collected and analyzed daily meteorological data from 588 rain stations over China using FCM regionalization method and Modified Mann-Kendall trend test. The results indicate that: 1) China is divided into 3 homogeneous climate regions with the help of FCM algorithm of fuzzy clustering: East-middle-south region (the south, middle, southwest and east China); West-north region(the northwest China); A long and narrow strip between the cluster a and b extending from northeast to southwest China; 2) significant decreasing pan evaporation can be found in southern, central, southwestern, eastern and northwestern China. Stations with significant increasing pan evaporation seem to be distributed sporadically across China. Besides, the strip zone extending in the NE-SW direction is dominated by significant/non-significant increasing trends of pan evaporation; 3) Sensitivity analysis indicates that relative humidity is the principal influencing factor for pan evaporation. Generally, in northwestern, northern and northeastern China, relative humidity has an adverse relation with pan evaporation, implying pan evaporation paradox in China and also intensifying hydrological cycle in these regions. In southeastern China, particularly the middle and lower Yangtze River basin and the Pearl River basin, relations between pan evaporation and relative humidity are relatively complex, showing that more factors than relative humidity can have impacts on pan evaporation changes, such as cloud coverage, temperature and aerosol concentration. Local features of aerodynamic and radiative drivers of the hydrological cycle and their regional responses to climate changes, and also different features of underlying ground may play considerable roles in pan evaporation changes.
Keywords:
蒸发是水文循环研究中极为重要的一环节,其演变过程涉及能量平衡与水量平衡。不少研究表明,过去几十年中,地表温度在不同地区以不同速度上升[1~3]。一般情况下,气温上升会导致蒸发量增加[4~6]。然而,观测资料表明蒸发皿蒸发量呈现显著下降趋势[7~9],这一现象称为蒸发悖论。Peterson[7]等于1995年发现1950~1990年美国与前苏联地区的蒸发皿蒸发量呈下降趋势,并由此得出水循环中陆地蒸发减少的结论。Brutsaert等[10]于1998年为解释蒸发佯谬,认为蒸发皿蒸发量的减少恰恰是由于陆地蒸发量增加引起的。Roderick和Farquhar[4]于2002年表明太阳总辐射下降致蒸发皿蒸发量下降,而云量和气溶胶的增加又是前者的成因。国内学者对此已有大量研究,盛琼[11]利用全国468个气象站1957~2001年蒸发皿蒸发量及其他气象因子同步实测资料,研究得出,引起蒸发皿蒸发量下降的主要因子为辐射、气温日较差、风速,而湿度因子影响最小。王艳君等[12]利用长江流域115个气象站点1961~2000年的观测数据,发现长江流域蒸发皿蒸发量、参照蒸发量和实际蒸发量的年平均变化均呈现显著下降趋势。左洪超[13]认为蒸发皿蒸发量是多环境因子共同非线性相互作用的结果,并利用中国有长期太阳辐射观测的62个常规气象站1961~2000年的观测资料,通过蒸发皿蒸发量与气象因子的相关分析对其进行验证,表明只利用单个环境因子的变化来解释蒸发皿蒸发量的气候变化会产生偏颇。曾燕等[14]通过对全国664个气象站点20 cm口径蒸发皿资料的分析,发现就平均而言,1960~2005年中国蒸发皿蒸发量呈明显减少趋势,并认为日照百分率减少造成的太阳总辐射减少是主要原因。刘敏[8]等挑选了全国671个站点1955~2001年的资料证明中国蒸发皿蒸发量存在减少趋势,气温日较差和平均风速的减小与蒸发皿蒸发量的减少具有最显著的相关性,是蒸发皿蒸发量减少的影响因子。刘昌明等[15]根据中国1960~2007 年的653 个气象台站的常规气象观测资料,采用优化太阳辐射计算的Penman-Monteith 潜在蒸散发计算方法,分析了中国10 大流域片区的潜在蒸散发对最高气温、最低气温、风速、太阳辐射、水汽压的敏感性及其区域分异。而马雪宁[16]等利用黄河流域72 个气象站点1960~2010 年的气象资料,系统分析了过去51 a间气温、降水量以及潜在蒸散量的变化趋势,得到近51 a来风速的明显减小是导致黄河流域潜在蒸散量减少的主导因素的结论。
上述研究对于科学理解区域水循环变化具有重要意义,但是,由于研究区域不同,站点数不同等诸多因素,研究结论多有差异。本文基于蒸发及水循环研究的重要性,基于1960~2005年全国588个气象站蒸发皿蒸发量数据及其他气象变量的观测资料,全面分析蒸发皿蒸发变化及可能影响因子,得出区域水汽循环特征与蒸发悖论在中国的具体体现,该研究对于理解中国区域水汽循环变化特征、对全球气候变化的区域响应相似性与差异性及水资源管理,均具有重要理论与现实意义。
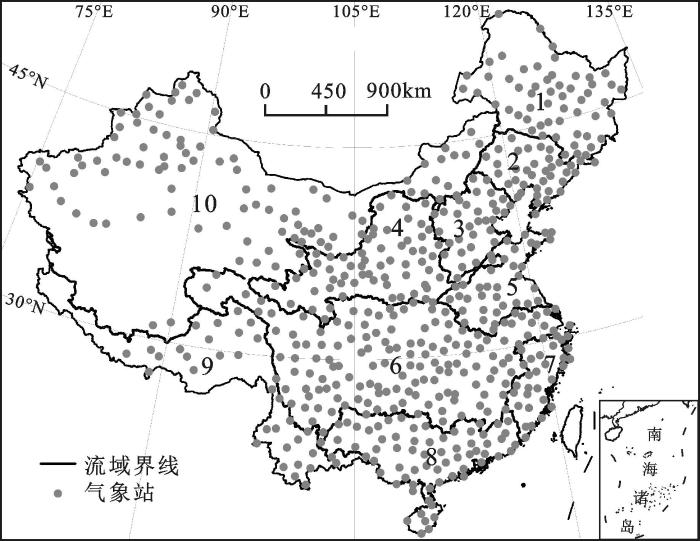
图 1 中国588个气象测站分布
注:1 松花江流域;2 辽河流域;3 海河流域;4 黄河流域;5 淮河流域;6 长江流域;7 东南诸河流域;8 珠江流域;9 西南诸河流域;10 西北诸河流域。
Fig.1 Locations of 588 meteorological stations considered in this study
本文采用中国588个气象站1960~2005年包括气压、气温、水汽压、相对湿度、低云量、风速、降水量、日照时数、20 cm蒸发皿蒸发量等14种气象观测量的气象要素观测值,研究蒸发量的年及季节变化。所分析资料由国家气象中心提供。对于缺测的蒸发皿蒸发量,通过建立其与本站干球气温、相对湿度及风速等多元线性回归模型进行插补(相关系数在0.82~0.98之间),能很好的满足分析对数据的质量要求。
1.2.1 模糊聚类分析
聚类分析是根据数据相似性,将其归到不同集合中。而模糊聚类分析则是建立在模糊理论之上,超越 “非此即彼”的传统聚类分析,更贴近实际数据内在结构。最常用模糊聚类为模糊c均值算法(Fuzzy C-Means算法,简称FCM)[17],分类效果评定见表1所示。在实际应用中,须综合运用上述指标,从不同侧面反映分类的情况,假定不同c值,根据表1中7种指标进行判定衡量。特别地,当不同c值表现出类似效果时,取c值较小者为宜。
1.2.2 Modified Mann-Kendall趋势检验
MK法假定样本独立随机分布[18,19],而实际气象水文序列大多存在序列样本自相关性。对此, Hamed和 Rao改进传统的MK趋势检验,即Modified Mann-Kendall(MMK)趋势检验方法[20]。MMK根据序列自相关性情况,对统计量S的方差Var(S)进行修正,分析结果表明,MMK于时间序列独立随机时与MK相近,而在序列存在显著自相关性情况下,可得到更为精确的结果。
分析了588个气象站年蒸发皿蒸发量自相关系数(ρS(1)),其中ρS (1) > 0.6的站点数量为90个,ρS (1) > 0.5的站点数量为184个。其他气象变量亦做此分析,由于篇幅,结果不做显示。章诞武等[21]的研究也表明,年均气温和年蒸发皿蒸发量自相关性显著,需要剔除自相关性后进行趋势检验,否则序列正自相关性会放大序列趋势的显著性。
2.1.1 分区数确定
假定分区数c=2,3,4…14,对比由不同c值得出的结果。由于单独应用某一指标是不合理的,故此列出7种不同指标,通过对比判定出最合理的分区数。通过系统分析可知,c=3或c=4较为合理。
当由指标显示出来的结果相近时,我们认为较小者(c=3)为较好的结果。
表1 评价模糊聚类分析分区的7种指标
Table 1 Definitions of 7 indices which describe the goodness of clustering by FCM algorithm
| 指标 | 定义 |
|---|---|
| Partition Coefficient(PC) | |
| Classification Entropy(CE) | |
| Partition Index(SC) | |
| Separation Index(S) | |
| Xie and Beni's Index(XB) | |
| Dunn's Index(DI) | |
| Alternative Dunn Index(ADI) |
2.1.2 分区结果
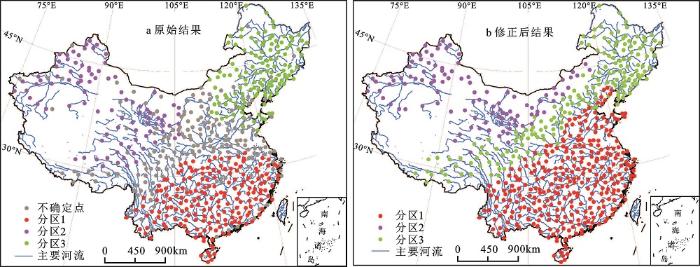
根据3个分区结果可得相应隶属矩阵。事实上,隶属度最大并不意味着该点属于相应矩阵,还应根据实际情况判定。由于输入模糊聚类分析模型的数据常是多维的,本文使用Sammon Mapping将结果投影至二维平面。由图2a知,中国西藏、甘肃、青海、河北、内蒙古、辽宁、福建等地有相当一部分站点尚未加以分类。结合站点所处地理位置、气候条件及蒸发皿蒸发量变化趋势,对上述未分类站点重新分类(图2b),研究结果与刘敏[8]根据年降水量和蒸发皿蒸发量计算干旱指数,再对全国进行气候分区的分区结果,及张强等[19]根据参照蒸发量变化性质得出的中国分区模式相一致,充分说明本文的分区结果具有可靠性与合理性。
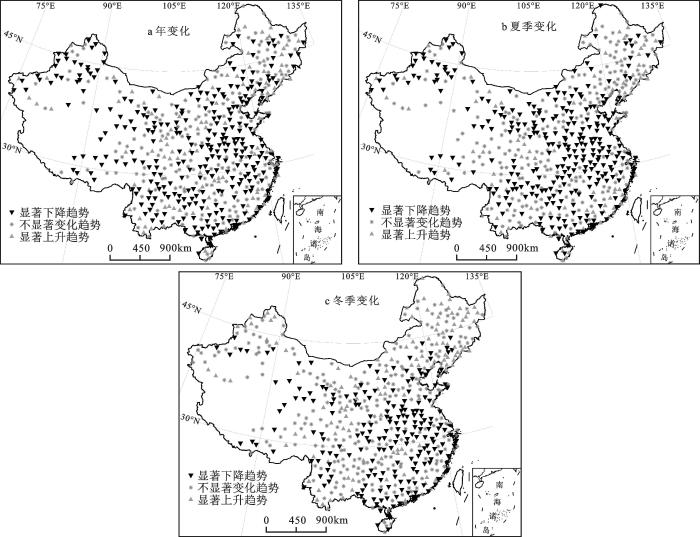
图3为中国蒸发皿蒸发量MMK趋势空间分布图。由图3a可知,位于中国西北部的新疆内流区、甘蒙内流区、青海内流区、西藏内流区及雅鲁藏布江流域,绝大部分地区蒸发皿蒸发量均呈显著下降趋势。海河、淮河、珠江、东南沿海、澜沧江与怒江、长江中下游及黄河中下游等流域,蒸发皿蒸发量均以显著下降趋势为主,其中显著上升的站点零星分布于澜沧江与怒江流域南部、东南沿海诸河流域及洞庭湖流域。而松花江、辽河、长江上游和黄河上游等流域,蒸发皿蒸发上升趋势显著或者无明显变化。由此可识别出3个蒸发皿蒸发量变化差异区:① 东中南分区(中国西南、南部、中部、东部);② 西北分区(中国西北部);③ 位于以上2个分区之间、从东北延伸值西南的狭长分布带。可见如此通过蒸发皿蒸发量变化趋势识别得出的空间分布模式与基于FCM算法的分区成果相吻合。
夏季蒸发皿蒸发量变化趋势与年尺度的相差甚微(图3b),所不同之处在于对比年尺度更多站点呈显著下降或无显著变化趋势,这些站点主要分布于东北地区、洞庭湖流域及珠江流域上游等区域(图3a,图4b),表明较年尺度而言,夏季蒸发皿蒸发量下降趋势更为显著。冬季蒸发皿蒸发量变化趋势与年尺度的亦相差不大(图3c)。西北地区,很多在年尺度上表现显著下降的站点于冬季展现出显著上升趋势或无变化。东北地区变化尤其明显,冬季蒸发皿蒸发量显著下降的站点只有6个,而西南地区大部分站点变化趋势性质也发生转变,由年尺度的显著下降变成冬季的无明显变化。无论是狭长分布带还是西北、东中南分区,蒸发皿蒸发量相对于年尺度上升趋势更为明显。
图3 蒸发皿蒸发量变化空间分布
Fig.3 Spatial and temporal distribution of changes of pan evaporation
张强等[22]在研究参照蒸发量敏感性因子的过程中,利用参照蒸发量与4种气象要素MK趋势检验量的相关关系进行探究,其机理在于因变量与自变量变化趋势越相似,因变量与自变量之间的敏感性越强。特别地,这种考虑因变量变化趋势和自变量变化趋势之间的相关关系敏感性分析方法又是与McCuen[23]1974年提出敏感性系数的概念(即蒸发的变化率与气象变量的变化率的比率)本质是相同的。但相比之下研究两者相关关系所涉及的计算更为便捷,因而,本文将采用张强等[22]所用的敏感性分析方法进行敏感性分析。
图4 各分区中MMK趋势值与4种气象变量(气温、相对湿度、风速以及日照时数)相关系数
注:a,东南分区;b,西北分区;c,狭长分布带。带圆圈的星号表示显著相关。
Fig.4 Correlation coefficients between MMK trends of pan evaporation and the four meteorological variables in each partition
表2列出了3大分区内蒸发皿蒸发量与4种气象要素MMK趋势检验量的相关系数。因其他气象变量与蒸发皿蒸发的相关关系极小,因此本文只考虑4种主要气象变量。分析结果表明,在东南分区相关系数最大的为相对湿度(r=-0.30),其次为风速(r=0.21),日照时数以及气温(r=0.18)(图4a,表2)。与年尺度变化均相一致:4种变量均通过了95%置信水平检验,且相对湿度的相关系数最大,故相对湿度可为东南区蒸发皿蒸发量变化的敏感性因子。在西北区,与蒸发皿蒸发年变化相关的气象因子,按相关性由大到小分别为相对湿度(r=-0.32),气温(r=0.31),风速(r=0.29)和日照时数(r=0.25)(图4b,表2)。但在冬季,气温(r=0.09)、风速(r=0.04)及日照时数(r=0.17)没有通过95%置信水平检验,因而相对湿度为西北区蒸发皿蒸发量的敏感因子。在狭长分布带,敏感气象因子主要为相对湿度(r=-0.30)和风速(r=0.26)之间(图4c,表2)。然而风速在夏季与蒸发皿蒸发量的相关性没有通过95%置信度水平检验,因而,风速不是该区域内影响蒸发皿蒸发量变化的敏感性因子。刘闻等[24]对渭河流域关中段潜在蒸发量进行研究,也发现年均潜在蒸发量与日较差、平均气温、平均风速、日照时数呈正相关,与相对湿度和水汽压呈负相关,说明文中表2具有适用性。
表2 蒸发皿蒸发量与4种主要气象变量MMK统计量的相关系数
Table 2 Sensitivity of pan evaporation to meteorological variables evaluated by correlation coefficients between MMK trends of pan evaporation and the four meteorological variables
| 东南分区 | 西北分区 | 狭长分布带 | ||||
|---|---|---|---|---|---|---|
| 相关系数 | P值 | 相关系数 | P值 | 相关系数 | P值 | |
| 年变化 | ||||||
| 气温 | 0.18 | 0.00 | 0.31 | 0.00 | 0.04 | 0.58 |
| 相对湿度 | -0.30 | 0.00 | -0.32 | 0.00 | -0.26 | 0.00 |
| 风速 | 0.21 | 0.00 | 0.29 | 0.00 | 0.22 | 0.00 |
| 日照时数 | 0.18 | 0.00 | 0.25 | 0.01 | 0.13 | 0.08 |
| 夏季 | ||||||
| 气温 | 0.45 | 0.00 | 0.41 | 0.00 | 0.23 | 0.00 |
| 相对湿度 | -0.46 | 0.00 | -0.40 | 0.00 | -0.46 | 0.00 |
| 风速 | 0.23 | 0.00 | 0.35 | 0.00 | 0.17 | 0.02 |
| 日照时数 | 0.36 | 0.00 | 0.29 | 0.00 | 0.28 | 0.00 |
| 冬季 | ||||||
| 气温 | 0.18 | 0.00 | 0.09 | 0.38 | 0.07 | 0.36 |
| 相对湿度 | -0.45 | 0.00 | -0.38 | 0.00 | -0.30 | 0.00 |
| 风速 | 0.27 | 0.00 | 0.04 | 0.65 | 0.11 | 0.16 |
| 日照时数 | 0.24 | 0.00 | 0.17 | 0.08 | -0.01 | 0.88 |
总言,中国蒸发皿蒸发量变化的敏感因子为相对湿度。刘昌明等[15]的研究也表明,全国范围内,潜在蒸散发对气象因子的敏感性为:水汽压>最高气温>太阳辐射>风速>最低气温。尽管水汽压与相对湿度之间存在一定差异,但它们之间的一致性可以表明水分因子对蒸发皿蒸发变化的显著影响。
影响蒸发皿蒸发量变化的因子众多,可将其分为动力因子、热力因子和水分因子。通过对气象因子的敏感性分析可知,风速、日照时数及相对湿度分别是上述3种类型气象变量中最敏感的。因而,通过对比风速、日照时数及相对湿度3种不同类型的气象因子,探讨不同地区引起蒸发皿蒸发量变化的影响因子。
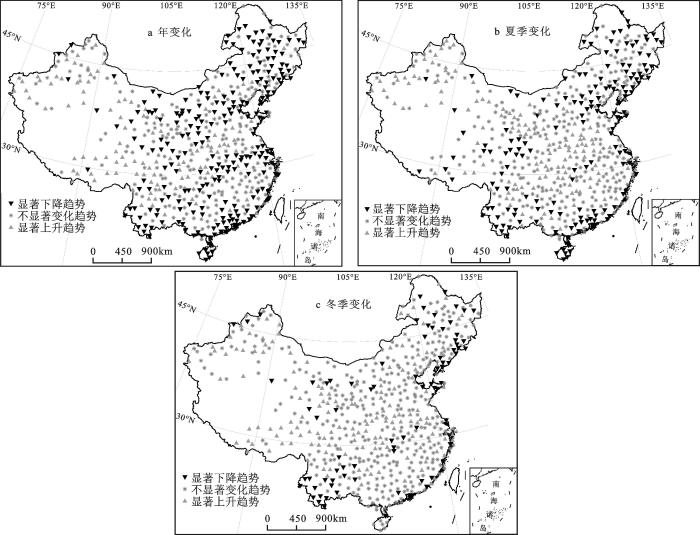
由于相对湿度为中国蒸发皿蒸发变化的关键影响因子,对其时空分布特征进行分析(图5)。对于年尺度的分布,中国西北、28°N~ 32°N地区,相对湿度均呈显著上升趋势,而无显著变化趋势站点的分布与显著上升的站点呈交叉出现,且在长江中下游、珠江和东南诸河流域部分地区集中分布(图5a)。在35°N以北、100°E以东区域,相对湿度以下降趋势为主。上述区域与蒸发皿蒸发量的变化在空间呈相反模态,显示上述区域相对湿度的变化对蒸发皿蒸发变化的显著影响。西北地区降水增多,潜在蒸发量大,因而相对湿度增加;而华北与东北地区,降水量减少,从而导致相对湿度减少[25]。而在中国东南部地区,如长江中下游及珠江流域,蒸发皿蒸发与相对湿度变化的空间模态相近,由此可推断,在中国东南部地区,除相对湿度以外,其他因素也可能对蒸发皿变化有显著影响,下文将对此进行进一步讨论。夏季相对湿度变化(图5b)与相对湿度年尺度变化相近,不同的是,在东北地区、长江中下游地区,相对湿度变化趋势不显著或有显著上升。在30°N以北区域,夏季相对湿度(图5b)显著上升(下降)站点基本与蒸发皿蒸发量夏季显著下降(上升)站点的空间分布相吻合。而在冬季,相对湿度变化趋势与年尺度和夏季变化相比,上升趋势显著,尤其在中国东北及东南沿海一带,更多站点相对显度呈显著上升或无明显变化(图5c)。图5c与图4c对比分析可见,蒸发皿蒸发量在西北分区和狭长分布带的关键影响因子为相对湿度。
图5 相对湿度变化的空间分布
Fig.5 Spatiotemporal distribution of changes of relative humidity
利用FCM算法对中国进行气候分区,并应用MMK趋势检验法对中国1960~2005年蒸发皿蒸发量进行趋势分析,并对蒸发皿蒸发量与4种气象要素MMK趋势检验结果进行相关分析,辨识各分区蒸发皿蒸发变化的敏感性因子,主要结论如下:
1) 根据蒸发皿蒸发量变化趋势的空间分布将中国分成3大区域:东中南分区(中国南部、中部、西南部以及东部);西北分区(中国西北部)和中国东北至西南的狭长分布带。
2) 蒸发皿蒸发量的年变化趋势空间分布具有明显区域性:中国南部、东部、中部以及西北部,蒸发皿蒸发量以显著下降趋势为主,其中显著上升的站点零星分布于东南沿海、西南地区、洞庭湖以及西北地区的西北部;中国东北部至西南的狭长分布带,蒸发皿蒸发呈显著上升及无明显变化趋势。
3) 在中国,影响蒸发皿蒸发变化的关键影响因子是相对湿度,中国境内蒸发皿蒸发下降的主要原因是大气相对湿度增加,这正是陆地/水面蒸发增加、水循环加剧的重要表现,也是蒸发皿蒸发悖论在中国的主要体现。由于影响蒸发皿蒸发变化的影响因子同时也受其他因素影响,如日照时数与气温,受区域雾霾天气、云量、阴雨天气等影响,因而,导致不同区域蒸发皿蒸发变化成因辨识的难度增加,这也是水循环研究的难点之所在。研究对于理解在全球气候变化与人类活动影响下,区域水循环对全球气候变化的响应特征与差异性,具有重要理论与科学意义;同时,也为区域水资源管理与农业规划,提供重要科学依据。
The authors have declared that no competing interests exist.
| [1] |
中国近一百年来的温度变化 [J].https://doi.org/10.7519/j.issn.1000-0526.1994.12.008 URL [本文引用: 1] 摘要
对我国近百年来温度变化的研究工作和结果作了综述,发现我国增温趋势与北半球的情况大致相似,但在具体的变化过程和幅度上又与全球变化存在明显差异,这包括:(1)我国温度出现最高的时期是在40年代,而不是80年代以后;(2)我国的西南地区自50年代以来一直在降温,增暖主要出现在东北、华北和西北西部地区;(3)近百年来中国温度变化出现两次突变,一次在1919年,一次在1952年。作者还讨论了城市化对温度测量
|
| [2] |
近百年全球气候变暖的分析 [J].https://doi.org/10.3878/j.issn.1006-9895.1995.05.04 URL Magsci |
| [3] |
1951-2002年中国东、西部地区地面气温变化对比 [J].
利用1951~2002年全国733个测站经过非均一性检验的月平均气温资料,在剔除50万以上人口大城市测站后,分析了52年来中国东、西部及青藏高原地区的气温变化趋势的一致性和差异性,并讨论了其可能原因.结果表明我国东、西部地区年、季平均气温变化有着较好的一致性;近52年来,我国东、西部和青藏高原地区年平均气温均呈升温趋势,年平均气温的增温速率东部为026℃/10a,西部018℃/10a,东部比西部高008℃/10a;季平均气温东部地区冬、春季的增暖趋势大于西部和青藏高原,而其夏、秋季的增暖趋势小于西部和青藏高原.我国东、西部地区年、季平均气温变化关系密切,说明其主要是受全球气候变化的影响而变化,但东部年平均气温的增暖总趋势大于西部,又说明地域差异在气温变化中也有重要作用.
|
| [4] |
The cause of decreased pan evaporation over the past 50 years [J].https://doi.org/10.1126/science.1075390 URL PMID: 12434057 [本文引用: 2] 摘要
Changes in the global water cycle can cause major environmental and socioeconomic impacts. As the average global temperature increases, it is generally expected that the air will become drier and that evaporation from terrestrial water bodies will increase. Paradoxically, terrestrial observations over the past 50 years show the reverse. Here, we show that the decrease in evaporation is consistent with what one would expect from the observed large and widespread decreases in sunlight resulting from increasing cloud coverage and aerosol concentration.
|
| [5] |
The global soil moisture data bank [J].https://doi.org/10.1175/1520-0477(2000)081<1281:TGSMDB>2.3.CO;2 URL 摘要
Abstract Soil moisture is an important variable in the climate system. Understanding and predicting variations of surface temperature, drought, and flood depend critically on knowledge of soil moisture variations, as do impacts of climate change and weather forecasting. An observational dataset of actual in situ measurements is crucial for climatological analysis, for model development and evaluation, and as ground truth for remote sensing. To that end, the Global Soil Moisture Data Bank, a Web site (http://climate.envsci.rutgers.edu/soil—moisture) dedicated to collection, dissemination, and analysis of soil moisture data from around the globe, is described. The data bank currently has soil moisture observations for over 600 stations from a large variety of global climates, including the former Soviet Union, China, Mongolia, India, and the United States. Most of the data are in situ gravimetric observations of soil moisture; all extend for at least 6 years and most for more than 15 years. Most of the stations have grass vegetation, and some are agricultural. The observations have been used to examine the temporal and spatial scales of soil moisture variations, to evaluate Atmospheric Model Intercomparison Project, Project for Intercomparison of Land—Surface Parameterization Schemes, and Global Soil Wetness Project simulations of soil moisture, for remote sensing of soil moisture, for designing new soil moisture observational networks, and to examine soil moisture trends. For the top 1—m soil layers, the temporal scale of soil moisture variation at all midlatitude sites is 1.5 to 2 months and the spatial scale is about 500 km. Land surface models, in general, do not capture the observed soil moisture variations when forced with either model—generated or observed meteorology. In contrast to predictions of summer desiccation with increasing temperatures, for the stations with the longest records summer soil moisture in the top 1 m has increased while temperatures have risen. The increasing trend in precipitation more than compensated for the enhanced evaporation.
|
| [6] |
Is the hydrological cycle accelerating? [J].https://doi.org/10.1126/science.1078972 URL [本文引用: 1] 摘要
As global climate warms, most atmospheric scientists believe that evaporation will increase and as a result, the hydrological cycle will accelerate. But results from a network of water-filled pans used to monitor evaporation suggest that the opposite may be happening. In this Perspective, Ohmura and Wild review the evidence for and against an accelerated hydrological cycle. They highlight a new explanation for the pan evaporation data by Roderick and Farquhar , but warns that the issue is far from resolved.
|
| [7] |
Evaporation losing its strength [J].https://doi.org/10.1038/377687b0 URL [本文引用: 2] 摘要
CiteSeerX - Scientific documents that cite the following paper: Evaporation losing its strength
|
| [8] |
近50年中国蒸发皿蒸发量变化趋势及原因 [J].https://doi.org/10.3321/j.issn:0375-5444.2009.03.001 URL Magsci [本文引用: 2] 摘要
采用Mann-Kendall 趋势检验方法、完全相关系数法及多元线性回归模型分析了中国全域及其各气候区近50年的蒸发皿蒸发量变化趋势及原因。结果表明,中国蒸发皿蒸发量存在减少 趋势,区域平均减少速率为17.2mm/10a;其中湿润区减少速率最大,为29.7mm/10a;半干旱半湿润区次之,为17.6mm/10a;干旱区 最小,为5.5mm/10a。四季中,夏季减少速率最大,全国平均减少速率为16.2mm/10a,其次为春季,为9.7mm/10a,秋冬两季减少速率 较小。中国蒸发皿蒸发量存在显著减少趋势的地区主要分布在湿润区的长江中下游地区、华南地区和云贵两省,半干旱半湿润区的黄淮海地区、山东半岛和藏东地 区,以及干旱区的新疆、甘肃中部和青海省等。完全相关系数法分析表明,气温日较差和平均风速的减小与蒸发皿蒸发量的减少具有最显著的相关性,是蒸发皿蒸发 量减少的影响因子。气温日较差的减小主要由云量和人类活动所引起的气溶胶及其他污染物的增加引起,这导致到达地面的太阳辐射强度减弱;而平均风速的减小则 主要与全球变暖背景下亚洲冬季风和夏季风减弱导致我国平均风速的减小有关。
|
| [9] |
1960~2000年中国蒸发皿蒸发量的气候变化特征 [J].
利用中国664个气象站1960-2000年20 cm口径蒸发皿资料,借助地理信息系统Arc GIS,分析了中国蒸发皿蒸发量的气候变化趋势.结果表明,就中国平均而言,1960-2000年中国蒸发皿蒸发量呈明显下降趋势,年蒸发皿蒸发量在20世纪80~90年代较60~70年代下降了99.8 mm,下降幅度为5.8%;不同季节对照发现,蒸发皿蒸发量的下降主要表现在春季、夏季和冬季,秋季不明显;对蒸发皿蒸发量气候变化的空间分析表明,年蒸发皿蒸发量的下降主要表现在华东和中南地区;对蒸发皿蒸发量下降的原因分析表明,日照百分率下降从而导致太阳总辐射的下降可能是近年来蒸发皿蒸发量下降的主要原因.
|
| [10] |
Hydrological cycle explains the evaporation paradox [J]. |
| [11] |
近45a来我国蒸发皿蒸发量的变化及原因分析[D] . |
| [12] |
长江流域20cm蒸发皿蒸发量的时空变化 [J].https://doi.org/10.3321/j.issn:1001-6791.2006.06.013 URL Magsci [本文引用: 1] 摘要
利用长江流域107个气象站1951—2000年的20cm口径蒸发皿逐日蒸发资料,采用Mann-Kendall趋势检验法和IDW反距离权重空间插值法分析了近50年来,尤其是20世纪90年代长江流域的年和季节蒸发皿蒸发量的时空变化。50年来,长江流域以年平均、夏季和秋季蒸发皿蒸发量显著下降为主要特点,尤以20世纪90年代最为显著,是年平均和夏季蒸发皿蒸发量最小的时期,比前40年平均值分别低-25.9mm和-36.1mm,这种趋势中下游地区比上游地区明显得多,尤其是在鄱阳湖流域。
|
| [13] |
蒸发皿蒸发量的物理意义、近40年变化趋势的分析和数值试验研究 [J].
依据边界层梯度输送理论和能量守恒原理分析了蒸发皿蒸发量的物理意义,蒸发皿蒸发量是多环境因子共同非线性相互作用的结果,并利用我国有长期太阳辐射观测的62个常规气象站观测资料,通过蒸发皿蒸发量与环境气象因子的相关分析对其进行了验证. 分析了近40年蒸发皿蒸发量和环境气象因子的变化趋势,分析结果也表明只利用单个环境因子的变化来解释蒸发皿蒸发量的气候变化会产生偏颇,譬如将蒸发皿蒸发量的逐年减少归因于地表接收的太阳辐射减少的解释在中国东部比在中国西部较合理. 分析1983~2001年间国际卫星云气候计划观测的资料得出,我国大部分地区的总云量保持微小的减少趋势而总云水路径处于明显的增加趋势,这表明云变得更不透明了,它的物理属性发生了明显的变化;预示着大气可降水量有逐年增加的趋势, 地气系统变得更湿润. 结合水循环过程,利用大气环流模式用数值方法证明地气系统的水汽变化能引起陆地近地层大气相对湿度、地表接收的太阳总辐射和地表潜在蒸发量的明显变化.
|
| [14] |
1960~2000年中国蒸发皿蒸发量的气候变化特征 [J].https://doi.org/10.3321/j.issn:1001-6791.2007.03.001 URL Magsci [本文引用: 1] 摘要
利用中国664个气象站1960-2000年20 cm口径蒸发皿资料,借助地理信息系统Arc GIS,分析了中国蒸发皿蒸发量的气候变化趋势.结果表明,就中国平均而言,1960-2000年中国蒸发皿蒸发量呈明显下降趋势,年蒸发皿蒸发量在20世纪80~90年代较60~70年代下降了99.8 mm,下降幅度为5.8%;不同季节对照发现,蒸发皿蒸发量的下降主要表现在春季、夏季和冬季,秋季不明显;对蒸发皿蒸发量气候变化的空间分析表明,年蒸发皿蒸发量的下降主要表现在华东和中南地区;对蒸发皿蒸发量下降的原因分析表明,日照百分率下降从而导致太阳总辐射的下降可能是近年来蒸发皿蒸发量下降的主要原因.
|
| [15] |
中国地表潜在蒸散发敏感性的时空变化特征分析 [J].https://doi.org/10.11821/xb201105001 URL Magsci [本文引用: 2] 摘要
潜在蒸散发是农田灌溉管理、作物需水量估算、稀缺资料地区水量平 衡等研究中的重要参量,分析其对气象因子的敏感性有助于农业水资源优化配置和气候变化对水资源的影响研究.根据中国1960-2007年的653个气象台 站的常规气象观测资料.采用优化太阳辐射计算的Penman-Monteith潜在蒸散发计算方法,分析了中国10大流域片区的潜在蒸散发对最高气温、最 低气温、风速、太阳辐射、水汽压的敏感性及其区域分异.研究结果表明:(1)采用优化后的Penman-Monteith公式,计算的潜在蒸散发与蒸发皿 蒸发量的复相关系数从0.61提高到了0.75;计算得出的潜在蒸散发在8个流域片区呈下降趋势,从流域尺度上揭示了"蒸发悖论"在中国的普遍存在. (2)空间上,海河流域片区、黄河流域片区、淮河流域片区、长江流域片区、珠江流域片区、东南诸河的潜在蒸散发对最高气温最为敏感,松花江流域片区、辽河 流域片区和西北诸河对水汽压最为敏感,西南诸河则对太阳辐射最为敏感.全国范围内.潜在蒸散发对气象因子的敏感性为:水汽压>最高气温>太阳 辐射>风速>最低气温;且各敏感系数与海拔有一定的线性相关性.(3)时间尺度上,潜在蒸散发对最高气温和太阳辐射最为敏感的月份是7月,而对最低 气温、风速和水汽压最为敏感的月份是1月.1960-2007年之间,潜在蒸散发对最高气温的敏感性呈下降趋势,而对最低气温、风速、太阳辐射和水汽压的 敏感性呈上升趋势.
|
| [16] |
“蒸发悖论”在黄河流域的探讨 [J].https://doi.org/10.11821/xb201205007 URL Magsci [本文引用: 1] 摘要
利用黄河流域72个气象站点1960-2010年的气象资料,系统分析了过去51年间气温、降水量以及潜在蒸散量的变化趋势,研究了气温、降水量与潜在蒸散量之间的长期变化趋势关系,对影响潜在蒸散量下降的主要因子进行了探讨,重点对黄河流域是否存在“蒸发悖论”进行验证。研究结果表明(1)过去51年间,黄河流域内气温增加显著、潜在蒸散量呈下降趋势,总体上存在“蒸发悖论”;(2)“蒸发悖论”具有空间上和时间上的不一致性,随着气温增加,春、夏、冬三季潜在蒸散量呈减少趋势,减少区域主要集中于山西、河南大部分区域以及甘肃、宁夏、内蒙古、陕西等少部分区域;时间上主要表现在1960-1979年潜在蒸散量变化趋势不明显,1980-2010年气温与潜在蒸散量变化趋势在空间分布上的逆向关系更加明显;(3)过去51年间,降水量无论是年际还是夏、秋季变化趋势都不明显,降水量与潜在蒸散量时空变化分布上大体呈现逆向变化关系;(4)从气象要素变化对潜在蒸散量变化的贡献率来看,近51年来风速的明显减小是导致黄河流域潜在蒸散量减少的主导因素。
|
| [17] |
A convergence theorem for the fuzzy ISODATA clustering algorithm [J].https://doi.org/10.1109/TPAMI.1980.4766964 URL PMID: 22499617 [本文引用: 1] 摘要
In this paper the convergence of a class of clustering procedures, popularly known as the fuzzy ISODATA algorithms, is established. The theory of Zangwill is used to prove that arbitrary sequences generated by these (Picard iteration) procedures always terminates at a local minimum, or at worst, always contains a subsequence which converges to a local minimum of the generalized least squares objective functional which defines the problem.
|
| [18] |
Rank Correlation Methods [M]. |
| [19] |
Nonparametric tests against trend [J].https://doi.org/10.2307/1907187 URL [本文引用: 2] 摘要
CiteSeerX - Scientific documents that cite the following paper: Nonparametric tests against trend
|
| [20] |
A modified Mann-Kendall trend test for autocorrelated data [J].https://doi.org/10.1016/S0022-1694(97)00125-X URL [本文引用: 1] 摘要
One of the commonly used tools for detecting changes in climatic and hydrologic time series is trend analysis. A number of statistical tests exist to assess the significance of trends in time series. One of the commonly used non-parametric trend tests is the Mann-Kendall trend test. The null hypothesis in the Mann-Kendall test is that the data are independent and randomly ordered. However, the existence of positive autocorrelation in the data increases the probability of detecting trends when actually none exist, and vice versa. Although this is a well-known fact, few studies have addressed this issue, and autocorrelation in the data is often ignored. In this study, the effect of autocorrelation on the variance of the Mann-Kendall trend test statistic is discussed. A theoretical relationship is derived to calculate the variance of the Mann-Kendall test statistic for autocorrelated data. The special cases of AR(1) and MA(1) dependence are discussed as examples. An approximation to the theoretical relationship is also presented in order to reduce computation time for long time series. Based on the modified value of the variance of the Mann-Kendall trend test statistic, a modified non-parametric trend test which is suitable for autocorrelated data is proposed. The accuracy of the modified test in terms of its empirical significance level was found to be superior to that of the original Mann-Kendall trend test without any loss of power. The modified test is applied to rainfall as well as streamflow data to demonstrate its performance as compared to the original Mann-Kendall trend test.
|
| [21] |
基于中国气象资料的趋势检验方法对比分析 [J].
结合全国317个气象站1956-2005年气象资料,分别利用 普通Mann-Kendall、预置白Mann-Kendall、去趋势预置白Mann-Kendall趋势检验方法分析了年降水量、年平均气温和年蒸发 皿蒸发量的趋势检验结果及自相关系数变化规律.其中,年降雨序列的自相关性不显著,3种趋势检验方法的分析结果差异不大;年平均气温和年蒸发皿蒸发量自相 关性显著,其3种方法的检验结果差异性较大,需要剔除自相关性后进行趋势检验;空间特征上,北方站点气象要素的自相关显著性较高.数据分析和数学推导表 明,序列正自相关性会放大序列趋势的显著性,序列的趋势项会增大计算的自相关系数.
|
| [22] |
Reference evapotranspiration changes in China: natural processes or human influences [J].https://doi.org/10.1007/s00704-010-0315-6 URL [本文引用: 2] 摘要
In this study, we systematically analyze the changing properties of reference evapotranspiration (ETref) across China using Penman-Monteith (P-M) method, exploring the major sensitive meteorological variables for ETref, and investigating influences of human activities, mainly urbanization in this study, on ETref changes in both space and time. We obtain some important conclusions: (1) decreasing annual and seasonal ETref is observed in the east, south and northwest China. However, a long strip lying between these regions is identified to be characterized by increasing ETref; (2) in the regions east to 100掳E, the net total solar radiation is the main cause behind the decreasing ETref. In northwest China, however, relative humidity is recognized as the most sensitive variable for the ETref; (3) in the east and south China, urbanization greatly influences the ETref by directly decreasing net solar radiation. The increased air pollution and aerosols in the highly urbanized regions are the main driving factors causing decreasing net radiation; and (4) this study reveals accelerating hydrological cycle from south to north China. Besides, increasing ETref in the source regions of large rivers in China may pose new challenges for the basin-scale water resource management. The results of this study highlight the integrated effects of climate changes and human activities on ETref changes in different regions of China, which will be of great scientific and practical merits in in-depth understanding of hydrological cycle alterations under the changing environment in China.
|
| [23] |
A sensitivity and error analysis of procedures used for estimating evaporation [J]. |
| [24] |
渭河流域关中段潜在蒸发量时空变化特征 [J].
根据渭河流域关中段11个主要代表气象站点1955~2012年逐日气象数据,以FAOPenman-Monteith公式得出潜在蒸发量,分析渭河流域关中段潜在蒸发量的时空变化特征。结果表明①渭河流域关中段年平均潜在蒸发量在1073.9~1284.1mm,流域内多年平均蒸发量随着海拔的降低逐渐增高。②夏季潜在蒸发量在327.6~547.2mm,占全年的34%~42%,变化趋势与全年潜在蒸发量变化趋势高度一致。③渭河关中段随气温上升,潜在蒸发量减少。④年均潜在蒸发量与日较差、平均气温、平均风速、日照时数呈正相关,与相对湿度和水汽压呈负相关。
|
| [25] |
Statistical behaviors of precipitation regimes in China and their links with atmospheric circulation 1960-2005 [J].https://doi.org/10.1002/joc.2193 URL Magsci [本文引用: 1] 摘要
In this study, we comprehensively analysed daily precipitation time series of 590 rain stations in China covering 1960–2005. Ten indices were defined to evaluate changing patterns of precipitation regimes and trend detection was performed using Mann–Kendall trend test and linear regressive technique. For the sake of better understanding of underlying causes behind changing properties of precipitation regimes, we also investigated spatial and temporal variations of atmospheric circulation of water vapour flux. The results revealed different changing properties of precipitation events across China. Generally, wet tendency was identified in the south China and dry tendency in north China. Besides, slight wet tendency could be found in northwest China. In addition, increasing precipitation intensity could be observed mainly in the lower Yangtze River basin and the Pearl River basin. Remarkable seasonal shifts of wet/dry conditions were also detected in China: wet tendency in winter and dry tendency in summer. Furthermore, this study revealed good agreement between spatial distribution of precipitation regimes and water vapour flux, showing tremendous influences of water vapour flux on the precipitation changes across China. Regions east to 100°E were dominated by increasing water vapour flux in winter. Weaker East Asian Summer Monsoon was the main cause responsible for decreasing northward propagation of water vapour flux, causing different wet (dry) tendency in south (north) China. This study can provide theoretical evidence for effective water resource management and sound arrangement of agriculture activities on river basin scale under the changing environment across China. Copyright 08 2010 Royal Meteorological Society
|

/
| 〈 |
|
〉 |
